The BEST Chart Colours For Trading With!I often used to struggle with how to find the best chart colours to trade with but I never could quite pick between clear white or clear black. It's an often overlooked topic but when clarity, contrast, sharpness all depend on how well you see patterns, candles or your preferred techniques, it's one of the most crucial. So here's what I found out:
White is a no-go for various reasons. Firstly, it's a very bright and sharp colour that will be the focus of your eye. Secondly, depending on your laptop/PC it can be very bright, leading you to turn down brightness further reducing your vision. It's not great at night either to check the charts for an hour before bed and your screen is blinding.
Black is also a no-go as it's the exact opposite of my last point. It blends in to easily to the background leaving you feeling as if there's not enough brightness when your candles are often a darker colour also. If your laptop/PC monitor is a mid-lower end, it won't have the brightness to really pop out and if it's not an OLED panel you will also find the black isn't true black, but more of a dark grey. Not a good idea...
So this brings me to the holy grail which is: GREYSCALE!
A lot of people don't realise this but 1 in 8 men and 1 in 200 women, a total 5% of the population are colour deficient which means you have a difficulty with certain colours, differentiating certain colours and similar conditions. By setting your background to greyscale, it's a natural base colour everybody can see, it's easy on the eyes and most importantly it provides a certain contrast between the candles and the background that I never quite got with other charts.
By setting your candles to simple black borders/outlines and green/red fill, you get a really nice looking chart! Then you want your indicators and chart objects to be a sharp colour, so it really stands out, like yellow or white.
This is how you get a great looking chart so you can really see what's going on!
Simplechart

BTC in a nice bearish pattern. Based on this pattern I would assume BTC is heading south. What is your take on this?


Short Entry, H4 GBPUSDDaily GU has break through Swing point 1, H4 dominant break down, wait for retrace to entry.

Long Entry, H4 AUDJPYH4 dominant candle breakout, possible swing higher. Wait for pullback to entry.


Long Entry, H4 EURAUDDaily swing point + dominant breakout, possible downtrend reversal.
H4 swing break, wait price pullback for better R&R ratio.


Long Entry, H4 AUDUSDDaily engulfing candlestick pattern, possible price swing higher. H4 Swing point break, wait for pullback for better risk to reward ratio.

Swing High, H4 AUDJPYH4 Swing point break and engulfing candlestick pattern, price possible to move higher.

Short Entry, H4 GoldDaily dominant candle break down, possible downtrend. H4 swing point break entry.


Short Entry, H4 AUDCADDaily dominant candle break down. H4 engulfing candlestick pattern, high risk/rewards ratio.

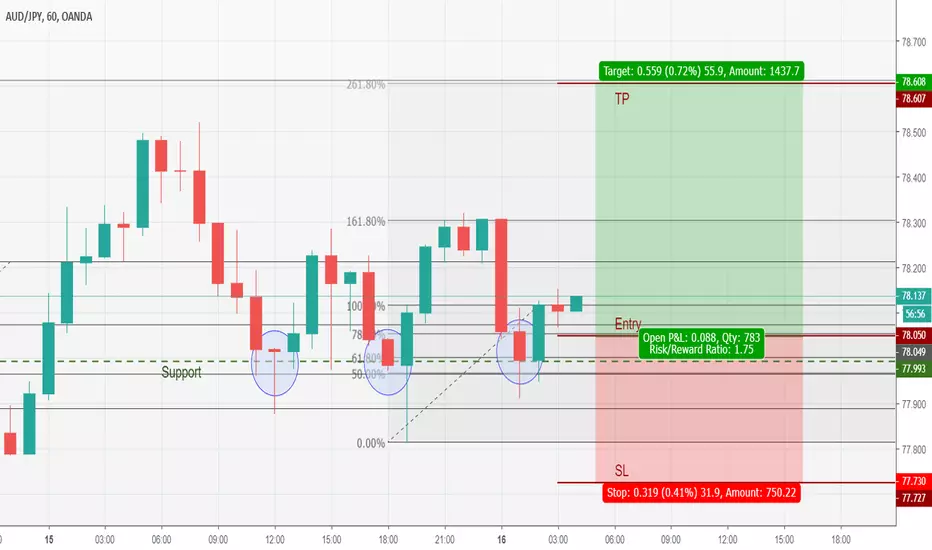
Buy Entry, H1 AUDJPYH4 Dominant candle break up. Multiple bullish candlestick patterns in H1 chart (blue circled).

Long Entry, Daily USDCHFDaily swing point 1 broken, engulfing candlestick pattern on daily support level.
Entry on daily or wait for buy setup on lower time-frame.

Time to Long /Daily ReversingCandlestick has break daily swing point 1, high possibility of daily trend reverse. Good time to look for buy entry in lower time-frame.
