Simpletrading
GBP/JPY going to Heavens?Found long setup on GJ 4H/1H trade.
1:After a complex condition of market GJ finally begins it's bullish race.
2:Market making HH/HL.
3:Break of structure to the bullish side.
4:Market testing broken level 137.600.
5:Market showing strong bullish momentum to the left side.
6:Fibs level 50% & 60% being respected.
7:200 MA also showing strength to the bullish side.
8:Market forming a wedge at the area of interest,showing that sellers are getting weak(can't make LL).
Head and Shoulders Pattern (HSP) Short ***BACKTEST***I frequently see this pattern show up all the time on any currency on any stock or future that i have traded i have seen this pattern time and time again. Specifically trading options on NADEX we can have some theta that can help us with risk management. I try and catch the right shoulder that provides us the greatest opportunity- Which gives us one of three way we can give us a confluence at this area one highlight the wick of the left shoulder or the high to the close of the last bullish candle and highlight it across to give us failures of opportunity on the right shoulder. Then if you want to get nice entries if you want extra confluence go ahead and use fibonacci along with candlestick patterns to go ahead and confirm price action. we use fib from top of head to the bottom . you see the right shoulders falls off in the highlight at the 61.8 fib aka golden ratio. For one last confluence we used Candlestick analysis on a shorter time frame giving us a RED (BE) or bullish engulfing pattern which gives us 5 reasons to enter this trade
1. HSP Pattern
2. failure of left shoulder is common occurrence with right shoulder
3. Fibonacci 61.8 right shoulder
4. Candlestick analysis RED (Bullish engulfing Pattern) (BE)
5. Risk reward is it worth it? 3:1 opportunity Yes its worth it
Keeping it simple Head and shoulders pattern I believe this pattern will play out for the bears also head and shoulders pattern play really great in Risk reward as well as a high probable trade for binary options as well as spot trading opportunities: I also know there is a lot of confluence at the level of the left shoulder failing already as i type this. i will put my SL into TP . i have a bearish engulfing signal on the 15 min that you would see but on the hourly its a RED BE WHICH IS CANDLESTICK ANALYSIS ALSO PLAYING IN. Also the risk reward is about 4:1 which is something i really like. Were keeping it simple and we will see how this plays out in the hourly
The Dragon is SOARINGA quick update on GJ from my last post. My 1HR analysis wasn't 100% spot on but.....it was pretty close. The market closed below the 1HR demand zone I had drawn just to come down and reject off another demand zone at 131.800. (Check last post to see what I'm referring to). On the 4HR time frame however, the market came down retested that 4HR (orange) ascending trend line, followed by printing an inverted hammer on the 4HR time frame all while closing above the EMA which is now acting as support. It also rejected off the 4HR demand zone I had drawn at 132.000 while printing a double bottom right on top of it and finally closing back above it. Entry was at 132.428. Currently up 334 pips and counting. The market is approaching the 136.000 level. We'll have to tune in and watch how it reacts to that level as resistance. But until I see the market print anything that tells me that it's going to drop, WE ARE GOING LONG BOYSSSSS.
*INSERTS CORNY YOUTUBE PHRASE "LIKE, COMMENT, SUBSCRIBE'*
A Simple Trading Guide to Blue Chip Stocks [symbol="NYSE:AXP"]NYHey All,
I hope everyone is flying with trading profits this year. In this video, we will go over some simple strategies for potential long term profits with the help of some simple moving day averages.
No complex graphs. No algorithms. No college degree needed.
If you have any advice for me and how I present my videos, please leave a comment down below!
Another Short!! (ofcourse)Looks like I am very bearish on every stock!! anyways
Going with the trend on this trade which is down! it is a straightforward setup, no complex pattern or anything.
Price action hit the previous structure + Fib 38.2% zone with confirmation
I did not see this trade early enough i am a day late on this trade but the green candle yesterday is showing me, market is giving me another opportunity to get in.
Trading Plan
1. Trade at open
2. Stop loss outside of the zone as well the 50% fib level.
3. target to be at previous structure low.
Good luck!
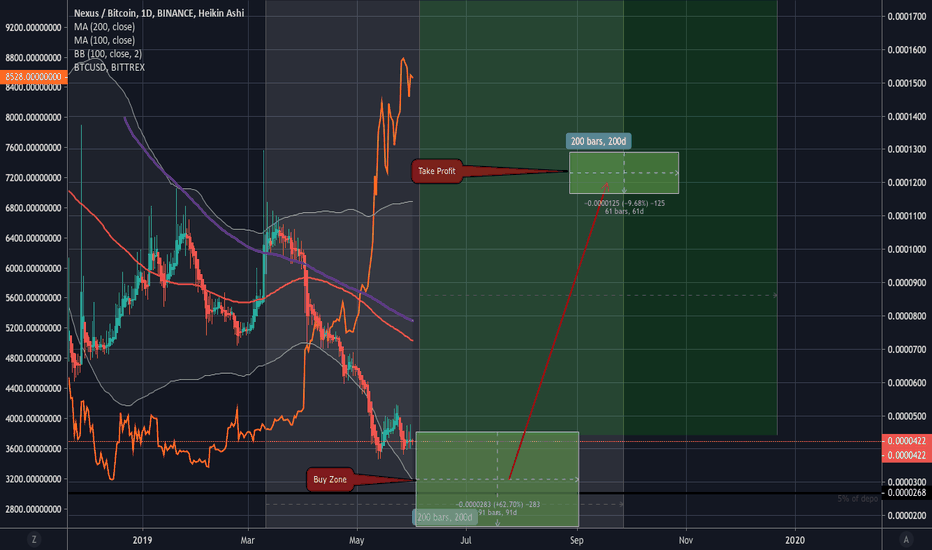
Nexus Price Performance / UpdatedBINANCE:NXSBTC
Nexus all time high in BTC was 0.00089980.
Right now, Nexus is priced at 0.00004202, 95.33% lower then its all time high.
correlation check
-1,85264 - Sharpe ratio
-0.36265 - Sortino ratio
Strong BUY signal
#theminimalist


