Sine Wave

Bitcoin Sine WaveA sine wave is a geometric waveform that oscillates periodically, and is defined by the function y = sin x.
The sine wave indicator is based on the assumption that markets move in cyclical patterns. After quantifying a cycle, a trader may try to use the pattern to develop a leading indicator. This works extremely well when the market is indeed moving in a cycle.
The sine wave as a technical chart analysis tool is based on advanced mathematics and is designed to indicate whether a market is trending or in a cycle mode. It helps traders identify the start and finish of a trending move as well as possible shifts in the trend.


BTC movement targets for next week Sept 22-28Hiting $52k there is enough sell presure to impulse a correction back to $47k-46k to give enough fresh air to continue the uptrend in search of the next target arround $60k-62k

BAL USDT 1D, breaking supportall alts looking good there with btc, expecting a drop after btc touches 51-53k ;)
Team SYCAP

Will DOGE hit near $1? Not a financial advice.
Just a simple day analysis. If DOGE continue to follow current trend and stays in channel we should see it near $1.
I am holding.


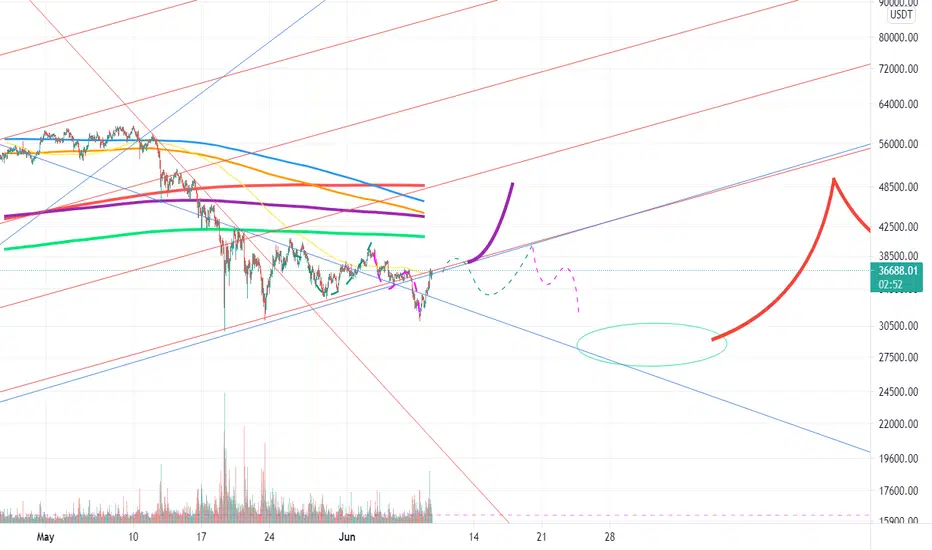
Next few days are crucialIf, by the beginning of the next week, the price could not break the sloping resistance line, the death cross is going to happen. And if death cross actually occurs, we will definitely lose the MA 300 support and the price probably will enter the 25K to 28K channel.

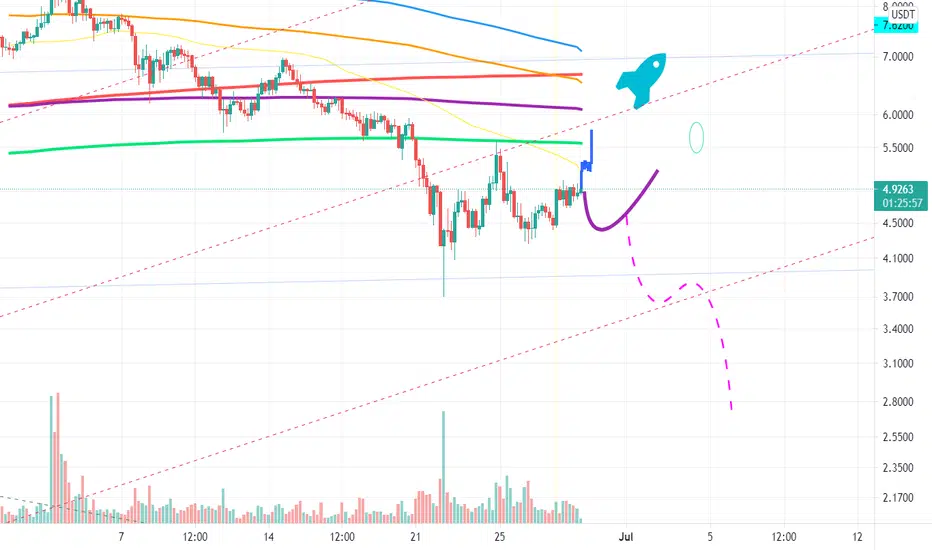
MATIC/USD Cycle AnalysisSince late 2020, the MATIC price action has been consistent on the 30 day MA (Cyan band). From Dec 2020 to May 2021, the price has tested the support 6 times on the gray sine wave, and has tried the resistance 3 times, on the gray dashed sine wave; and stayed in this range for this period. From early March to late April, the price has consolidated in a 75% range from $0.35 to $0.55.
After the break-out from this range, on April 27, the action has continued between the second waves (white), except for a quick FOMO and correction incident on May 18 and 19th.
IF the bull run continues during the summer, we can expect a local top at $4.20 in late June, and consequently, a consolidation period between $2.40 and $4.20 till the end of summer. And for this cycle, the ultimate top target could be $15.

Bitcoin's Extremes (Through the End of this Month)Multiple angles across timeframes currently converging, so the price of bitcoin is safe for now right here in the middle. Heavy bets being place in both directions. Volatility is expected through the end of the month (when isn't it?); +/- 33% or $24k - $48k range.
History certainley rhymesI am a firm believer in the power of Sine Wave, and this chart shows why.
First, some explanations:
1- The green wave, starts at the bottom of 2011 price and ends in the top of the first peak;
2- The dashed yellow wave, starts at the mid-range of sloping phase (which is the FIRST peak), reaches the bottom at the first bear market nadir, and ends in the peak of the second bull market;
3- The dashed blue wave, starts at the mid-range of sloping phase (which is the SECOND peak), passes through the second bear market nadir, and potentially will ends in the peak of the third bull market;
4- The purple band, is the the 52 week MA.
----------------------------------------------------------
Now, some observations:
1- Every time the 52W MA crosses a wave on its way up, it is a signal for beginning of a bull market. This cross happens at the 2/5 of the way from the bottom of the wave to the top;
2- Every time the 52W MA crosses the same wave on its way down, it is a signal for the mid-point of a bear market. This cross happens at the 2/5 of the way from the top of the wave to the bottom;
3- The dip before the peak, occurs on the sine wave's 4/5 of the way to the peak. This price difference from the wave to the dip is approximately -90%;
4- Right now we are 78% down from the wave, and -87% would take us to $20,000.
5- That being said, we have never been this close to the 52W MA in a bull cycle and if the price dips to 20K in the coming weeks, we would cross the 52W MA and unless that point doesn't act as a spring, we probably will not reach the top by the end of the year.

Time Cycled ADA to gain 24% by Mid JuneViewing the chart above we can clearly see a 55 day time-cycle has formed (red semi circles at top).
The cycle starts from 3rd Jan 2021 and is repeated every 55 days on the following dates: 27th February, 23rd April and predicted 17th June.
The frequency of the cycle is also clearly seen in the LT 144 RSI - (Vertical white dotted lines mark Cycle, Price and RSI)
Price is rarely dipping below LT 144 rising DEMA which is a good signal of growth, however the further the price parts from the DEMA the greater the correction signal becomes for the price to return to the DEMA.
The yellow lines show ADA's trend entry and together with the blue horizontal lines confirm the base entry support, trend formation, support and resistance within the trend and finally the trend breakout on 6th May confirmed on 13th May.
And if you include the RSI green prediction doesn't that look like a perfect cup and handle forming on the RSI!? :)
All the above signals a 24% gain by Mid June @ a price of 2.75.
Good Luck to All

S&P500 Dominant Cycle Topping NowCyclic Tuned RSI based on the current cycle length of ~170days in the S&P500 index show current topping process forming again

AAVE DECISIVE MOMENT!!!If the price fail to break and maintain the following top, the sine movement appears to arrange again...

Citi Union bankCitiunionbank looks good if it holds 150 level targets could be 200,230 ,forming sine curve pattern and price is moving in parallelchannel pattern

Hidden Periodicity and Pitchfork Suggests Short-Term SupportCAD is otally coupled with the price of oil, which is the major factor in this currency couple in recent times. The fact that EUR gained a lot during the first COVID-19 lockdown was mainly due to the price of oil going downwards. This was evident as well during the recent Suez canal blockage, which started a new bullish run for oil and a pull back for EURCAD. Yet, there is a hidden pattern at play here, one which can be shown using the sinusoidal of wavelength 5 months. The prices have been going up and down consistently through this pattern since a couple of years, mainly due to market dynamics, often augmented with political events.
Following this pattern, you can see that we are approaching a crest in the sine wave, yet we are a law low point in the dominant bearish trend. Also, oil prices are increasing since the Suez crisis, which suggests that the pattern might not be followed. Yet, careful pitchfork analysis shows that we are currently at the line of support, which is also confirmed by the lower Bollinger band, as well as the almost over-selling RSI.
The bearish trend doesn't seem to be waning anytime soon, since most of the action is take place in the lower side of the pitchfork. However, for the short-term, the price is going higher and now sounds like a good short-term buy.

Unity's Squeeze-Price Inflection oscillation tied to EarningsPremise:
Convergence probably occurred before initial jump to ATH (not drawn)
2nd convergence noticeably begins around the time Momentum Squeeze kicks in for the buildup to Q4 earnings report.
Momentum at breakout was BEARISH, despite P/L changing in the positive direction (earnings much closer to estimate than in Q3)
If this performance holds up, Unity's stock should be competitive against established entities (see background: 700 and ATVI) in the gaming market which looks poised to resume an upward trend.
One Possible Scenario:
The last 2 weeks in March are showing the beginning of a 3rd convergence; will keep updating to see if this pattern holds up.
A new Squeeze indicator along with past experience suggests it will, crucially timed to the earnings release on May 6th.
The sine wave shown here in purple is not meant as a trendline projecting the stock's price level at some point in the future but is simply an extrapolation of past inflection points to identify at what point along the new growth curve the stock will be if and when Momentum breaks decisively in the positive direction.
My conclusion is that Unity will probably continue trading in its current range for some time, possibly even taking another downward turn this month as public sentiment on the stock has been increasingly bearish as its clear it isn't poised to rocket back to 150.
That would be the time to buy and hold, if the enthusiasm for Unity among developers is to be taken seriously, or at the very least, place your May-21 calls.


DXS sine pattern in a rangeDXS has been ranging since march drop off. Formed a near perfect sine pattern. Looking for a slight flattening off/pullback over next week for a good entry before targeting $10. Alternatively enter now with tight stop at 9.36. For educational purposes only. Do you own research

