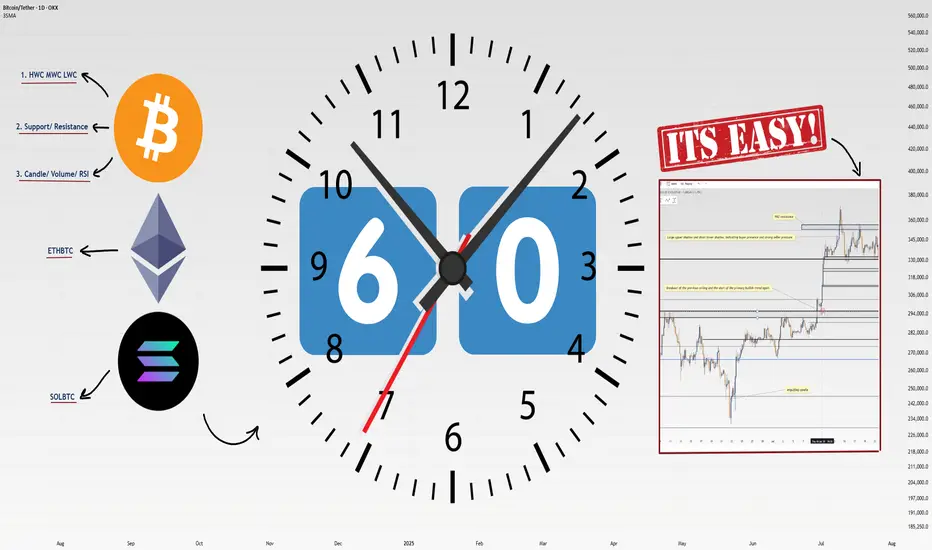
How I Analyze Any Coin in 60 Seconds: 4-Step Masterclass!Heyy traders, it’s Skeptic from Skeptic Lab! 🩵 I’m breaking down my lightning-fast method to analyze any coin in just 60 seconds . This 4-step process is how I spot long/short triggers like a pro. Buckle up, let’s dive in:
✔️ Step 1: Identify HWC/MWC/LWC (10 seconds)
Nature’s got a cool vibe—bet a lot of you hit the outdoors on weekends. When I see an apple tree from afar, it’s majestic, but up close, I spot branches and worm-eaten fruit. From a distance, I miss the details; up close, I lose the tree’s grandeur. Markets work the same. You need different timeframes to grasp the market structure. With practice in Dow Theory, trends, and tools, spotting HWC (Higher Wave Cycle), MWC (Mid Wave Cycle), and LWC (Lower Wave Cycle) becomes second nature. For me, this takes 10 seconds.
Want a full HWC/MWC/LWC guide? Check my free article I wrote a while back—it’s a hands-on tutorial ( link Cycle Mastery ).
📊 Step 2: Draw Support/Resistance Lines (20–30 seconds)
I start with higher timeframes: Monthly, then Weekly, then Daily. Once I’ve drawn lines up to Daily, I don’t always redraw for lower timeframes—often, I just adjust them.
Pro tip : Give more weight to the right side of the (recent data) since it’s fresher and more valuable. I change line colors for 4-hour lines, so I know they’re less critical than Daily. I don’t draw lines below 4-hour, but if you’re a scalper, tweak this to your strategy. This step takes me 20–30 seconds, the longest part.
📉 Step 3: Analyze Candles, Volume, Oscillators, and Indicators (10–15 seconds)
Here, I check everything I can: candles, volume, oscillators, and indicators . The goal? Stack confirmations for my triggers. Think RSI hitting overbought, volume spikes, larger candle sizes, or momentum surges—you get the vibe. This step’s length depends on your tool mastery. For me, it’s quick because I know what to look for.
🔔 Step 4: Check Coin Dominance (5–10 seconds)
This is the most critical yet simplest step. We need to track where liquidity’s flowing . For example, if SOL/BTC is bearish, I skip buying Solana—liquidity’s exiting. BTC.D (Bitcoin Dominance) is also key. The relationships dominance creates are complex and don’t fit in one analysis, but if you want a full dominance tutorial, drop it in the comments!
🔼 Key Takeaway: Using these 4 steps—HWC/MWC/LWC, support/resistance, candles/indicators, and dominance—I analyze any coin in 60 seconds. Your speed depends on experience and knowledge. If you’re new, this might take 60 minutes per coin, but don’t sweat it— practice makes you lightning-fast . Thanks for vibing with this educational idea! <3 I’ll catch you in the next one—good luck, fam!
💬 Let’s Talk!
Want a dominance tutorial or more tips? Hit the comments, and let’s crush it together! 😊 If this guide lit your fire, smash that boost—it fuels my mission! ✌️
Skeptic
AUD/CAD’s Big Move: Don’t Sleep on This Breakout Setup!Hey traders, Skeptic from Skeptic Lab here! 🔥 While everyone’s freaking out over interest rate news and Non-Farm Employments , AUD/CAD ’s stealing the show on the daily time frame.
📉Post-tariff crash, it’s rebounding strong. A daily resistance break could kick off a major uptrend. Use RSI overbought/oversold ( linked in my TradingView article ) to confirm momentum.
👀Beware of fakeouts this week—volatility’s high! Trade smart, keep risk tight, and don’t FOMO. Share your thoughts in the comments, boost if it helps <3 🩵

5 Lessons from My First 100 TradesAfter executing and reviewing over 100 real trades in crypto, forex, and gold — I found patterns. Bad patterns. Repeating mistakes. And lessons I wish someone had told me earlier.
So I broke them down into 5 key insights that changed how I trade — and might just save you thousands.
📘 Here’s what’s inside:
1️⃣ Smart Profit-Taking:
How I turned 10 R/R into 32 R/R using a dynamic exit plan.
📘Further resource:
Cycle Mastery (HWC/MWC/LWC)
---
Multi-Timeframe Mastery
2️⃣ The Sleep Edge:
70% of my losing trades happened after bad sleep. Here’s why that matters more than emotions.
3️⃣ No More Blind Stop Orders:
Why I stopped using buy/sell stops without real candle confirmation — and what I do instead.
📘 Further reading:
Breakout Trading Mastery
---
Indecision Candle Strategy
4️⃣ Multi-Layered Setups Win:
How structure, S/R, patterns, and timing stack into high-probability entries.
5️⃣ News Trading? Just Don’t.
The data behind why most of my SLs were hit near news time — and how I avoid the trap.
💡 These aren’t theories. These are real lessons from real trades.
If this video helped you or sparked an “aha” moment, give it a boost, commenting your takeaway, and sharing it with a fellow trader.
lets grow together :)

Bitcoin’s Epic Run from 80K to 120K: What’s Next for BTC?Yo traders, it’s Skeptic from Skeptic Lab! 🩵 Diving into Bitcoin’s wild ride from 80K to 120K—breaking down the key supports, resistances, and what’s next for BTC.
From the $76k bounce to smashing $110K, we’re eyeing the $120K PRZ. Will it correct or keep soaring? Check the video for the full scoop! Drop your thoughts or coin requests in the comments, boost if it vibes & Let’s grow together!

USD/CHF Update: Missed the Last Short? Grab the New Trigger!Yo traders and market lovers, it’s Skeptic from Skeptic Lab! Here’s a quick USD/CHF update: my last short trigger after the support break gave us a 50-pip drop . With a solid stop loss, you’re likely sitting on a 2:1 R/R; risk-takers might even be at 5:1. I’m breaking down a fresh trigger in this video—don’t miss it! Drop your thoughts or coin requests in the comments, give it a boost if it helped , and don’t miss my educational post coming tonight on Skeptic Lab’s TradingView page with lessons from my first 100 trades—it’s gonna be fire. Catch you tonight! 😎

EUR/CHF Update: I just found out the next big triggerHey friends 🩵, hope you’re kicking off the week with a great vibe! It’s Skeptic from Skeptic Lab . In this video, I’m diving into EUR/CHF .
We’re stuck in a range box right now, and knowing this setup will help you miss fewer opportunities. Don’t forget money management, dodge FOMO, and have a plan for different scenarios. I also explained in the video why I personally prefer opening a short position. So, let’s get started!

Miss This Watchlist, Miss Next Week’s OpportunitiesHey friends,it’s Skeptic 🩵 hope you’re having a great weekend!I know it’s the weekend, so a lot of you are probably chilling away from the charts, but for some, trading’s such an addiction that even weekends can’t keep you away. In this video, I’m gonna break down my weekly watchlist for you. Knowing it will help you miss fewer good opportunities, avoid FOMO, and have a plan ready for different scenarios and events.
Don’t forget money management , and stay clear of FOMO. & if it helped smash that boost bottom and follow for more !

Ripple Update: Is XRP Ready for Another 500% Growth?Hey friends, it’s Skeptic 🩵 . In this video, I’m giving an update on Ripple’s conditions , reviewing past triggers, and what to do with your long positions in futures if you’re still holding. For spot, what’s the move? I dove into XRP/BTC analysis and, at the end, broke down BTC.D , which just had a major event you need to pay close attention to. Don’t forget money management, and stay clear of FOMO. Drop your thoughts on XRP in the comments so we can chat about it!

Skeptic | XRP Analysis: Can It Hit $6 After Bitcoin’s $111k?Hey everyone, Skeptic here! Bitcoin just smashed through the $107K resistance, shaking up the whole crypto scene! Is XRP ready to rocket to $6 ? Curious about spot and futures triggers? Stick with me to the end of this analysis for the full breakdown. 😊 Let’s dive in with the Daily Timeframe. 📊
Daily Timeframe: The Big Picture
After an epic 500% rally , XRP has entered a consolidation phase, which we can spot from the decreasing volume. It’s too early to call this a distribution or re-accumulation, but I’m leaning toward re-accumulation for a few reasons:
Bitcoin’s Uptrend: The ongoing bullish trend in Bitcoin is fueling crypto market liquidity.
Positive XRP News:
Ripple and the U.S. SEC reached a settlement in early May 2025, ending a long legal battle over XRP’s status as a security. Ripple paid a $50 million fine, with $75 million of a $125 million escrow returned. This cleared major regulatory uncertainty, boosting investor confidence and paving the way for broader U.S. adoption.
XRP Spot ETF Speculation: BlackRock reportedly discussed an XRP ETF application with the SEC, and firms like Franklin Templeton and Bitwise have filed for XRP ETFs. With the SEC’s new crypto-friendly leadership, the odds of ETF approval are 80-85% by the end of 2025, potentially unlocking massive institutional capital.
Spot Trigger:
The main trigger is a break and consolidation above 3.3684 , which aligns with breaking the daily consolidation box.
This could kick off a new momentum wave. Expect a sharp breakout, so don’t miss it!
If you’re aiming for a long-term buy, I’ll share lower timeframe triggers to front-run this breakout.
First Target :
After breaking the box’s ceiling, aim for 6.64 . I cloned the box and placed it above, as this often works for target setting. 🙂
Tip: Pay close attention to Bitcoin and USDT.D for better target spotting.
4-Hour Timeframe: Long & Short Setups
On the 4-hour chart, price action is getting tighter and tighter, which is awesome. Why? The longer we range, the more liquidity builds up, setting us up for a sharp move with smaller stop losses compared to trending markets. Here’s the breakdown:
Market Context:
The 4-hour timeframe shows stronger bearish momentum, but remember: the major trend is uptrend, and the secondary trend is consolidation.
For shorts, keep position risk low since we’re in a bullish major trend.
For longs, hold positions longer and, if possible, lock in profits early without closing the entire position.
Long Setup:
Trigger : Open a long after a break above 2.4742 .
Key Notes:
Ensure the break comes with rising volume to avoid a fake breakout.
Reduce profit-taking on this position. Why? Higher levels have more liquidity, leading to sharp moves, making it harder to open new positions.
Short Setup:
Trigger: Open a short after a break below support at 2.2926 .
Advice: Take profits quickly and close the position when you hit your targets.
The current candle looks like it failed to break out and formed a shadow, which could increase the odds of a return to the ceiling and a resistance break.
Front-Running Spot Trigger:
To front-run the daily box breakout, open a position after breaking 2.9789 on the 4-hour timeframe.
XRP/BTC Analysis
XRP/BTC had a solid rally but is now in a price correction, and it’s a weak correction at that. Here’s what to watch:
Key Level : A break above resistance at 0.00002548 could bring back uptrend momentum to XRP/BTC.
Implication: If this breaks, buying XRP becomes more logical than Bitcoin, as XRP could outperform.
Until Then: Stick with longs on BTC, as liquidity is flowing more into Bitcoin, giving it stronger growth potential.
Pro Tip: Checking the BTC pair is a game-changer—trust me! 😎
💬 Let’s Talk!
If this analysis sparked some ideas, give it a quick boost—it really helps! 😊 Got a pair or setup you want me to dive into next? Drop it in the comments, and I’ll tackle it. Thanks for joining me—see you in the next one. Let's grow together! 🤍

5 Proven Tricks to Trade Without FOMO After Missing Your TriggerYo traders! In this video, I’m breaking down what to do if you miss a trading trigger , so you can stay calm , avoid FOMO , and still catch the next move. We’re diving into five solid strategies to re-enter the market without losing your cool:
Buy on the pullback zone.
Buy with an engulfing candle after a pullback.
Buy after breaking the resistance formed by the pullback.
Buy after the second wave with an indecision candle.
Buy after breaking a major resistance post-second wave, confirmed by RSI or momentum oscillators.
These tips are all about keeping your trades smart and your head in the game. For more on indecision candles, check out this lesson . Wanna master breakout trading? Here’s the breakout trading guide . Drop your thoughts in the comments, boost if you vibe with it, and let’s grow together! 😎

Has the DXY got you confused? Well, check out this analysis.Welcome back, traders, it’s Skeptic from Skeptic Lab! 😎 , the DXY has entered a corrective phase over the past weeks. In this analysis, I’ve broken down the technicals and chart with a skeptical eye, outlined long and short triggers on the 4h timeframe , and tried to give you a solid multi-timeframe view of the setup. At the end, I’ve shared a key educational tip that can seriously boost your win rate and R/R , so make sure you check out the full analysis.
💬If you’ve got a specific symbol in mind for analysis, drop it in the comments. Have a profitable Friday, fam <3

Solana Update: Miss This Analysis, Miss the Next Leg!Hey, I’m Skeptic! 🩵 Solana’s recently kicked off a strong uptrend momentum , and there are solid triggers waiting to activate that could bring good profits. In this analysis, I dove into Solana on weekly, daily, and 4-hour timeframes, and checked SOLBTC and BTC.D too, to get a grip on the current liquidity flow.
💬What’s your trigger on Solana? Drop it in the comments, and if you want an analysis on a coin, write it for me so I can check it out.

Bitcoin Ranges While Altcoins Rise — Follow the Liquidity TrailHeyy traders, it’s Skeptic from Skeptic Lab! 💙 Dropping a red-hot update on Bitcoin and the crypto market to catch the next big wave. We’re diving into the Daily timeframe and market dynamics to track where the money’s flowing. here’s the play:
✔️ Daily Timeframe
As we flagged in my last Bitcoin chart, the $ 120,000 level is a liquidity magnet with heavy action. The July 14 candle tried breaking it but failed, leaving a downward shadow showing strong seller presence at this level. Plus, last week we hit the 4-week pivot point on the Weekly , and as expected, we’re now ranging around $120,000. Does this mean we ditch crypto? Big NO.
📊 Bitcoin Dominance (BTC.D)
Let’s zoom in on BTC.D —it’s gone sharply bearish, with yesterday’s candle screaming capital exiting Bitcoin. Traders who profited up to $120,000 are locking in gains and moving funds elsewhere. So, what’s the story?
Bitcoin broke its ceiling after 168 days, surging 10% to $122,000. Buyers took profits, pulling liquidity out.
Where’s the money going? Let’s test two theories:
USDT? Nope. USDT.D is also bearish.
Altcoins? Bingo! TOTAL2 (altcoin market cap) smashed its Daily resistance at 1.34 after months, signaling liquidity flooding into altcoins.
📉 Which Altcoins? Here’s the trick: check pair/BTC ratios . For example, to pick between Solana or Ethereum, compare S OL/BTC and ETH/BTC . The one with a stronger uptrend is soaking up more liquidity from Bitcoin.
🔔 Key Insight: This liquidity flow game is a game-changer for crypto traders. Want a full dominance tutorial? Let me know —it’ll show you how to track where the money moves and which coins get the most action.
🔼 Key Takeaway: Bitcoin’s ranging at $120,000, but altcoins are heating up as BTC.D drops. Hunt for altcoins with bullish pair/BTC charts to ride the liquidity wave. Risk management is your lifeline—cap risk at max 1%–2%. I’ll catch you in the next analysis—good luck, fam! <3
💬 Let’s Talk!
Which altcoin are you eyeing? Hit the comments, and let’s crush it together! 😊 If this update lit your fire, smash that boost—it fuels my mission! ✌️

Skeptic | XAG/USD Analysis: Precision Triggers for Spot & FutureHey everyone, it’s Skeptic! 😎 Ready to ride XAG/USD’s next wave? Let’s dive into XAG/USD (Silver) to uncover long and short triggers that can deliver solid profits. Currently trading around $ 36.31 , we’re analyzing Daily and 4-hour timeframes to pinpoint high-probability setups. Here’s the no-nonsense breakdown to keep you sharp. 📊
📈 Daily Timeframe
On the Daily timeframe, we saw a strong primary uptrend sparked by a V-pattern breakout at $ 33.68317 , which drove a 10% rally, as flagged in my previous analyses—hope you caught it! We’re now in a consolidation box, potentially acting as accumulation or distribution. Today’s candle faced a strong rejection from the box ceiling. If it closes this way in 9 hours, the odds of breaking the box floor increase significantly.
Key Supports: If the floor breaks, watch $ 34.78648 and $ 34.41291 as strong reaction zones for potential bounces.
4-Hour Timeframe (Futures Triggers)
On the 4-hour timeframe, let’s lock in long and short triggers:
Long Trigger: Break above resistance at $ 37.29163 , confirmed by RSI entering overbought. Check my RSI guide for how I optimize setups with RSI.
Short Trigger: Break below support at $ 35.59660 , with volume confirmation. Additional confirmation: RSI entering oversold.
Confirmation Timing: Choose your confirmation timeframe based on your style—4-hour, 1-hour, or even 15-minute. I typically confirm triggers on 15-minute closes for precision, but if 1-hour momentum kicks in, I use 1-hour candle closes. Focus on candle body closes, not just shadows, to avoid fakeouts.
Pro Tip: Stick to 1%–2% risk per trade for capital protection.
Final Vibe Check
This XAG/USD breakdown arms you with precise triggers: long at $37.29163, short at $35.59660, with volume and RSI as your allies. The Daily consolidation signals a big move is brewing—stay patient for the ceiling or floor break. Want more cycle-based setups or another pair? Drop it in the comments! If this analysis sharpened your edge, hit that boost—it fuels my mission! 😊 Stay disciplined, fam! ✌️
💬 Let’s Talk!
Which Silver trigger are you eyeing? Share your thoughts in the comments, and let’s crush it together!

SPX500 Update: Monster Trigger Ready to Launch!Welcome back, traders, it’s Skeptic from Skeptic Lab! 😎 With news of the unemployment rate rising, stock and crypto markets have been surging hard, and right now, we’ve got a killer trigger on SPX500 you don’t want to miss. Its breakout could spark the next major bullish leg. Let’s dive into the Daily and 4-hour timeframes to unpack this setup. here’s the play:
✔️ Daily Timeframe:
After a strong rally, SPX500 hit an all-time high (ATH) at 5,249.14 before entering a deep correction. Here’s what many traders miss: support/resistance levels aren’t static—they shift over time. The resistance that was at 6,146.89 has now climbed to 6,290. Breaking 6,290 signals the start of a major bullish trend after 146 days of correction. This is our primary long trigger.
📊 4-Hour Timeframe (Futures Triggers):
Long Trigger: After a solid uptrend with strong momentum, we entered a time-based correction within a box pattern. Breaking the box ceiling at 6,290 is the long trigger, aligning with the Daily breakout.
Short Trigger: Breaking the box floor would trigger a short, but this goes against the trend, so stop-loss risk is higher, and your win rate could take a hit—stay cautious.
📉 Key Insight: The 6,290 breakout is the big move to watch, fueled by market momentum from the unemployment news. Shorts are riskier due to the bullish trend, so prioritize longs with volume confirmation.
🔔 Confirmation: For longs, confirm the 6,290 break with RSI entering overbought.Risk management is critical—cap risk at 1%–2% per trade to survive the market’s swings.
🔼 I’ll update if the structure shifts! Thanks for vibing with this analysis! <3
💬 Let’s Talk!
Which SPX500 trigger are you locked on? Hit the comments, and let’s crush it together! 😊 If this update lit your fire, smash that boost—it fuels my mission! ✌️

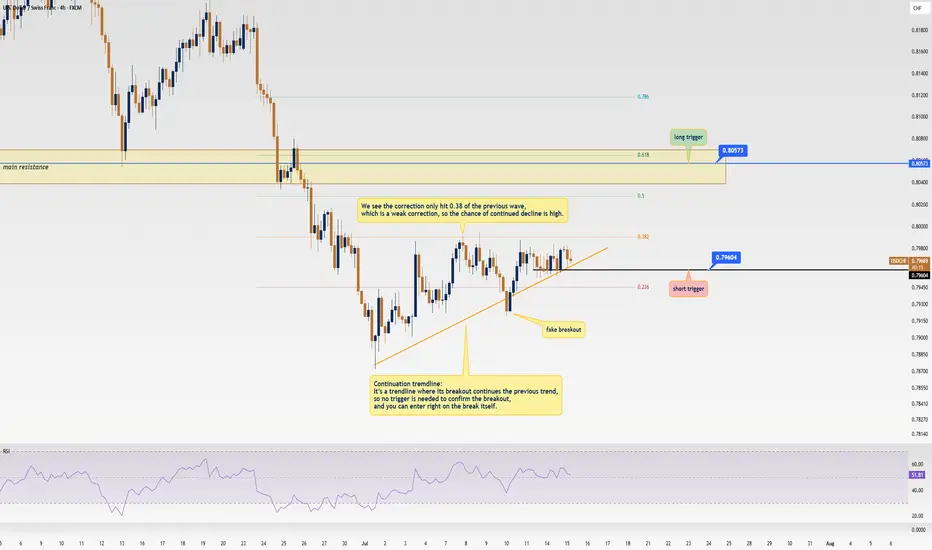
USD/CHF Update: Killer Short Trigger Ready to Pop!Welcome back, traders, it’s Skeptic from Skeptic Lab! 😎 We’ve got a juicy short trigger on USD/CHF that could deliver serious profits if it fires. Stay with me till the end to nail this trade! Let’s dive into the Daily and 4-hour timeframes for the full picture. Currently at $0.79671, here’s the play:
✔️ Daily Timeframe:
We’re in a rock-solid bearish major trend . After hitting a high of $ 0.84649 , we broke the key support at $ 0.80573 , resuming the bearish trend. A pullback to the broken $ 0.80573 level is likely, as it aligns with the 0.6 Fibonacci retracement from the prior 4-hour wave. Trading with the trend is smartest, so shorts are the focus. If you want to long, go with lower risk and close positions faster.
📊 4-Hour Timeframe (Futures Triggers):
Short Trigger: Two options here. Either enter on a trendline break (no extra trigger needed, as continuation trendlines mean the prior trend resumes on a break), or, for a safer play, short on a break of support at $ 0.79604 —this needs minimal confirmation.
Long Trigger: Wait for a break of the resistance zone at $ 0.80573 . Confirm with RSI entering overbought. Check my RSI guide ( link ) for how I use it differently—game-changing stuff!
📉 Key Insight: Stick to the bearish trend for higher-probability trades. Shorts at $0.79604 or on a trendline break are your best bet.
🔔Risk management is your lifeline—cap risk at max 1%–2% per trade to stay in the game.
I’ll catch you in the next analysis—good luck, fam! <3
💬 Let’s Talk!
Which USD/CHF trigger are you locked on? Hit the comments, and let’s crush it together! 😊 If this update lit your fire, smash that boost—it fuels my mission! ✌️
Skeptic | GBP/USD Update: Triggers Fired Up!Hey everyone, it’s Skeptic! ;) yesterday, the support at 1.35672 saw a fake breakout and snapped back into the 4-hour box we’ve been tracking. But bearish momentum is still strong, so here’s the play:
✔️ If you opened a short already , With the fake breakout signaling potential momentum shift, consider taking profits or closing if price consolidates above 1.36089. Why? The fakeout increases the chance of a momentum change.
✨ For new short positions , the 1.35672 break remains a valid trigger. If it breaks again, it could kickstart a major bearish leg, targeting lower supports at 1.35000 and 1.34227 —both strong reaction zones.
📊 The HWC is uptrend, so shorts need extra caution—reduce risk or take profits early.
📉 For longs , wait for a break and consolidation above 1.36406 . This level saw a strong rejection, signaling it’s a key resistance the market respects. A break here, liquidating short positions (which means buying), could spark a solid uptrend leg with great R/R potential.
🔔 Confirmation : Use RSI entering oversold for shorts or overbought for longs. The HWC uptrend means shorts carry higher risk, so tighten your risk management—stick to 1%–2% risk per trade.
🔼 Key Takeaway: Short at 1.35672 if it breaks again, long at 1.36406 with confirmation. Stay sharp for momentum shifts and keep stops tight. I’ll update if the market structure flips!
💬 Let’s Talk!
Which GBP/USD trigger are you locked on? Hit the comments, and let’s crush it together! 😊 If this update lit your fire, smash that boost—it fuels my mission! :)))

XAU/USD Update: Ready for a 12% Surge?Welcome back, traders, it’s Skeptic! 😎 Is XAU/USD about to explode or crash?
We’ve formed a symmetrical triangle pattern , and its breakout triggers could deliver solid profits for longs or shorts. Let’s dive into the details with the Daily timeframe to see the big picture.
✔️ Daily Timeframe: Our HWC is strongly bullish. After hitting $ 3,497.80 , we entered a secondary retracement phase, forming a symmetrical triangle. If we break resistance at $ 3,444.18 , my targets are the next ceiling at $ 3,494.50 and, long-term, $ 3,796.64 . But if we break support at $ 3,796.64 , it could signal a major trend change from uptrend to downtrend, opening shorts. Next supports are $ 3,206.32 and $ 3,019.31 —use these as your targets.
📊 Key Insight : Risk management is key to surviving financial markets. Stick to max 1%–2% risk per trade to stay safe.
📉 Market Context: Markets are predicting a major recession in the U.S. economy. If it happens, Gold will be the only safe-haven asset. So, I personally favor riding Gold’s uptrend.
This historic drop screams one thing: global markets are losing faith in U.S. monetary and fiscal policies, big time.
And that’s a loud wake-up call for investors: It’s time to bulletproof your portfolio. What’s that mean?
Your stocks, real estate, cash, bonds , you name it...
They’re slowly but surely turning to Gold .
💬 Let’s Talk!
Which Gold trigger are you eyeing? Hit the comments, and let’s crush it together! 😊 If this update lit your fire, smash that boost—it fuels my mission! ✌️

Skeptic | Why did Bitcoin grow? What’s the next move?Unemployment rate’s up...
lemme explain short and sweet. When unemployment —a key factor for setting interest rates —rises, the Federal Reserve’s got no choice but to lower rates so companies can hire. Lower rates = more liquidity = Bitcoin and stocks go up.
What’s the next move?
Around $ 120,000 , there’s about 1 billion in short liquidity positions. also it overlaps with the weekly pivot point level 4 . I see a high chance of correction or ranging here. Personally, I opened a position before the $ 110,513 breakout ( i shared in this analysis ) and only took profits. If you’re still holding, I suggest not closing yet—once the $ 110,000 resistance broke, Bitcoin’s major weekly trend woke up, so we could see more growth.
If this analysis helped you, hit that boost—it fuels my mission! 😊 Stay disciplined, fam! ✌️

Skeptic | Bitcoin Deep Dive: Rate Hikes, War Tensions & TriggersInterest Rates: The Big Picture
Let’s start with the Federal Reserve’s move—interest rates jumped from 4.25% to 4.5% . What’s the deal? Higher rates mean costlier borrowing , so businesses and folks pull back on loans. This drains liquidity from risk assets like Bitcoin and SPX 500, slowing their uptrend momentum or pushing them into ranges or dips. Now, mix in the Israel-Iran conflict escalating ? Straight talk: risks are sky-high , so don’t bank on wild rallies anytime soon. My take? BTC’s likely to range between 97,000 and 111,000 for a few months until geopolitical risks cool (like Russia-Ukraine became “normal” for markets) and the Fed starts cutting rates. Those two could ignite new highs and a robust uptrend. Let’s hit the charts for the technicals! 📊
Technical Analysis
Daily Timeframe: Setting the Stage
You might ask, “If 100,000 support breaks, does that mean we’ve formed a lower high and lower low, flipping the trend bearish per Dow Theory?” Absolutely not! Here’s why: our primary uptrend lives on the weekly timeframe, not daily. The daily is just a secondary trend. If 100K cracks, it only turns the secondary trend bearish, leading to a deeper correction, but the major weekly uptrend stays intact.
Spot Strategy: No spot buys for now. Economic and geopolitical risks are too intense. I’ll jump in once things stabilize. 😎
Key Insight: A 100K break isn’t a death sentence for the bull run—it’s just a shakeout. Stay calm!
4-Hour Timeframe: Long & Short Triggers
Zooming into the 4-hour chart, here’s where we hunt for long and short triggers:
Long Trigger: Break above 110,513.92. We need a strong reaction at this level—price could hit it early or late, so stay patient for confirmation.
Short Trigger: Break below 101,421.65. Same vibe—watch for a clean reaction to tweak the trigger for optimal entry.
Pro Tip: These levels are based on past key zones, but time outweighs price. Wait for a reaction to nail the best entry. Patience is your edge! 🙌
Bitcoin Dominance (BTC.D): Altcoin Watch
As BTC dips, BTC.D (Bitcoin’s market share) is climbing, meaning altcoins are taking a bigger beating. Don’t touch altcoin buys until the BTC.D upward trendline breaks. They haven’t moved yet—you might miss the first 10-100%, but with confirmation, we’ll catch the 1,000-5,000% waves together. 😏
Shorting? If you’re shorting, altcoins are juicier than BTC—sharper, cleaner drops with more confidence. Patience, patience, patience—it’s the name of the game.
Final Thoughts
My quieter updates lately? Blame the geopolitical chaos, not me slacking . I’m hustling to keep you in the loop with clear, actionable insights. here, we live by No FOMO, no hype, just reason. Protect your capital—max 1% risk per trade, no exceptions. Want a risk management guide to level up? Drop a comment! If this analysis lit a spark, hit that boost—it keeps me going! 😊 Got a pair or setup you want next? Let me know in the comments. Stay sharp, fam! ✌️

Skeptic | BNB Surge: Rocket Triggers for Spot & FuturesHey everyone, it’s Skeptic! 😎 Is BNB ready to rocket? I’m diving into a pro-level breakdown of Binance Coin (BNB), a top 5 crypto with a $92.9B market cap, now trending on CoinMarketCap with surging momentum. This analysis unpacks recent upgrades, ecosystem strength, and technical triggers for spot and futures trading, grounded in cycle-based strategies. Trade with no FOMO, no hype, just reason.
Recent Performance & Key Events
Binance Coin ( BNB ), trading at $ 660 with a $92.9 billion market cap, ranks among the top 5 cryptocurrencies globally. The Maxwell hard fork in recent weeks slashed block times to 0.75 seconds, boosting network speed and efficiency, adding $8 billion to the Binance Chain’s market cap. BNB powers the Binance ecosystem, supporting staking, NFTs, and DeFi projects. Despite regulatory scrutiny, ongoing platform expansion and token burn mechanisms sustain BNB’s utility and investor interest. Let’s dive into the technical setup for actionable trades. 📊
Technical Analysis: Cycle-Based Breakdown
The Weekly timeframe is range-bound, so lower timeframes drive price action. Let’s break it down:
Daily Timeframe
On the Daily, we had a primary uptrend within an upward channel, which broke downward. I cloned the channel and placed it below, and price has reacted well to the midline, still holding there. A midline break could drive price to the channel floor at $536.47. However, a V-pattern stands out as one of the strongest patterns. Why? It shows sellers broke support and consolidated below, but buyers overwhelmed them, pushing price back above support instantly. This signals immense buying pressure, liquidating shorts despite heavy selling—big respect to buyers! lol
💬 For spot trading , wait for BTC.D to turn bearish, as rising BTC.D means liquidity flows to Bitcoin, making altcoin buys less attractive. BNB/BTC turning uptrend is another confirmation—currently, BNB/BTC is bearish, so focus on Bitcoin for now. Check pair/BTC ratios to spot coins outperforming Bitcoin.
Key Insight: Volume and BTC.D/BNB/BTC confirmation are critical for spot buys to avoid low-liquidity traps.
4-Hour Timeframe (Futures Triggers)
On the 4-hour, for longs:
Trigger: Break of resistance at $ 664.69 , confirming the V-pattern. Validate with a volume surge on breakout and RSI entering overbought.
Short Trigger: If support at $ 637.46 breaks again, go short, as buyers may lack strength after exhausting their effort in the prior defense. Volume confirmation is essential.
Pro Tip: ALWAYS use volume to confirm positions. Without a volume spike, fakeout risk is high. Stick to 1%–2% risk per trade to protect capital.
Final Vibe Check
This BNB breakdown delivers precise triggers: long at $664.69 (futures with V-pattern confirmation), short at $637.46 (futures). With a range-bound Weekly and Daily V-pattern, volume and BTC.D/BNB/BTC signals are your edge. BNB’s Maxwell fork and ecosystem strength fuel its potential, but regulatory risks demand tight stops. Want more cycle setups or another pair? Drop it in the comments! If this analysis sharpened your game, hit that boost—it fuels my mission! 😊 Stay disciplined, fam! ✌️
💬 Let’s Talk!
Which BNB trigger are you eyeing? Share your thoughts in the comments, and let’s crush it together!

Skeptic | Dogwifhat (WIF): Precision Triggers for Spot & FuturesWelcome, traders, Its Skeptic! 😎 Is Dogwifhat (WIF) the next meme coin rocket or a risky gamble? I’m diving into a pro-level breakdown of WIF, the Solana-based meme coin with a $882.06M market cap, ranked #75 globally. This analysis covers recent performance, ecosystem strengths, and technical triggers for spot and futures trading, grounded in cycle-based strategies. Trade with no FOMO, no hype, just reason. Let’s dissect WIF! 🚖
📰 Recent Performance & Key Events
Dogwifhat (WIF) , a Solana-based meme coin launched in late 2023, trades at 0.886 with a $882.06M market cap, ranking #75 globally. Featuring a Shiba Inu in a pink beanie, it leverages Solana’s high-speed, low-fee blockchain and a deflationary burn mechanism with a 998.9 million token supply. Listed on major exchanges like Binance, KuCoin, and Gate.io, WIF enjoys strong liquidity. In July 2025, it’s up 5.26% in 24 hours and 24.57% over 7 days, with a 24-hour trading volume of $450M. However, it’s down 80.94% from its all-time high of $4.84 (March 31, 2024), reflecting meme coin volatility :)
Technical & Market Position
WIF benefits from Solana’s scalable ecosystem, a hub for DeFi and NFTs, with 160,000+ TPS and low fees, outpacing slower networks. Its community-driven appeal, active on X, Reddit, and Discord, fuels its momentum, with posts highlighting a cult-like following. Compared to Pepe ($4.08B market cap, 456,000+ holders, 37% holding over a year), WIF’s smaller but vocal community shows dedication. However, its lack of real-world utility and reliance on social media hype mirror Pepe’s 25.7% year-to-date drop, raising concerns about sustainability.
Risks : Speculative volatility, pump-and-dump schemes, and dependence on Solana’s performance and social media sentiment make WIF a high-risk bet. Use stop loss to manage swings.
📈 Technical Analysis
Daily Timeframe
The Weekly (HWC) is bearish, entering a major bearish trend after forming a double bottom and breaking support. However, the Daily (MWC) started an uptrend, achieving 350 % growth before correcting to the 0.5 Fibonacci retracement —a healthy correction without breaking the uptrend momentum. Key support zones are $0.635–$0.679 . A break below could resume the Weekly bearish trend, so stay alert.
Spot Trigger (Long): Break above resistance at $ 1.047 , confirmed by a volume surge (ideally 2x the average of the prior 5–7 candles). Volume is critical—technical analysis is an art, not a science, so don’t fixate on exact numbers.
Key Insight: The Daily uptrend holds, but a volume spike is essential to confirm bullish moves and avoid fakeouts.
4-Hour Timeframe (Futures Triggers)
On the 4-hour chart (LWC), for longs:
Trigger: Break of the downward trendline and resistance at $ 0.958 , with volume confirmation (strong volume seen in the prior uptrend leg). Additional confirmation: RSI re-entering overbought.
Shorts: No short trigger currently. Despite the Weekly bearish HWC, the Daily MWC uptrend and strong support at $0.635–$0.679 make shorting illogical. Wait for a support break and MWC turning bearish for a safer short with better R/R.
Pro Tip: Longs are viable with volume and RSI confirmation. Avoid shorts until the MWC aligns bearish to minimize fakeout risk. Always use MAX 1%–2% risk per trade.
Final Vibe Check
This WIF breakdown delivers precise triggers for spot ($1.047) and futures ($0.958 long, no short yet), leveraging cycle-based strategies. With a bearish Weekly but bullish Daily, prioritize volume confirmation to navigate meme coin volatility. Solana’s ecosystem and exchange listings give WIF an edge, but its hype-driven nature demands caution. Want more cycle setups or another pair? Drop it in the comments! If this analysis sharpened your game, hit that boost—it fuels my mission! 😊 Stay disciplined, fam! ✌️
💬 Let’s Talk!
Which WIF trigger are you watching? Share your thoughts in the comments, and let’s crush it together!

Skeptic | SUI Breakdown: Precision Triggers for Spot & FuturesWelcome, traders, its Skeptic! 😎 Ready to unlock SUI’s next big move? I’m delivering a pro-level breakdown of SUI, the #12 crypto with a $10.4B market cap.This Analysis dives into recent performance, ecosystem growth, and technical triggers for spot and futures trading, all rooted in cycle-based strategies. Trade with no FOMO, no hype, just reason , Let’s conquer SUI! 🚖
Recent Performance & Key Events
SUI , trading at $ 2.98 with a $ 10.4 billion market cap, ranks as the # 12 cryptocurrency globally. A Layer-1 blockchain using the Move programming language, it boasts parallel transaction processing with over 160,000 TPS. In July 2025, SUI showed strong momentum, surging 10% in 24 hours and 12% weekly after bottoming in the $2.30–$2.40 range. However, a 44 million token unlock ($122M) on July 1 introduces potential selling pressure. 📊
Technical & Market Position
SUI’s Total Value Locked ( TVL ) reached $ 2.1 billion in early 2025, ranking it the 8th largest blockchain by TVL. Its DeFi ecosystem is exploding, with stablecoin volume jumping from $ 400M to $ 1.2B . Bitcoin integration and a Microsoft partnership bolster institutional adoption, signaling strong fundamentals despite volatility.
Technical Analysis
Daily Timeframe
The Daily (HWC) is in an uptrend, holding above the upward trendline (marked in blue). The major trend remains bullish unless this trendline breaks. However, the MWC is bearish, with declining volume during recent price rises suggesting a secondary corrective trend rather than a primary bullish trend. As Mark Andrew Lim notes in The Handbook of Technical Analysis, rising prices need increasing volume to confirm trader conviction and bullish momentum. Low volume indicates trend weakness, typical of corrective moves.
Spot Trigger (Long): Break of the downward corrective trendline with consolidation above resistance at $ 3.0408 . The last series breaking this trendline saw 85 % growth, but don’t rush in. Confirm with:
Falling BTC.D (Bitcoin dominance).
Total 3 long triggers (market-wide altcoin signals).
SUI/BTC uptrend, with an initial trigger on breaking its downward trendline and a primary trigger at 0.00003998 resistance.
Key Insight: Volume confirmation is critical. Without a volume surge on breakout, the risk of fakeouts is high.
4-Hour Timeframe (Futures Triggers)
On the 4-hour chart, if price reacts again at resistance $ 3.0890 , you can go long on a breakout, confirmed by RSI entering oversold. If it rejects sharply, the next long trigger is a break of $3.1606. For shorts, a break below support at $2.6593 is a strong trigger, especially with volume confirmation.
Pro Tip: Volume is king for all triggers. Without a volume spike on breakout, fakeout risk is high. Always apply capital management—1%–2% risk per trade to stay safe.
Final Vibe Check
This SUI Analysis equips you with precise triggers for spot ($3.0408) and futures ($3.0890/$3.1606 long, $2.6593 short) trading, leveraging cycle-based strategies. Want more cycle setups or another pair? Drop it in the comments! If this analysis sharpened your edge, hit that boost—it fuels my mission! 😊 Stay disciplined, fam! ✌️
💬 Let’s Talk!
Which SUI trigger are you eyeing? Share your thoughts in the comments, and let’s crush it together!
