Small Cap Index about to breakout!
Nifty has already given breakout.
Now is the time for smallcap index
Smallcaps

SPT - SPLITIT After todays announcement, I think Splitit is heading for 86c. I’ll be selling a portion of my position at that point.

ASX: AR9If this hits or drops below 0.095. I think it's heading for around 6c. hopefully Ill be able to top up.

$KAL: LONG IDEAtextbook trendline breakout on the 15 minute into the close today. Trendline from HOD down to the retracement levels. Next resistance 22-23c area, then 25, (FOMO kicks in) then psychological round # (30)

persistent - nifty small cap 100 breaking out
Nifty small cap 100 index breaking out - Persistent can well perform from the index
Persistent looks good for 4100/4500/4800+

RCF_ DailyRashtriya Chemicals & Fertilizers Ltd. is an Indian central public sector undertaking under the ownership of Ministry of Chemicals and Fertilizers, Government of India. It. produces chemical and fertilizers. It is based in Mumbai. RCF is fourth largest government owned-fertilizer-producer in India.
Only for Educational Purpose.

DCX INDIA!! best to buy! A MULTIBAGGER STOCK!!great sector, great business model with good fundametals.
listed with 40% premium in its IPO lisiting.
great to buy. since it has broken the trend of lower higher and lower lows.
volume is also pretty high.
a small cap company, which could prove a multibagger in future.

IMPORTANT BREAKOUT - Opportunities in SMALL CAPSThe price made a significant move, breaking out of the channel of lower highs it was forming during the year. Probably will see a retest, before climbing higher. Next resistance between 14000 - 14700.
European markets already capitulated, although the S&P 500 hasn't yet.
The European Economy's future doesn't look bright.
Nevertheless, I think that the market already priced these risks.
Exciting opportunities in Small Caps in Europe.
Do not follow the crowd, be OPEN-MINDED, and be CONTRARIAN.
Good luck with your investments.

Just bought a small-cap altcoin on BinanceCVP priced in ETH looks like it got a pretty decent pullback to the 0.886 Fibonacci level. The OBV indicator looks healthy. The market cap is only 17 million $. Team looks operative. This thing could explode. Volume looks good too. I've set my set orders already. You can find this coin on Binance.

Praj Industries Ltd - Cup & Handle + Ascending Triangle Breakout📊 Script: PRAJIND (PRAJ INDUSTRIES LIMITED)
📊 Nifty50 Stock: NO
📊 Sectoral Index: NIFTY500 / NIFTY INFRASTRUCTURE / NIFTY SMALLCAP
📊 Sector: Industrials Capital Goods
📊 Industry: Engineering & Construction products
Time-Frame : Daily - Ascending Triangle Breakout
Key highlights: 💡⚡
📈 Script is trading at upper band of Bollinger Bands (BB) and giving breakout of it.
📈 MACD is giving crossover .
📈 Double Moving Averages also giving crossover .
📈 Volume is increasing along with price which is volume breakout.
📈 Script is giving breakout of Cup & Handle + Ascending Triangle.
📈 Current RSI is around 64.
📈 One can go for Swing Trade.
⏱️ C.M.P 📑💰- 443
🟢 Target 🎯🏆 - 500
⚠️ Stoploss ☠️🚫 - 414
⚠️ Important: Always maintain your Risk & Reward Ratio.
⚠️ Purely technical based pick.
✅Like and follow to never miss a new idea!✅
Disclaimer: I am not SEBI Registered Advisor. My posts are purely for training and educational purposes.
Eat🍜 Sleep😴 TradingView📈 Repeat 🔁
Happy learning with trading. Cheers!🥂

ASAHINDIA - VOLUME BREAKOUT + MACD CROSSOVER + SMA CROSSOVER 📊 Script: ASAHIINDIA (ASAHI INDIA GLASS LIMITED)
📊 Nifty50 Stock: NO
📊 Sectoral Index: NIFTY AUTO / NIFY 500 / NIFTY SMALLCAP
📊 Sector: Automobile and Auto Components
📊 Industry: Auto Components
Key highlights: 💡⚡
📈 Script is trading at upper band of Bollinger Bands (BB) and giving breakout of it.
📈 MACD is giving crossover.
📈 Crossover in Double Moving Averages.
📈 todays volume is much greater then previous trading session volume which indicates volume breakout.
📈 Current RSI is around 65.
📈 One can go for Swing Trade.
⏱️ C.M.P 📑💰- 624
🟢 Target 🎯🏆 - 676
⚠️ Stoploss ☠️🚫 - 604
⚠️ Important: Always maintain your Risk & Reward Ratio.
✅Like and follow to never miss a new idea!✅
Disclaimer: I am not SEBI Registered Advisor. My posts are purely for training and educational purposes.
Eat🍜 Sleep😴 TradingView📈 Repeat🔁
Happy learning with trading. Cheers!🥂

IWM / SMALL CAPS - STRONGEST MARKETI have a few observations on the market from last week and going on to this week. Something to note, I'm looking at the WEEKLY chart and have a longer time horizon. This is very intentional. I want to demonstrate that PRIOR to any major market move, BOTH bulls and bears will get shaken out. It is very naive to assume that you can have a strong directional bias and only see a straight line upwards in your P/L.
Focusing on a smaller timeframe will result in some serious shake-outs on both ends of the market. Therefore, taking a step back and being able to see the larger picture can very much help tame emotions and see things for what they really are. Unfortunately, this is a rare character trait of the vast majority of market participants.
As of the close of last week:
Small caps are the strongest area of the stock market.
While Nasdaq, S&P and the Dow Jones broke below their prior June lows, Small Caps HAVEN'T. See for yourself. Even though the overall trend is DOWN, this is a major signal to keep an eye on. Small caps tend to lead in the breakdowns and breakouts.
Big directional moves inside a consolidation zone are not trading signals.
The news on 10/13, Thursday, caused a big sell-off that was followed by a massive rally. Everyone on financial TV and social media was calling bottoms, reversals and quoting statistics. Nonetheless a one-day move doesn't mean anything without a major trend change - which takes TIME (and patience) to develop. The following day, Friday, gave back most of Thursday's gains.
Here's the point - this type of price action is very normal in a sideways consolidations market. All big moves INSIDE A CONSOLIDATION ZONE can be easily faded in both directions.
The June rally took SIX WEEKS to build up. Using that as an example (NOT PREDICTION), we can spend a few more weeks in this sideways chop and that would be totally okay.
A fake-out move in either direction would not surprise me
I've donated far too much money to the market by "going all in" on break-out trades. It wouldn't surprise me at all to see a major breakout with an immediate reversal in the opposite direction. Moral of the story here is to wait for confirmation. A small position is a MUST on all breakouts, since the most powerful breakouts rarely come back to test the breakout level and we don't want to miss out on such opportunities. However, such breakouts are RARE and therefore capital preservation and risk management should be our HIGHEST & #1 PRIORITY.
PERSONAL VIEW
I still lean more bullish in the short-term (2-6 months), even with last week's wreck in the rest of the indices. There's too much negativity in the market among other factors. If my personal experience and observations after many years serves me well, such environment can sooner or later become ripe for a major squeeze. You don't want to fade that train.
Mid/Long-term, I'm leaning bearish for another major leg down. We'll need a good rally first to entice all the bulls back into the market. When you start seeing news about "the bottom is in" or "new highs" statistics, BEWARE!
BIBLE VERSE OF THE WEEK
"Unless the LORD builds a house, the work of the builders is wasted. Unless the LORD protects a city, guarding it with sentries will do no good." Psalm 127:1

will small caps save the market or fail at resistancerussel is making its high, and the question is will it print this and reverse following the rest of the market lower, or is this resistance breaking on a second touch to melt the market up with more squeeze. right now the hourly is most important. as long as were below nadaraya watson estimate it feels like price belongs toward bottom of envelope and lower horizontal, and if we bounce we should go back toward estimate or upper horizontal.

small caps could help broader market bullsright now there should be rotation out of small caps, and that should hurt this index, but if levels are respected favorable to changing sss and envelope to bull that could be bought up if we reject from these levels it will favor new lows all over.

SOLARA ACTIVE PHARMA, AT A HUGE DISCOUNT!!i have marked the time of corona crash(2019), with a circle, this stock had not broken its support during a crash too, that means its a stable stock.
it has a good fundamentals, due to heavy corrections from past year, this stock had corrected a lot.
i have drawn a 5 wave pattern, and this stock will now stock its bull rally, as markets for large caps have corrected, and now its time for mid and small caps to get its bull run. (link provided below).
the stock has corrected till its IPO PRICE(when it touched its bottom).
this stock has a good future, invest for long term

SPML INFRA - LONG - SWING TRADENSE:SPMLINFRA looks good for long.
Logic behind long:-
- on higher time frame(monthly) price is make ing reversal and changing trend
- weekly trend change to sideways
- on daily (lower time frame) price has broken the price structure.
Entry @41.90 cmp
Stop loss @ 38
Target @ 62.70

Joe Gun2Head Trade - Short term bottom on Russell2000?Trade Idea: Selling EURJPY
Reasoning: EURJPY to continue lower? Broken trend and EUR under pressure
Entry Level: 1752
Take Profit Level: 1794
Stop Loss: 1741.5
Risk/Reward: 4.15:1
Disclaimer – Signal Centre. Please be reminded – you alone are responsible for your trading – both gains and losses. There is a very high degree of risk involved in trading. The technical analysis , like all indicators, strategies, columns, articles and other features accessible on/though this site is for informational purposes only and should not be construed as investment advice by you. Your use of the technical analysis , as would also your use of all mentioned indicators, strategies, columns, articles and all other features, is entirely at your own risk and it is your sole responsibility to evaluate the accuracy, completeness and usefulness (including suitability) of the information. You should assess the risk of any trade with your financial adviser and make your own independent decision(s) regarding any tradable products which may be the subject matter of the technical analysis or any of the said indicators, strategies, columns, articles and all other features.

RUSSELL 2000 respecting FIB levels; ABC may reach 1500 vol zone.The smallcaps Russell 2000 futures RTY1! (also the IWM etf), a leading market indicator like the transports, may complete an A=C correction ending in the volume profile zone near 1500. (IWM seems to be consolidating in tranches of 200…ex…230, 210, 190, now @ 170 & maybe 150 around 4Q2022.) This will complete the final wave 5 of C-wave.
As you can see in this weekly chart, Russell 2000 respects impt FIB levels. 2100 zone is Fib 0.236, 1900 is Fib 0.383, the current 1700 zone is Fib 0.50 & the projected 1500 bottom zone will be Fib 0.618, the most likely zone for a reversal.
THE BULLISH CASE: if Russell 2000 holds the 1700 zone, the bounce will be very quick due to the 2 LOW VOLUME zones. The target will be 2100 with some consolidation near the 1900 zone.
Not trading advice

IWMQuestion is do we have an overthrow at play? If yes the IWM needs to get back into my channel and not reject here off the bottom channel TL.
A rejection would almost certainly equal $138 and invalidate the 5 wave intermediate structure.

Small Caps Russell 2000 Looks Attractive: Elliott WavesHello traders and investors, today we will talk about small caps Russell 2000, in which from Elliott wave perspective, we see a completed 7-swing complex correction from the highs.
Russell 2000 topped and completed its 5th wave of a five-wave bullish impulse already back in November 2021. Since then we can see slow, choppy and overlapped wave structure that we see it as a correction within uptrend. It's ideally a complex 7-swing A-B-C-X-A-B-C, called also a double three W-X-Y corrective pattern.
A Double three is a sideways combination of two corrective patterns. It's a complex Elliott wave that is subdivided into three minor waves W, X and Y. Its internal structure is (3, 3, 3). In effect, the number three relates to corrective waves, therefore the structure (3, 3, 3) indicates that the WXY wave pattern is composed of three distinctive corrective waves.
• A combination of two corrective structures labelled as WXY
• Wave W and wave Y subdivision can be zigzag , flat, double three of smaller degree, or triple three of smaller degree
• Wave X can be any corrective structure
Well, if we are on the right path and if Russell manages to recover back above 1920 region and resistance line of a corrective channel in current risk-on sentiment, then we can easily confirm support in place and bulls back in the game.
All the best!
If you like what we do, then please like and share our idea.
Disclosure: Please be informed that information we provide is NOT a trading recommendation or investment advice. All of our work is for educational purposes only.

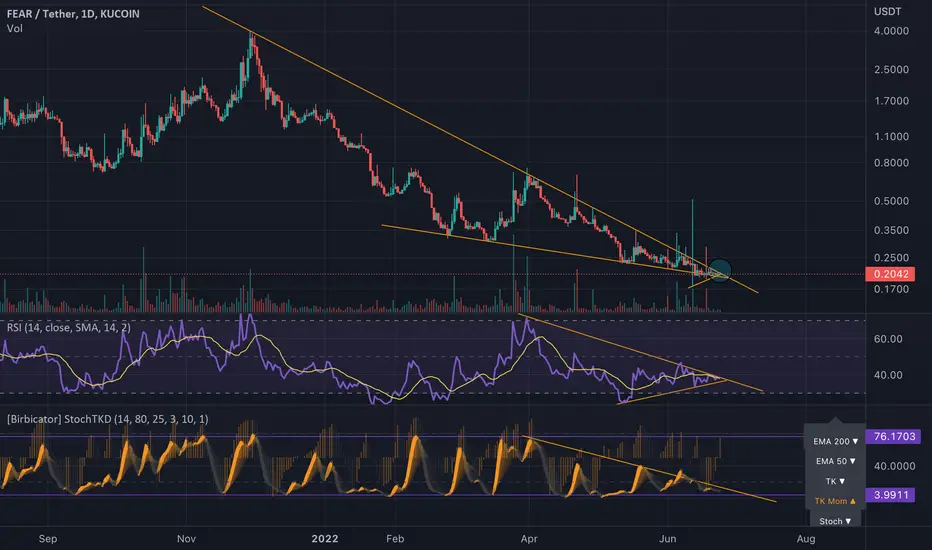
Every TA Persons Favorite Chart $FearAll altcoins are affected by Bitcoins gravity but we've seen many exceptions to this rule especially during crypto/stock market rallies. $Fear is a Gaming/metaverse company specializing in making successful horror games and now has brought their already popular games to the blockchain. This coin is listed on Kucoin and I have been dollar-cost averaging in as I believe it is massively undervalued. You can check out their website if you care to learn more its Fear.io
IWMThe set up from LT support off the bottom channel has Nuked (of course) and I say that b c this year is the year where everything looks like a perfect set up that just nukes. (except oil trades) At this point IWM can still be an over throw, if small caps are pricing in all this inflation & War in Ukraine & recession talk. If the chart is to follow NQ then we have much more pain ahead. Looking at OTC stocks I am really unsure as to how much more pain can be endured. They all seem pretty bottomed. So watching for an MM overthrow here and confirmation would be working the candle sticks back into the LT channel IMO.

$IBO contract with blue digital media dictates further benefits
Blue Digital will be paid USD 27,000 for a three-month commitment beginning June 13, 2022. Additionally, Blue Digital will get 450,000 company's stock options to purchase common shares of the Company, with an exercise price of $0.10 per share, a three-year term, and one-third vesting at the conclusion of each month of service.
