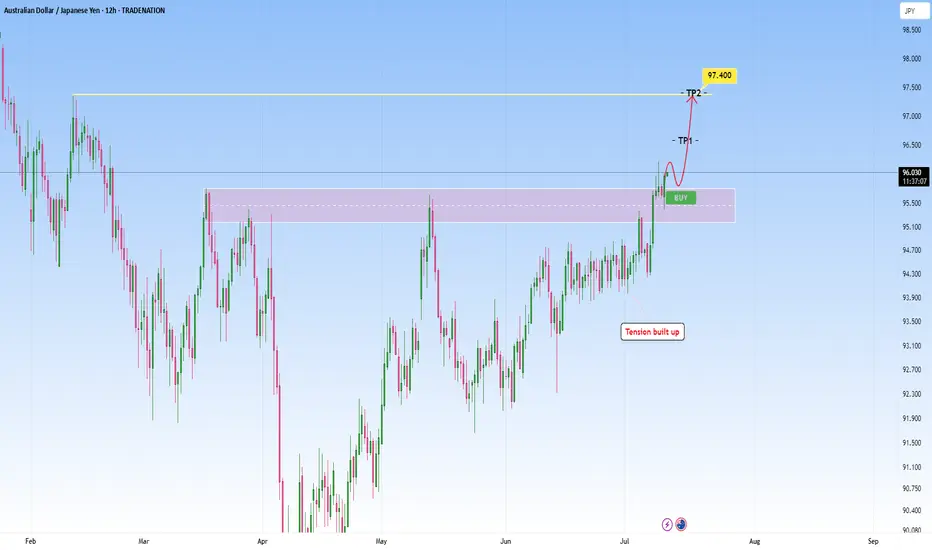
AUDJPY Technical Breakout - Targeting 97.400 Next?TRADENATION:AUDJPY has recently broken decisively above a key resistance zone that had previously capped price for several months. This breakout was preceded by a period of compression and range-bound price action, where bullish momentum steadily built up, indicated by higher lows pressing against the resistance level. This type of structure typically leads to an explosive breakout, which we are now seeing unfold.
After the breakout, price came back for a clean retest of the broken resistance zone, which has now flipped into support. The retest held firmly, suggesting strong buyer interest at this level and confirming the validity of the breakout.
With this structure in place, the bullish momentum is likely to extend further toward the next target zone around 97.400, provided price remains above the current support.
As long as the price holds above the retested zone, the bullish outlook remains intact. A breakdown back below this area, however, would be a warning sign and could open the door to a deeper pullback.
Remember, always wait for confirmation before entering trades, and maintain disciplined risk management.
Smart_money_concepts
AUDJPY at Key Resistance Level: Will it Drop To 92.850?OANDA:AUDJPY is approaching a key resistance level that has previously acted as a strong barrier, triggering bearish momentum in the past. Given its historical significance, how price reacts here could set the tone for the next move.
If bearish signals emerge, such as rejection wicks, bearish candlestick patterns, or signs of weakening bullish pressure, I anticipate a move toward the 92.850 level. However, a clear breakout above this resistance could challenge the bearish outlook and open the door for further upside. It's a pivotal area where price action will likely provide clearer clues on the next direction.
Just my take on support and resistance zones, not financial advice. Always confirm your setups and trade with a proper risk management.
Best of luck!

NZDCAD at Key Resistance Level: Will it Drop To 0.81608?OANDA:NZDCAD is approaching a key resistance level that has previously acted as a strong barrier, triggering bearish momentum in the past. This zone also aligns with prior supply areas where sellers have stepped in, making it a potential point of interest for those looking for short opportunities. Given its historical significance, how price reacts here could set the tone for the next move.
If bearish signals emerge, such as rejection wicks, bearish candlestick patterns, or signs of weakening bullish pressure, I anticipate a move toward the 0.81608 level. However, a clear breakout above this resistance could challenge the bearish outlook and open the door for further upside. It's a pivotal area where price action will likely provide clearer clues on the next direction.
Just my take on support and resistance zones, not financial advice. Always confirm your setups and trade with a proper risk management.
Best of luck!

COCOA Nearing Major Support - Rebound Towards 9,000$?PEPPERSTONE:COCOA is approaching a significant support zone. This area has consistently acted as a key level where buyers have stepped in, leading to notable reversals in the past. The current move suggests the potential for a bullish reaction if price action confirms rejection through signals such as bullish engulfing candles, long lower wicks, or increased buying volume.
If the support holds, I anticipate a move upward toward the 9,000 level, aligning with the expectation of a short-term reversal. However, if the price breaches this zone and sustains below it, the bullish outlook may be invalidated, potentially opening the door for further downside.
Monitoring candlestick patterns and volume at this critical zone is essential for identifying buying opportunities. Proper risk management is advised to navigate potential volatility.
Just my take on support and resistance zones—not financial advice. Always confirm your setups and trade with solid risk management.
Best of luck!

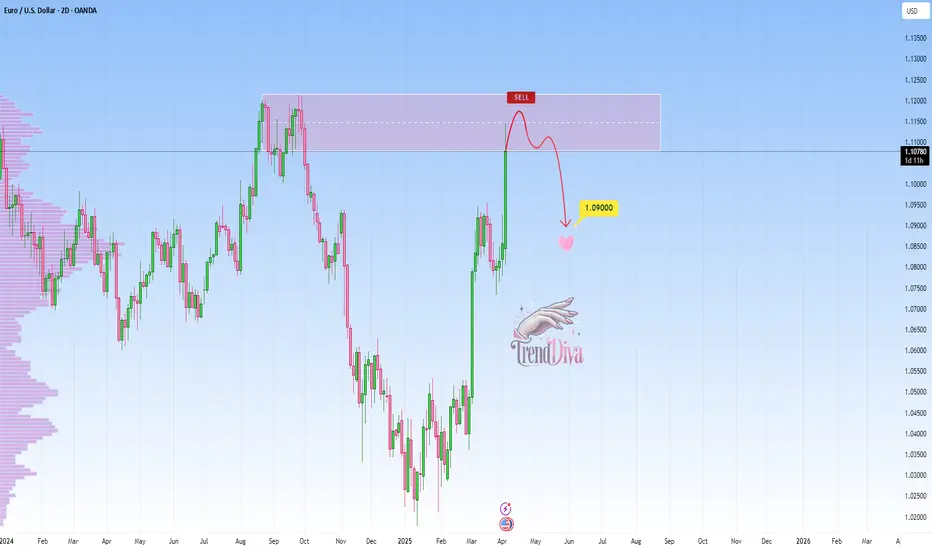
EURUSD at Major Resistance: Will it Drop To 1.09000?OANDA:EURUSD reached a major resistance level that has previously acted as a strong barrier, triggering bearish momentum in the past. This zone also aligns with prior supply areas where sellers have stepped in, making it a potential point of interest for those looking for short opportunities. Given its historical significance, how price reacts here could set the tone for the next move.
If bearish signals emerge, such as rejection wicks, bearish candlestick patterns, or signs of weakening bullish pressure, I anticipate a move toward the 1.09000 level. However, a clear breakout above this resistance could challenge the bearish outlook and open the door for further upside. It's a pivotal area where price action will likely provide clearer clues on the next direction.
Just my take on support and resistance zones, not financial advice. Always confirm your setups and trade with a proper risk management.
Best of luck!
EURJPY Approaching Key Resistance — Potential Sell SetupOANDA:EURJPY is approaching a key resistance level, an area that has been a key point of interest where sellers have regained control, leading to notable reversals in the past. Given this, there is potential for a bearish reaction if price action confirms rejection, such as a bearish engulfing candle, long upper wicks or increased selling volume.
If the resistance level holds, I anticipate a downward move toward 161.20, which represents a logical target based on previous price behavior and market structure.
However, if the price breaks above this zone and sustains above it, the bearish outlook may be invalidated, opening the door for further upside.
Just my take on support and resistance zones—not financial advice. Always confirm your setups and trade with solid risk management.
Best of luck!

NZDJPY Approaching Key Resistance — Potential Sell SetupOANDA:NZDJPY is approaching a key resistance zone, a level where sellers have consistently stepped in, leading to notable bearish reversals in the past. This area is marked by strong selling pressure, increasing the likelihood of a bearish move if sellers regain control.
The current price action suggests that if the pair confirms resistance through signals like bearish engulfing candles, long upper wicks, or increased selling volume, we could see a downward move toward 86.100, which represents a logical target based on previous price behavior and market structure.
However, if the price breaks above this zone and sustains, the bearish outlook may be invalidated, opening the door for further upside.
Just my take on support and resistance zones—not financial advice. Always confirm your setups and trade with solid risk management.
Best of luck!

AUDCAD Approaching Key Support - Rebound Towards 0.90150?OANDA:AUDCAD is approaching a significant support zone, highlighted by previous price reactions and strong buying interest. This area has previously acted as a key demand zone, increasing the likelihood of a bounce if buyers step in.
The current market structure suggests that if the price confirms support within this zone, we could see a bullish reversal. A successful rebound could push the pair toward the 0.90150 level, a logical target based on previous price behavior and current market structure.
However, if the price fails to hold this support and breaks below the zone with momentum, the bullish outlook may be invalidated, potentially opening the door for further downside continuation. Monitoring price action and volume in this area will be crucial to confirm a valid setup.
Just my take on support and resistance zones—not financial advice. Always confirm your setups and trade with solid risk management.
Best of luck!

EURUSD Maintains Bearish Momentum - Is 1.07500 the Next Target?OANDA:EURUSD is trading within a well-defined descending channel, with price action consistently respecting both the upper and lower boundaries. Recently, the price rejected a key resistance zone, reinforcing bearish momentum and signaling a potential continuation toward lower levels.
The current price action suggests that if price continues to respect this resistance, we could see further downside toward 1.07500, aligning with the lower boundary of the channel. However, if price breaks above the channel and sustains above it, the bearish outlook may be invalidated, potentially signaling a shift in momentum. Monitoring price action and volume at this level will be essential for confirmation.
Just my take on support and resistance zones—not financial advice. Always confirm your setups and trade with solid risk management.
Best of luck!

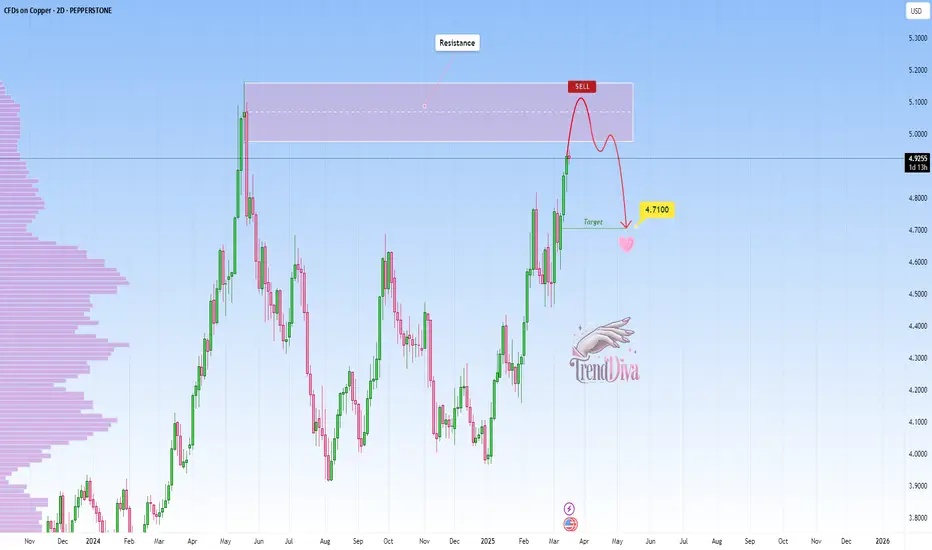
COPPER Approaching Key Resistance — Potential Sell SetupPEPPERSTONE:COPPER is approaching a significant resistance zone, highlighted by previous price reactions and strong selling interest. This area has previously acted as a key supply zone, increasing the likelihood of a bearish reversal if sellers step in.
The current market structure suggests that if the price confirms resistance within this zone, we could see a pullback toward the 4.7100 level, a logical target based on previous price behavior and current market structure. However, a clear breakout above this resistance could challenge the bearish outlook and open the door for further upside. It's a pivotal area where price action will likely provide clearer clues on the next direction.
Just my take on support and resistance zones—not financial advice. Always confirm your setups and trade with solid risk management.
Best of luck!
AUDCAD Approaching Key Resistance — Potential Sell SetupOANDA:AUDCAD is approaching a key resistance zone, highlighted by strong selling interest. This area has historically acted as a supply zone, increasing the likelihood of a bearish reversal if sellers step in.
The current market structure suggests that if the price confirms resistance within this zone, we could see further downside movement. A successful rejection could push the pair toward 0.90700, a logical target based on prior price behavior and the current structure.
However, if the price breaks and holds above this resistance, the bearish outlook may be invalidated, potentially leading to further upside.
Just my take on support and resistance zones—not financial advice. Always confirm your setups and trade with solid risk management.
Best of luck!

NZDJPY at Key Support Level - Rebound Towards 87.300?OANDA:NZDJPY has reached a significant support zone, highlighted by previous price reactions and strong buying interest. This area has previously acted as a key demand zone, increasing the likelihood of a bounce if buyers step in.
The current market structure suggests that if the price confirms support within this zone, we could see a bullish reversal. A successful rebound could push the pair toward the 87.300 level, a logical target based on previous price behavior and current market dynamics. Monitoring candlestick patterns and volume at this critical zone is essential for identifying buying opportunities.
Just my take on support and resistance zones—not financial advice. Always confirm your setups and trade with solid risk management.
Best of luck!

EURUSD at Key Resistance Level – Will Sellers Step In?OANDA:EURUSD has reached a key resistance level, marked by prior price rejections, suggesting strong selling interest. This area has previously acted as a key supply zone, increasing the likelihood of a bearish reversal if sellers step in.
If bearish signals emerge, such as rejection wicks, bearish candlestick patterns, or signs of weakening bullish pressure, I anticipate a move toward the 1.07400 level. However, a clear breakout above this resistance could challenge the bearish outlook and open the door for further upside. It's a pivotal area where price action will likely provide clearer clues on the next direction.
Just my take on support and resistance zones, not financial advice. Always confirm your setups and trade with a proper risk management.

AUDNZD at Key Support Level - Rebound Towards 1.10100?OANDA:AUDNZD has reached a significant support zone, highlighted by previous price reactions and strong buying interest. This area has previously acted as a key demand zone, increasing the likelihood of a bounce if buyers step in.
The current market structure suggests that if the price confirms support within this zone, we could see a bullish reversal. A successful rebound could push the pair toward the 1.10100 level, a logical target based on previous price behavior and current market dynamics. Monitoring candlestick patterns and volume at this critical zone is essential for identifying buying opportunities.
Just my take on support and resistance zones, not financial advice. Always confirm your setups and trade with solid risk management.
Best of luck!

GBPAUD Approaching Major Resistance — Potential Sell SetupOANDA:GBPAUD is approaching a major resistance zone, highlighted by strong selling interest. This area has historically acted as a supply zone, increasing the likelihood of a bearish reversal if sellers step in.
The current market structure suggests that if the price confirms resistance within this zone, we could see further downside movement. A successful rejection could push the pair toward 2.03000, a logical target based on prior price behavior and the current structure.
However, if the price breaks and holds above this resistance, the bearish outlook may be invalidated, potentially leading to further upside.
Just my take on support and resistance zones—not financial advice. Always confirm your setups and trade with solid risk management.
Best of luck!

WHEAT Approaching Key Support - Will Price Rebound to 550$?PEPPERSTONE:WHEAT is approaching a key support level, an area where buyers have previously shown strong interest. The recent bearish movement suggests that price may soon be testing this level, potentially setting up for a rebound.
A bullish confirmation, such as a strong rejection pattern, bullish engulfing candles, or long lower wicks, would strengthen the case for a move higher. If buyers step in, the price could rally toward the 550$ target. However, a decisive breakdown below this support would invalidate the bullish scenario and could lead to further downside.
This is not financial advice but rather how I approach support/resistance zones. Remember, always wait for confirmation, like a rejection candle or volume spike before jumping in.
Best of luck , TrendDiva

USDCHF at Key Support Zone – Potential Rebound to 0.89000OANDA:USDCHF has reached a significant support zone, marked by prior price reactions and strong buying interest. This area has previously acted as a key demand zone, increasing the likelihood of a bullish bounce if buyers step in.
If the price confirms support within this zone through bullish price action—such as long lower wicks or bullish engulfing candles—we could see a reversal toward 0.89000, a logical target based on previous market structure and price behavior.
However, if the price breaks below this support zone and sustains, the bullish outlook would be invalidated, potentially leading to further downside.
Just my take on support and resistance zones—not financial advice. Always confirm your setups and trade with solid risk management.
Best of luck!

SPX500 at Key Support Level: Rebound Towards 5,860?FOREXCOM:SPX500 has reached a significant support zone, highlighted by previous price reactions and strong buying interest. This area has acted as a key demand zone, increasing the likelihood of a bullish bounce if buyers step in.
The current market structure suggests that if the price confirms support within this zone, we could see a bullish reversal. A successful rebound could push the price toward 5,860. However, if the price breaks below this zone, the bullish outlook may be invalidated, opening the possibility for further downside.
Just my take on support and resistance zones—not financial advice. Always confirm your setups and trade with solid risk management.
Best of luck!

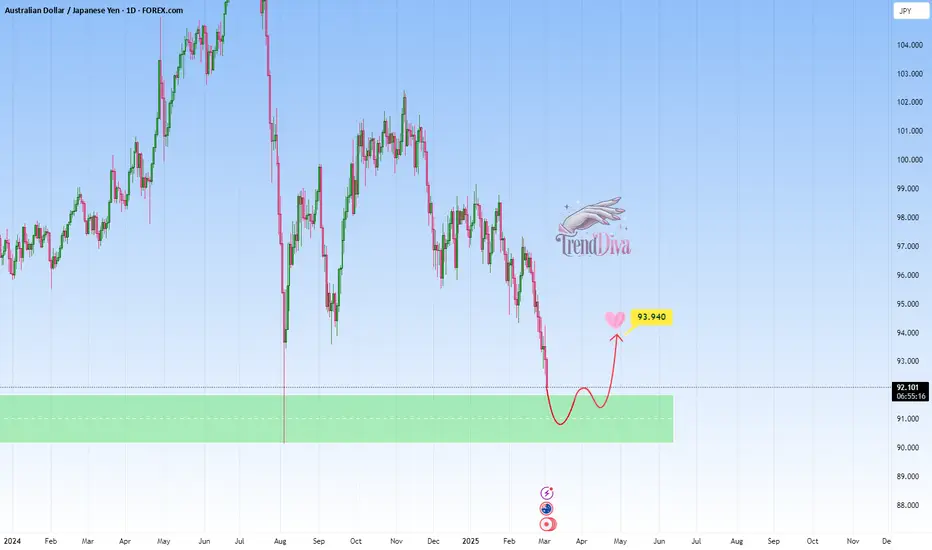
AUDJPY Approaching Key Support - Will Price Rebound to 93.940?OANDA:AUDJPY is approaching a key support level, an area where buyers have previously shown strong interest. The recent bearish movement suggests that price may soon be testing this level, potentially setting up for a rebound.
A bullish confirmation, such as a strong rejection pattern, bullish engulfing candles, or long lower wicks, would strengthen the case for a move higher. If buyers step in, the price could rally toward 93.940, aligning with the next key resistance level.
However, a decisive breakdown below this support would invalidate the bullish scenario and could lead to further downside.
This is not financial advice but rather how I approach support/resistance zones. Remember, always wait for confirmation, like a rejection candle or volume spike before jumping in.
Best of luck, TrendDiva.
NZDCAD — Sell Setup at Key Resistance ZoneOANDA:NZDCAD has reached a key resistance zone, marked by prior price rejections, suggesting strong selling interest. This area has previously acted as a key supply zone, increasing the likelihood of a bearish reversal if sellers step in.
If the price confirms resistance within this zone through bearish price action—such as wick rejections or lower timeframe weakness—we could see a move toward 0.81780, which aligns with a logical target based on recent market structure.
However, if the price breaks and holds above this resistance area, the bearish outlook may be invalidated, potentially opening the door for further upside.
Just my take on support and resistance zones—not financial advice. Always confirm your setups and trade with solid risk management.
Best of luck!

GBPZAR - Sell Setup at Key Resistance LevelOANDA:GBPZAR has reached a significant resistance zone, a level where sellers have consistently stepped in, leading to notable bearish reversals in the past. This area is marked by strong selling interest and historical price reactions, increasing the likelihood of a bearish move if sellers regain control.
The current price action suggests that if the pair confirms resistance through signals like bearish engulfing candles, long upper wicks, or increased selling volume, we could see a downward move toward 23.41160 — a logical target based on previous price behavior and market structure.
However, if the price breaks above this zone and sustains, the bearish outlook may be invalidated, opening the door for further upside.
Just my take on support and resistance zones—not financial advice. Always confirm your setups and trade with solid risk management.
Best of luck!

USDMXN at Key Support Level - Potential Buy SetupFOREXCOM:USDMXN has reached a significant support zone, highlighted by previous price reactions and strong buying interest. This area has historically acted as a key demand zone, increasing the likelihood of a bounce if buyers step in.
The current market structure suggests that if the price confirms support within this zone, we could see a bullish reversal. A successful rebound could push the pair toward the 20.49000 level, a logical target based on past price behavior and structural confluence.
Just my take on support and resistance zones—not financial advice. Always confirm your setups and trade with solid risk management.
Best of luck!

Platinum at Key Support Zone – Will Buyers Step In?OANDA:XPTUSD is approaching a significant support zone, marked by prior price reactions and strong buying interest. This area has previously acted as a key demand zone, increasing the likelihood of a bullish bounce if buyers step in.
If the price confirms support within this zone through bullish price action—such as long lower wicks or bullish engulfing candles—we could see a reversal toward 978.700, a logical target based on previous market structure and price behavior.
However, if the price breaks below this support zone and sustains, the bullish outlook would be invalidated, potentially leading to further downside.
Just my take on support and resistance zones—not financial advice. Always confirm your setups and trade with solid risk management.
Best of luck!
