JNJ – Potential Buy Opportunity at Support LevelThe JNJ stock price is currently approaching a key demand zone. If the price finds support and bullish confirmation signals appear, such as bullish candlestick patterns or long lower wicks, we could see a potential rebound. The first target for this move would be around the $153.03 level.
This setup offers an opportunity for a long position if the demand zone holds. Traders should monitor for additional confirmation before entering.
Do you agree with this analysis, or do you have alternative views on this setup? Share your thoughts in the comments!
Smart_money_concepts

EURGBP Testing Resistance – Pullback Toward 0.8407 ExpectedThe EURGBP pair is approaching a key resistance zone, where sellers are likely to step in. The current structure suggests a potential rejection at this level, with the price expected to pull back toward the 0.8407 level, which represents a logical target for this setup.
This setup aligns with the idea of a short-term correction from resistance, offering a potential short opportunity if rejection is confirmed.

NZDSGD - Potential Long from Key Support ZoneOANDA:NZDSGD is approaching a key support level that has previously acted as a strong demand zone, leading to bullish momentum. The recent decline into this area suggests a potential opportunity for buyers to step in and push prices higher.
A bullish confirmation, such as a strong rejection pattern, bullish engulfing candle, or long lower wick, would increase the likelihood of an upward move. If buyers regain control, the price may head toward the 0.76630 level. This setup indicates a potential short-term rebound within the broader market structure
This is not financial advice but rather how I approach support/resistance zones. Remember, always wait for confirmation, like a rejection candle or volume spike before jumping in.
Please boost this post, every like and comment drives me to bring you more ideas! I’d love to hear your perspective in the comments.
Best of luck , TrendDiva

EURCAD: Sell Setup After Impulsive Move to ResistanceFOREXCOM:EURCAD is approaching a significant resistance zone, marked by historical price rejections. This level aligns with a key area of interest where sellers have previously regained control, causing substantial bearish moves.
The current market structure suggests that a potential rejection could occur if price action confirms it. If we observe bearish signals, such as a bearish engulfing candle or clear wicks rejecting the zone, the market may reverse and head lower.
I anticipate that if sellers take control, the price could move downward toward the 1.50000 level, which represents a logical target within the current market structure. This setup reflects the potential for a retracement after an impulsive move, supported by the confluence of previous price behavior and the current structure.

GBPZAR Approaching Resistance Zone: Potential Sell SetupOANDA:GBPZAR is approaching a key resistance zone, a level defined by previous price rejections and significant selling pressure. While the current bullish momentum may drive the price into this area, there is a strong probability of a correction once the zone is tested.
If sellers regain control, a rejection at this resistance area could lead the price to drop toward the 23.2084 level. This setup aligns with the expectation of a short-term correction after an impulsive move.
I'll wait for clear rejection signals, such as bearish engulfing candles or strong wicks, before taking action. Let me know if you agree with this analysis or if you have additional insights to add!

GOLD at Key Resistance: Will Sellers Take Control?OANDA:XAUUSD has reached a key resistance zone, an area where sellers have historically regained control. The ongoing bullish momentum may face exhaustion as price approaches this level, making it a potential turning point.
If bearish confirmation appears, such as rejection candles or a bearish engulfing pattern, I anticipate a pullback targeting the 2,740.000 level, which represents a logical target within the current market structure. This setup reflects a possible short-term correction within the broader market context.

EURUSD at Key Support: Bullish Continuation Ahead?OANDA:EURUSD is trading within a well-defined ascending channel, indicating a bullish trend. The price has recently pulled back into a demand zone, which has previously acted as strong support. This confluence of support and the lower boundary of the channel suggests the potential for a bullish continuation.
If the price confirms a rejection from this zone, I anticipate an upward move toward the 1.05200 level, which aligns with the previous resistance level. However, a breakdown below the demand zone and channel support would invalidate this setup and signal possible bearish pressure.
This setup aligns with the idea of trend continuation within an ascending channel. Let me know your thoughts or if you have any alternative perspectives!

AUDUSD - Potential Bullish Continuation SetupOANDA:AUDUSD is currently trading within a well-defined ascending channel, reflecting a strong bullish market structure. The price is approaching a key support zone, which aligns with the lower boundary of the channel.
If the price holds at this support and buyers step in, a bullish continuation toward the 0.63380 level is likely, making it a reasonable target for an upward move.
Trade Considerations:
Wait for confirmation of buying pressure before entering a position.
Monitor for invalidation if the price breaks below the demand zone and the channel boundary, as this would signal potential downside momentum.
This is not financial advice but rather how I approach support/resistance zones. Remember, always wait for confirmation, like a rejection candle or volume spike before jumping in.
Please boost this post, every like and comment drives me to bring you more ideas! I’d love to hear your perspective in the comments.
Best of luck , TrendDiva

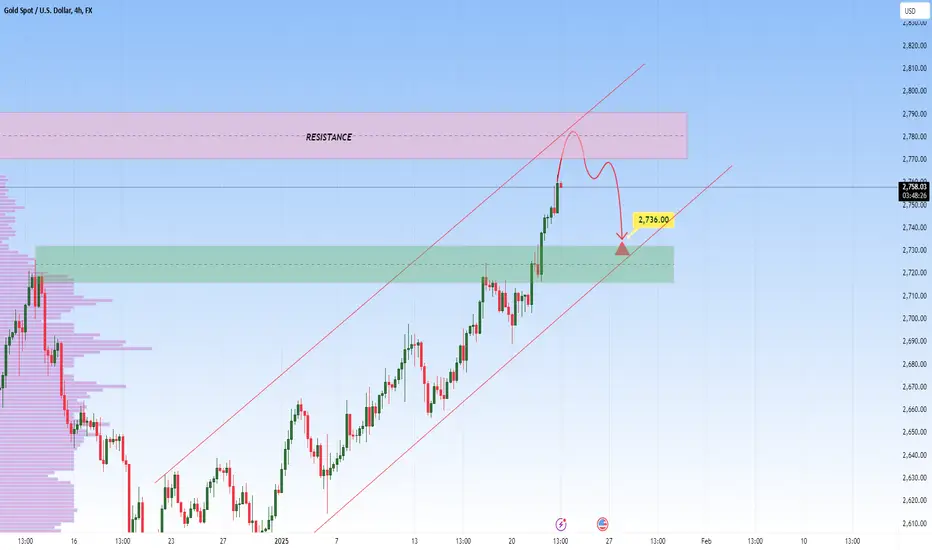
Gold Approaching Major Resistance – Will It Drop to 2,736$?OANDA:XAUUSD is nearing the upper boundary of an ascending channel, which aligns with a major resistance zone. This area has acted in the past as a reversal point, making it a key level to watch for potential bearish movements.
If the price confirms rejection at this level, I anticipate a move downward toward the 2,736$ level, consistent with the channel’s structure and a nearby support zone. Conversely, if this resistance is breached, it could signal increased buying pressure and a continuation of the bullish trend.
EURAUD: Sell Setup at Key Resistance Zone OANDA:EURAUD is testing a significant resistance zone, a level where price has historically struggled to break higher. This area represents a potential reversal point, as the market structure suggests sellers may regain control.
If the price confirms a rejection at this resistance zone, I anticipate a potential move downward toward the 1.65600 level, which represents a logical target for this setup.
If you agree with this analysis or have additional insights, feel free to share your thoughts in the comments!

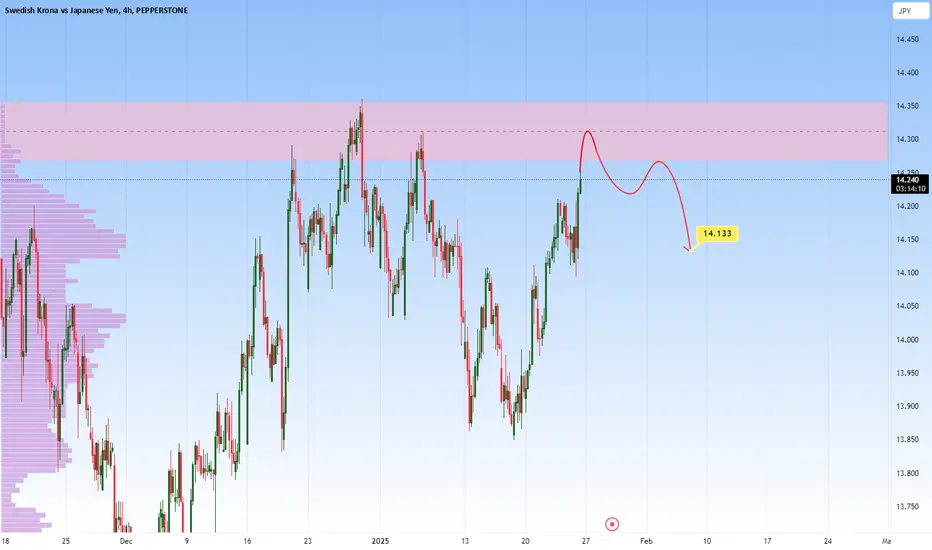
SEKJPY at Major Resistance - Could it Reach 14.133?SAXO:SEKJPY is approaching a key resistance level that has previously triggered bearish reversals. While current bullish momentum has driven the price into this zone, it could present an opportunity for sellers to step in.
If bearish signals such as rejection wicks or bearish engulfing candles appear, a move toward 14.133 could follow. On the other hand, a breakout above this resistance would invalidate the bearish bias and signal potential for further upside.
Key Takeaway: Wait for clear rejection patterns before considering short positions.
CADJPY - Bearish Continuation After Support BreakOANDA:CADJPY has broken through a key support level and is now retesting this level as resistance. If the resistance holds, it could pave the way for a deeper move downward, with the 106.600 level emerging as the next major area of interest. This level also aligns with a significant support zone, making it a critical area where buyers may attempt to regain control.
Traders are advised to monitor for bearish confirmation signals, such as bearish engulfing candlestick patterns, rejection wicks, or strong selling volume at the retested resistance level. Such signals would reinforce the probability of a continuation to the downside. However, a decisive break back above the resistance zone would invalidate the bearish scenario

USDJPY Key Support Broken — Bearish Momentum in PlayFOREXCOM:USDJPY has broken below a key support zone, indicating that sellers may have gained control. This area was previously a strong demand zone, but the decisive break suggests bearish momentum is taking over.
The current market structure implies the potential for a retest of the broken support level, which could act as resistance before a continuation to the downside. If the price confirms rejection at the retest with bearish candlestick patterns or wicks, I anticipate a further decline toward the 153.700 level, where a stronger demand zone resides.
This setup aligns with the concept of a classic break-and-retest scenario, where the market resumes the downward move after a corrective pullback.

NZDJPY Approaching Key Support Zone: Potential Buy SetupOANDA:NZDJPY is trading near a significant support zone marked by prior price reactions. This area has historically acted as a strong demand zone, leading to reversals in the past. The current price action suggests that the pair may soon test this zone again.
If buyers regain control and we see bullish rejection patterns, such as pin bars or engulfing candles, the price could rebound toward the 88.091 level, which represents a logical target for this setup. If the price breaks below this support zone, further downside could follow.
If this analysis resonates with you or you have a different perspective, feel free to discuss in the comments!

USDJPY – Break & Retest Short SetupThe USDJPY pair has recently broken below a key support level. This area could potentially act as resistance, presenting a classic break-and-retest scenario.
A bearish confirmation, such as rejection wicks, bearish engulfing candles, or strong selling pressure, would validate the potential for a short setup. If sellers step in at this level, the next downside target could be the 154.537 zone.
Traders should monitor the retest closely for clear signs of rejection before committing to short positions.

GBPCAD - Bearish Momentum Expected from Resistance ZoneOANDA:GBPCAD is currently testing a significant resistance zone. This level has previously acted as resistance, leading to a bearish reversal. The recent upward momentum into this zone suggests a potential for sellers to regain control and push prices lower.
A bearish confirmation, such as a rejection candle, bearish engulfing pattern, or signs of fading bullish momentum, would indicate an increased likelihood of a move downward. If this scenario unfolds, the price could head toward the 1.78220 level.
This setup aligns with a potential short-term correction after an impulsive move. Traders should wait for confirmation of selling pressure before considering short positions.
This is not financial advice but rather how I approach support/resistance zones. Always wait for confirmation, like a rejection candle or volume spike before jumping in. And let me know what you think of this setup in the comments!

DXY - Potential Sell At Key ResistanceThe DXY is approaching a key resistance zone, which has historically acted as a strong supply area. This level has seen multiple price rejections in the past, making it a critical area of interest for potential reversals.
The current uptrend has brought the price back into this resistance zone, but there are signs of potential trend exhaustion as the price tests these levels. If the price confirms rejection with bearish signals, such as reversal candlesticks or divergence on oscillators, we could see a downward move.
I anticipate that, upon rejection from this resistance zone, the DXY may head lower toward the 107.548 level. This setup aligns with the idea of a short-term correction within the broader market context.
Let me know your thoughts on this analysis or if you see a different perspective! Feel free to share your insights in the comments!

Brent Crude Oil At Key Resistance - Will It Drop to 78.00?ICMARKETS:XBRUSD is at a key resistance area, marked by historical price reactions and strong selling pressure. This zone has been a reliable turning point for bearish reversals in the past.
If bearish confirmation emerges, such as strong upper wicks or bearish candlestick patterns, I expect the price to move toward 78.00. A breakout above this resistance, however, would invalidate the bearish scenario.
Traders should remain cautious and use proper risk management when approaching this level.

COTTON: Buy Setup at Key Support ZonePEPPERSTONE:COTTON is trading within a significant demand zone, marked by prior price reactions and a strong historical support area. This zone has previously acted as a pivot point for bullish reversals, suggesting a high-probability area for buyer interest.
I anticipate that if the price confirms a rejection within this demand zone, the market may move upward toward the 6,824 level, which represents a logical target within the current market structure.
If you have any additional insights or a different perspective, feel free to share your thoughts in the comments!

EURAUD Testing Key Resistance Zone: Potential Sell SetupOANDA:EURAUD has reached a significant resistance zone, marked by historical price rejections. The recent bullish momentum has brought the price into this key resistance zone, where sellers have previously gained control. The current market structure suggests the potential for a reversal, as this level has consistently acted as a barrier to further upward movement. If the price confirms a rejection from this resistance zone, such as with bearish candlestick patterns or wicks signaling strong rejection, I anticipate a move downward toward the 1.66246 level.
Patience is key—look for confirmation signals before taking any short positions.

GBPCAD at Key Resistance Zone: Potential Sell SetupOANDA:GBPCAD has reached a key resistance zone. The market structure suggests a possible reversal as buyers may face exhaustion. If the price shows rejection through bearish patterns or wicks, I expect a move down toward the 1.78455 level. However, if the price successfully breaks and holds above the zone, this would invalidate the bearish outlook and could open the door for further upside. Traders should monitor price action closely at this critical resistance area.
This setup signals a potential correction after the bullish trend. Wait for confirmation before entering short positions.

AVAXUSD Reached Key Support Zone – Bullish Move Ahead?COINBASE:AVAXUSD is trading within a significant support zone, marked by historical price rejections and strong buyer activity. This area has previously acted as a major support level, suggesting a high-probability reversal zone.
If the price confirms a rejection within this zone, I anticipate an upward move toward the 38.00 level, which represents a logical target for this setup. However, if the price closes below the zone, it would invalidate the bullish setup and signal further downside momentum.
If you agree with this analysis or have additional insights, feel free to share your thoughts!

SUI at Key Support Zone – Potential Reversal Ahead!COINBASE:SUIUSD is currently trading within a significant support zone. This zone has previously triggered bullish reactions, making it a key area to watch for potential reversals.
If the price action shows clear signs of rejection, such as bullish engulfing candles or wicks indicating buying pressure, there is a high probability of a rebound. I anticipate the price could move upward toward the $4.4000 level as the next target.
