GBP_CHF SWING LONG|
✅GBP_CHF is set to retest a
Strong support level below at 1.0650
After trading in a strong downtrend for some time
Which makes a bullish rebound a likely scenario
With the target being a local resistance above at 1.0750
LONG🚀
✅Like and subscribe to never miss a new idea!✅
Disclosure: I am part of Trade Nation's Influencer program and receive a monthly fee for using their TradingView charts in my analysis.
Smartmoney

GOLD Local Rebound Ahead! Buy!
Hello,Traders!
GOLD made a retest of
The horizontal support
Level of 3343$ and as
We are locally bullish
Biases we will be expecting
A local bullish rebound
Buy!
Comment and subscribe to help us grow!
Check out other forecasts below too!
Disclosure: I am part of Trade Nation's Influencer program and receive a monthly fee for using their TradingView charts in my analysis.

GBP-CAD Support Ahead! Buy!
Hello,Traders!
GBP-CAD keeps falling down
But a strong horizontal support
Level of 1.8322 is ahead so after
The retest we will be expecting
A local bullish rebound
Buy!
Comment and subscribe to help us grow!
Check out other forecasts below too!
Disclosure: I am part of Trade Nation's Influencer program and receive a monthly fee for using their TradingView charts in my analysis.

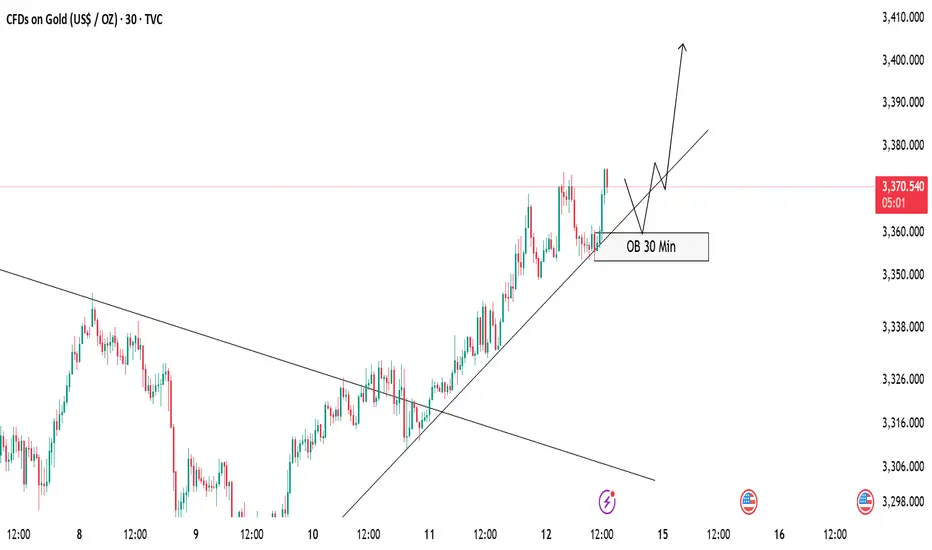
GOLD Buy Setup – OB Zone in FocusCurrently, gold is respecting the ascending trendline and maintaining a bullish structure 🟢. Price hasn’t tapped into the 30 Min Order Block (OB) yet, but we are expecting a potential pullback into this OB zone 📍.
✅ Our Plan:
We will wait patiently for price to mitigate the OB.
After the tap, we will look for bullish confirmation (rejection wick, bullish engulfing, or break of minor structure) before entering a buy position 🚀.
As long as the trendline holds, we remain bullish on gold.
📝 Invalidation:
If price breaks and closes below the trendline and OB zone, we will stay out or re-evaluate the setup ❌.
Stay disciplined and follow the plan! 💪
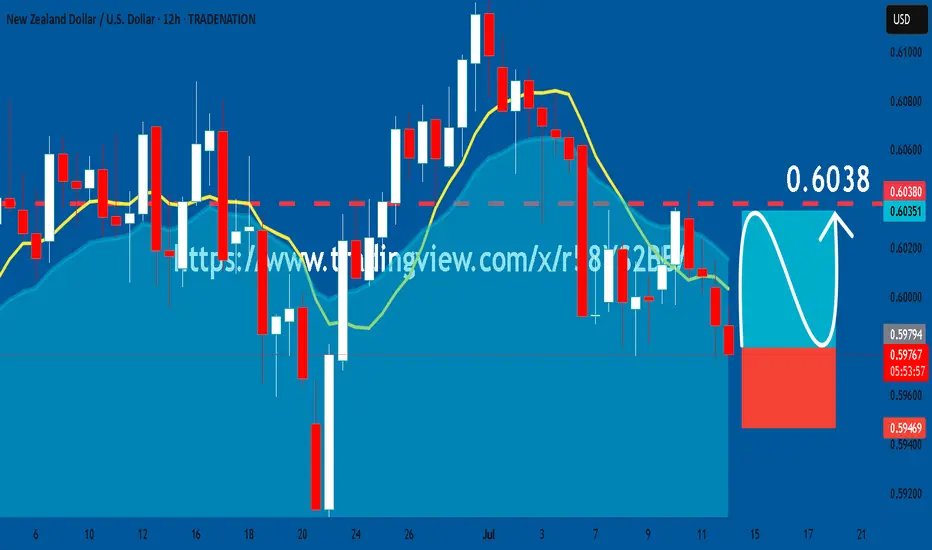
NZDUSD: Bullish Continuation & Long Trade
NZDUSD
- Classic bullish setup
- Our team expects bullish continuation
SUGGESTED TRADE:
Swing Trade
Long NZDUSD
Entry Point - 0.5978
Stop Loss - 0.5946
Take Profit - 0.6038
Our Risk - 1%
Start protection of your profits from lower levels
Disclosure: I am part of Trade Nation's Influencer program and receive a monthly fee for using their TradingView charts in my analysis.
❤️ Please, support our work with like & comment! ❤️
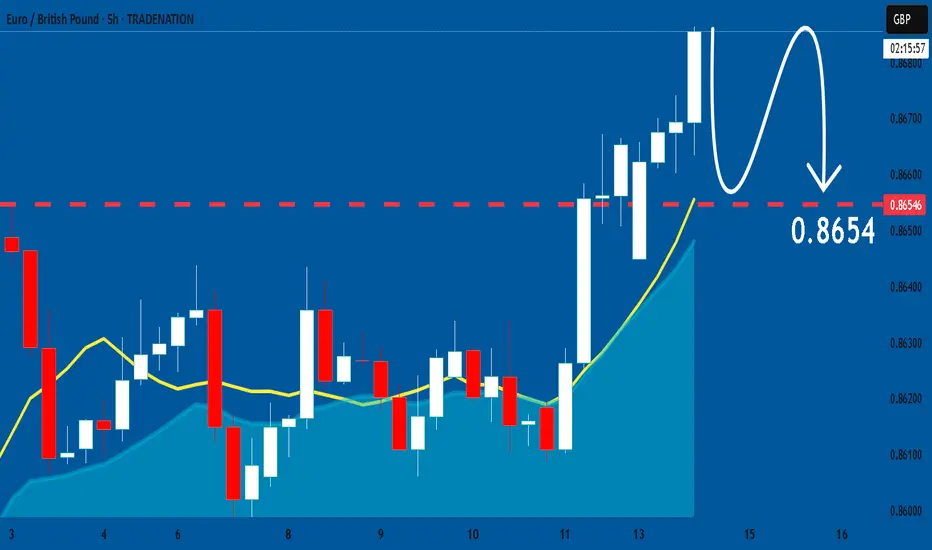
EURGBP: Bears Will Push Lower
Remember that we can not, and should not impose our will on the market but rather listen to its whims and make profit by following it. And thus shall be done today on the EURGBP pair which is likely to be pushed down by the bears so we will sell!
Disclosure: I am part of Trade Nation's Influencer program and receive a monthly fee for using their TradingView charts in my analysis.
❤️ Please, support our work with like & comment! ❤️
EURCHF: Bullish Forecast & Bullish Scenario
The recent price action on the EURCHF pair was keeping me on the fence, however, my bias is slowly but surely changing into the bullish one and I think we will see the price go up.
Disclosure: I am part of Trade Nation's Influencer program and receive a monthly fee for using their TradingView charts in my analysis.
❤️ Please, support our work with like & comment! ❤️

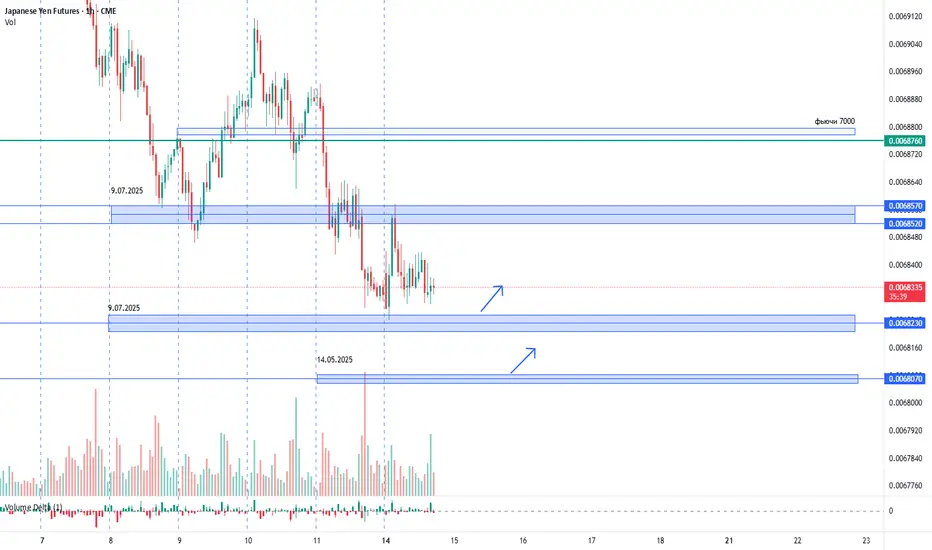
USDJPY. 14.07.2025. The plan for the next few days.The nearest interesting resistance zones have already been worked out at night and have given a good reaction. Let's mark the others where we can expect a reaction. It's not certain that there will be a major reversal, but I believe we will see a correction that can be monetized. We are waiting for a reaction and looking for an entry point.
The post will be adjusted based on changes.
Don't forget to click on the Rocket! =)
GOLD: Long Signal Explained
GOLD
- Classic bullish formation
- Our team expects growth
SUGGESTED TRADE:
Swing Trade
Buy GOLD
Entry Level - 3352.0
Sl - 3346.8
Tp - 3362.4
Our Risk - 1%
Start protection of your profits from lower levels
Disclosure: I am part of Trade Nation's Influencer program and receive a monthly fee for using their TradingView charts in my analysis.
❤️ Please, support our work with like & comment! ❤️

GBPCHF Technical Analysis! BUY!
My dear followers,
I analysed this chart on GBPCHF and concluded the following:
The market is trading on 1.0733 pivot level.
Bias - Bullish
Technical Indicators: Both Super Trend & Pivot HL indicate a highly probable Bullish continuation.
Target - 1.0775
About Used Indicators:
A super-trend indicator is plotted on either above or below the closing price to signal a buy or sell. The indicator changes color, based on whether or not you should be buying. If the super-trend indicator moves below the closing price, the indicator turns green, and it signals an entry point or points to buy.
Disclosure: I am part of Trade Nation's Influencer program and receive a monthly fee for using their TradingView charts in my analysis.
———————————
WISH YOU ALL LUCK

GBP_USD RISING SUPPORT AHEAD|LONG|
✅GBP_USD is going down now
But a strong rising support level is ahead
Thus I am expecting a rebound
And a move up towards the target of 1.3600
LONG🚀
✅Like and subscribe to never miss a new idea!✅
Disclosure: I am part of Trade Nation's Influencer program and receive a monthly fee for using their TradingView charts in my analysis.

EUR-CHF Local Long! Buy!
Hello,Traders!
EUR-CHF is about to retest
The strong horizontal support
Of 0.9298 and as the pair
Is locally oversold we will be
Expecting a local bullish
Rebound and a move up
Buy!
Comment and subscribe to help us grow!
Check out other forecasts below too!
Disclosure: I am part of Trade Nation's Influencer program and receive a monthly fee for using their TradingView charts in my analysis.

GBP-AUD Risky Long! Buy!
Hello,Traders!
GBP-AUD keeps falling and
The pair is locally oversold
So as the pair is retesting
The horizontal support
Of 2.0480 we will be expecting
A local bullish correction
On Monday
Buy!
Comment and subscribe to help us grow!
Check out other forecasts below too!
Disclosure: I am part of Trade Nation's Influencer program and receive a monthly fee for using their TradingView charts in my analysis.

EUR-USD Will Keep Growing! Buy!
Hello,Traders!
EUR-USD keep trading in
An uptrend along the rising support
So as the pair is approaching
A the support we will be
Expecting a bullish rebound
And a move up on Monday
Buy!
Comment and subscribe to help us grow!
Check out other forecasts below too!
Disclosure: I am part of Trade Nation's Influencer program and receive a monthly fee for using their TradingView charts in my analysis.

EUR_AUD WILL GO UP|LONG|
✅EUR_AUD is trading in an uptrend
And the bullish bias is confirmed
By the rebound we are seeing
After the pair retested the support
So I think the growth will continue
LONG🚀
✅Like and subscribe to never miss a new idea!✅
Disclosure: I am part of Trade Nation's Influencer program and receive a monthly fee for using their TradingView charts in my analysis.

USOIL RISKY LONG|
✅CRUDE OIL is trading along
The rising support line
And as the price is going up now
After the retest of the line
I am expecting the price to keep growing
To retest the supply levels above at 70.20$
LONG🚀
✅Like and subscribe to never miss a new idea!✅
Disclosure: I am part of Trade Nation's Influencer program and receive a monthly fee for using their TradingView charts in my analysis.

EURUSD: Long Signal with Entry/SL/TP
EURUSD
- Classic bullish formation
- Our team expects pullback
SUGGESTED TRADE:
Swing Trade
Long EURUSD
Entry - 1.1689
Sl - 1.1627
Tp - 1.1799
Our Risk - 1%
Start protection of your profits from lower levels
Disclosure: I am part of Trade Nation's Influencer program and receive a monthly fee for using their TradingView charts in my analysis.
❤️ Please, support our work with like & comment! ❤️

USOIL: Bearish Continuation & Short Trade
USOIL
- Classic bearish setup
- Our team expects bearish continuation
SUGGESTED TRADE:
Swing Trade
Short USOI
Entry Point - 68.66
Stop Loss - 69.40
Take Profit - 67.23
Our Risk - 1%
Start protection of your profits from lower levels
Disclosure: I am part of Trade Nation's Influencer program and receive a monthly fee for using their TradingView charts in my analysis.
❤️ Please, support our work with like & comment! ❤️

AUDCAD: Forecast & Technical Analysis
Balance of buyers and sellers on the AUDCAD pair, that is best felt when all the timeframes are analyzed properly is shifting in favor of the sellers, therefore is it only natural that we go short on the pair.
Disclosure: I am part of Trade Nation's Influencer program and receive a monthly fee for using their TradingView charts in my analysis.
❤️ Please, support our work with like & comment! ❤️

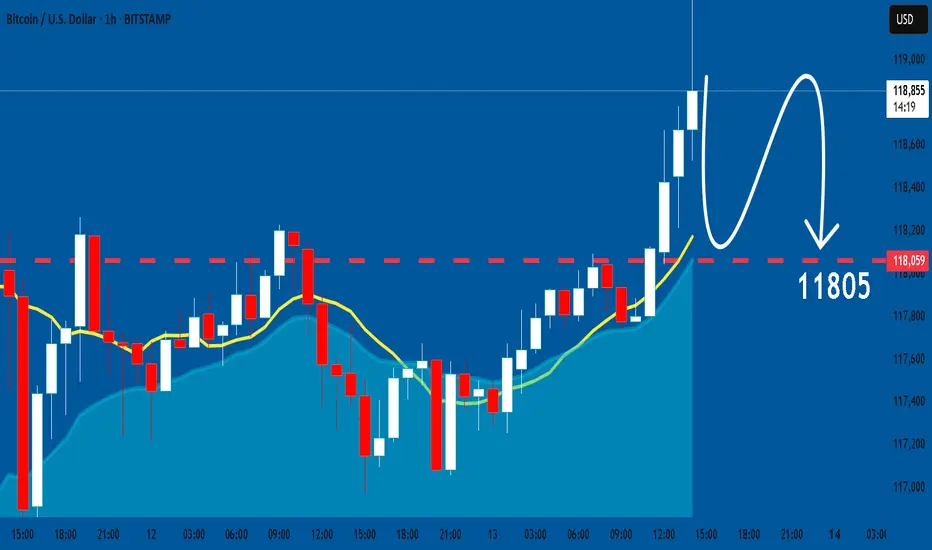
BTCUSD: Bearish Continuation
The charts are full of distraction, disturbance and are a graveyard of fear and greed which shall not cloud our judgement on the current state of affairs in the BTCUSD pair price action which suggests a high likelihood of a coming move down.
Disclosure: I am part of Trade Nation's Influencer program and receive a monthly fee for using their TradingView charts in my analysis.
❤️ Please, support our work with like & comment! ❤️
AUD_JPY IS OVERBOUGHT|SHORT|
✅AUD_JPY is trading in a strong
Uptrend but the pair is now
Locally overbought so after the
Pair hits the horizontal resistance
Level of 97.350 we will be expecting
A pullback and a bearish correction
On Monday!
SHORT🔥
✅Like and subscribe to never miss a new idea!✅
Disclosure: I am part of Trade Nation's Influencer program and receive a monthly fee for using their TradingView charts in my analysis.

GBP-CHF Bearish Breakout! Sell!
Hello,Traders!
GBP-CHF is trading in a strong
Downtrend and the pair
Broke the key horizontal
Level around 1.0780 which
Reinforces our bearish
Bias and we will be
Expecting a further
Bearish move down
On Monday!
Sell!
Comment and subscribe to help us grow!
Check out other forecasts below too!
Disclosure: I am part of Trade Nation's Influencer program and receive a monthly fee for using their TradingView charts in my analysis.

EUR_CAD GROWTH AHEAD|LONG|
✅EUR_CAD went down to retest
A horizontal support of 1.5964
Which makes me locally bullish biased
And I think that a move up
From the level is to be expected
Towards the target above at 1.6040
LONG🚀
✅Like and subscribe to never miss a new idea!✅
Disclosure: I am part of Trade Nation's Influencer program and receive a monthly fee for using their TradingView charts in my analysis.
