AUD_USD BULLISH BREAKOUT|LONG|
✅AUD_USD is going up
Now and the pair made a bullish
Breakout of the key horizontal
Level of 0.6590 and the breakout
Is confirmed so we are bullish
Biased and we will be expecting
A further bullish move up
LONG🚀
✅Like and subscribe to never miss a new idea!✅
Disclosure: I am part of Trade Nation's Influencer program and receive a monthly fee for using their TradingView charts in my analysis.
Smartmoney

NATGAS Support Ahead! Buy!
Hello,Traders!
NATGAS keeps falling but
A strong horizontal support
Level is ahead at 3.00$ so
After Gas retests the support
We will be expecting a local
Bullish rebound
Buy!
Comment and subscribe to help us grow!
Check out other forecasts below too!
Disclosure: I am part of Trade Nation's Influencer program and receive a monthly fee for using their TradingView charts in my analysis.

SILVER WILL KEEP GROWING|LONG|
✅SILVER is trading in an
Uptrend and the price made
A retest of the horizontal support
Level of 39.10$ and we are already
Seeing a bullish reaction so we
Are bullish biased and we will be
Expecting a further bullish move up
LONG🚀
✅Like and subscribe to never miss a new idea!✅
Disclosure: I am part of Trade Nation's Influencer program and receive a monthly fee for using their TradingView charts in my analysis.

GOLD LOCAL LONG|
✅GOLD went down from
The resistance just as I predicted
But a strong support level is ahead at 3380$
Thus I am expecting a rebound
And a move up towards the target of 3400$
LONG🚀
✅Like and subscribe to never miss a new idea!✅
Disclosure: I am part of Trade Nation's Influencer program and receive a monthly fee for using their TradingView charts in my analysis.

EUR/USD About to Trap the Bears? Final Push Before the Drop! EUR/USD is showing a solid short-term bullish structure, with a move initiated from the demand base around 1.1560, fueling a strong rally toward the current level near 1.1770. Price is now approaching a significant supply zone between 1.1790 and 1.1875, previously responsible for the last major bearish swing. This area also aligns with projected Fibonacci levels (25%-100%), reinforcing its relevance as a possible inflection point.
This movement suggests there’s still room for price to push higher, likely completing the final leg of this bullish cycle before a more convincing short setup develops. At this stage, Fibonacci levels are not acting as firm supports, but rather as hypothetical pullback projections: once price enters the 1.1800–1.1875 area, it will be key to monitor for signs of exhaustion. A rejection here may initiate a bearish retracement toward 1.1670–1.1650, in line with the 62–70.5% fib levels.
Retail sentiment remains highly contrarian: 76% of traders are short, positioning themselves too early against the trend. This imbalance adds fuel for a potential continuation higher, as the market may seek to "squeeze" these premature shorts. Additionally, the COT report confirms growing institutional interest in the euro, with non-commercials increasing their net longs, while USD net long exposure continues to shrink.
Seasonality adds further confluence: late July is historically bullish for EUR/USD, suggesting one final leg up could materialize before a typically weaker August.
✅ Trading Outlook
EUR/USD is technically aligned for a final push toward the 1.1800–1.1875 premium zone, where a potential short opportunity may arise. The rally is currently driven by overextended retail shorts and supportive institutional flows. Only after price interacts with the upper supply zone should reversal signs be evaluated, with correction targets around 1.1670–1.1650. The ideal play: wait for confirmation of bearish intent in August, when seasonal weakness typically kicks in.

NZD-JPY Resistance Ahead! Sell!
Hello,Traders!
NZD-JPY is trading in an
Uptrend but the pair is locally
Overbought so after the pair
Hits the horizontal resistance
Level of 88.900 we will be
Expecting a local bearish
Move down
Sell!
Comment and subscribe to help us grow!
Check out other forecasts below too!
Disclosure: I am part of Trade Nation's Influencer program and receive a monthly fee for using their TradingView charts in my analysis.

CAD-JPY Local Long! Buy!
Hello,Traders!
CAD-JPY made a retest
Of the horizontal support
Level of 107.400 and we
Are already seeing a bullish
Rebound and we will be
Expecting a further local
Bullish move up
Buy!
Comment and subscribe to help us grow!
Check out other forecasts below too!
Disclosure: I am part of Trade Nation's Influencer program and receive a monthly fee for using their TradingView charts in my analysis.

XAUUSD LIVE OUTLOOK – JULY 23, 2025Good evening, traders—let’s get this right, no mistakes. Gold hit 3,438, then pulled back and found support exactly in the 3,380–3,390 zone. Here’s your precise update:
🔸 HTF OVERVIEW (H4 → H1)
New High & Liquidity Sweep: A clean breakout to 3,438 invalidated every old supply.
Primary Demand: Price settled into the 3,380–3,390 H4 order block (untested FVG beneath). H1 confirms this blue zone as the critical buy area.
Invalidated Supply: No valid sell zones until we carve fresh structure above 3,438.
🔹 LTF PRECISION (M30 → M15)
M30 Flow: Spike to 3,438, then instant drop into 3,380–3,390. Volume spiked on the decline, then eased as price held.
M15 Structure: Inside 3,380–3,390, watch for a clean BOS above 3,395—that’s your bull‑bear pivot. Until then, this zone is the edge of the knife.
🎯 KEY ZONES & TRIGGERS
Buy Zone #1 (Live): 3,380–3,390
Confluence: H4 order block + unfilled FVG + H1 swing low
Trigger: M15 BOS above 3,395 and retest.
Buy Zone #2 (Backup): 3,350–3,360
For a deeper pullback—untested H4 demand.
Sell Zone: 3,420–3,438
Confluence: unfilled H4 FVG + premium supply
Fade only on clear M15 rejection (pin‑bar/engulf).
Decision Pivot: 3,395
Above = bullish continuation; below = stand aside.
➡️ ACTION PLAN
Longs: Enter on M15 close above 3,395 and retest; targets at 3,420 then 3,438.
Shorts: Only on rally into 3,420–3,438 with a decisive rejection candle.
Invalidation: A sustained break below 3,380 warns of a deeper flush toward 3,350–3,360.
🚀 CALL TO ACTION
If this nailed your edge, smash that Like, Follow @GoldFxMinds for daily sniper updates, and Boost this post so your fellow traders don’t miss these live levels! Drop a 🔥 if you’re ready to strike the next move.
Disclosure: I’m part of TradeNation’s Influencer program and receive a monthly fee for using their chart feed.
— GoldFxMinds

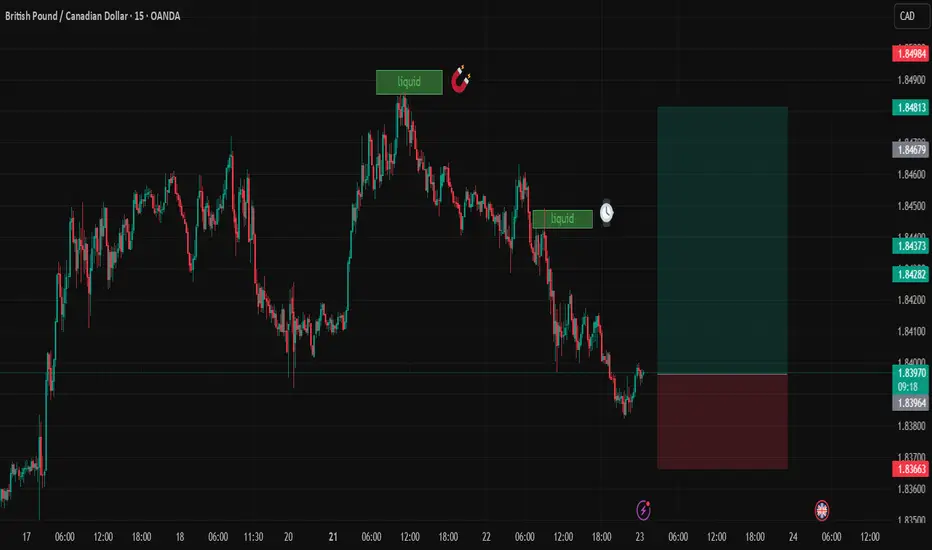
GBPCADDate:
July 23,2025
Session:
Tokyo and London session
Pair:
GBPCAD
Bias:
Long
2 liquidity pools that are waiting to be swept this week. Looks like price is gonna be magnetized towards these levels during London and Tokyo. The trade may even stretch into NYC.
Entry: 1.83970
Stop Loss: 1.83674
Target: 1.84811
RR: 2.82
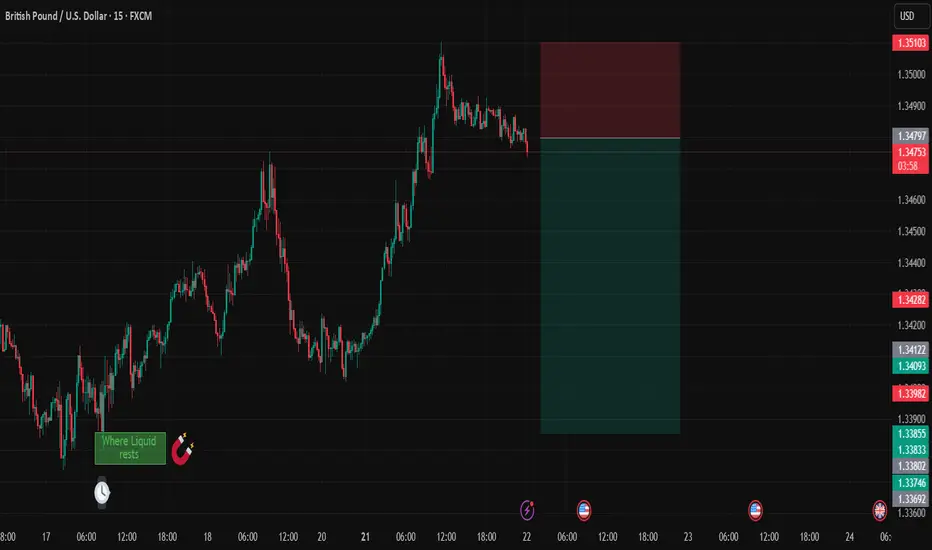
GBPUSDDate:
July 22,2025
Session:
Tokyo and London session
Pair:
GBPUSD
Bias:
Short
Price is setting up to target where liquid rests from last weeks London open on Thursday. Price action shows exhaustion after NYC and London liquidity grab.
Entry:1.34795
Stop Loss:1.35103
Target:1.33853
RR:3.08
USDCAD: Long Trading Opportunity
USDCAD
- Classic bullish pattern
- Our team expects retracement
SUGGESTED TRADE:
Swing Trade
Buy USDCAD
Entry - 1.3618
Stop - 1.3586
Take - 1.3685
Our Risk - 1%
Start protection of your profits from lower levels
Disclosure: I am part of Trade Nation's Influencer program and receive a monthly fee for using their TradingView charts in my analysis.
❤️ Please, support our work with like & comment! ❤️

EURUSD: Short Trade Explained
EURUSD
- Classic bearish setup
- Our team expects bearish continuation
SUGGESTED TRADE:
Swing Trade
Short EURUSD
Entry Point - 1.1727
Stop Loss - 1.1759
Take Profit - 1.1661
Our Risk - 1%
Start protection of your profits from lower levels
Disclosure: I am part of Trade Nation's Influencer program and receive a monthly fee for using their TradingView charts in my analysis.
❤️ Please, support our work with like & comment! ❤️

EURNZD: Bulls Will Push Higher
Our strategy, polished by years of trial and error has helped us identify what seems to be a great trading opportunity and we are here to share it with you as the time is ripe for us to buy EURNZD.
Disclosure: I am part of Trade Nation's Influencer program and receive a monthly fee for using their TradingView charts in my analysis.
❤️ Please, support our work with like & comment! ❤️

EURGBP: Will Keep Growing! Here is Why:
The recent price action on the EURGBP pair was keeping me on the fence, however, my bias is slowly but surely changing into the bullish one and I think we will see the price go up.
Disclosure: I am part of Trade Nation's Influencer program and receive a monthly fee for using their TradingView charts in my analysis.
❤️ Please, support our work with like & comment! ❤️

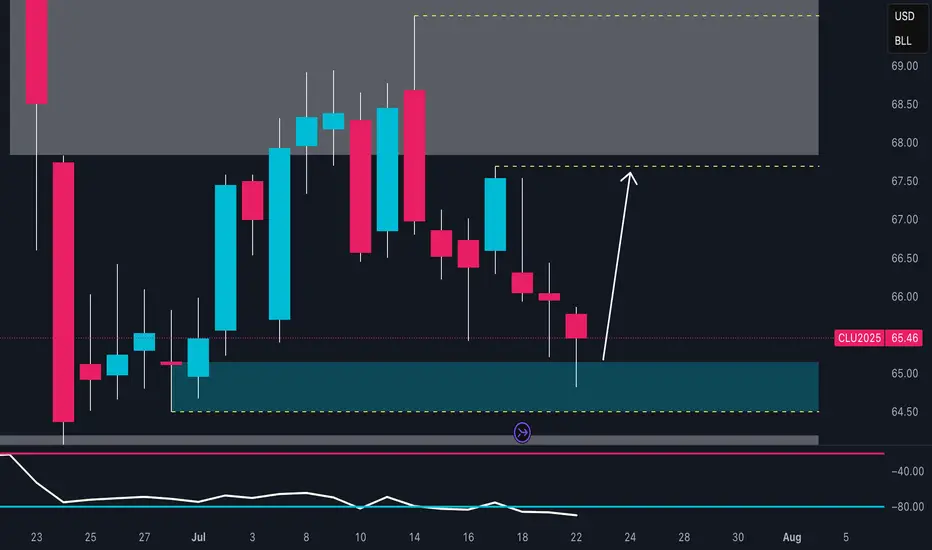
USOIL POTENTIAL LONG|
✅CRUDE OIL has retested a key support level of 65.00$
And as the pair is already making a bullish rebound
A move up to retest the supply level above at 66.27$ is likely
LONG🚀
✅Like and subscribe to never miss a new idea!✅
Disclosure: I am part of Trade Nation's Influencer program and receive a monthly fee for using their TradingView charts in my analysis.

SILVER Bullish Breakout! Buy!
Hello,Traders!
SILVER is trading in a strong
Uptrend and the price made a
Bullish breakout of the key
Horizontal level of 39.10$
So we are bullish biased
And we will be expecting a
Further bullish move up
Buy!
Comment and subscribe to help us grow!
Check out other forecasts below too!
Disclosure: I am part of Trade Nation's Influencer program and receive a monthly fee for using their TradingView charts in my analysis.

GOLD SHORT FROM RESISTANCE|
✅GOLD is set to retest a
Strong resistance level above at 3450$
After trading in an uptrend for some time
Which makes a bearish pullback a likely scenario
With the target being a local support below at 3414$
SHORT🔥
✅Like and subscribe to never miss a new idea!✅
Disclosure: I am part of Trade Nation's Influencer program and receive a monthly fee for using their TradingView charts in my analysis.

AUD-JPY Will Grow! Buy!
Hello,Traders!
AUD-JPY already made a
Bullish rebound from the
Strong horizontal support
Of 95.610 and as we are
Bullish biased we will be
Expecting a further bullish
Move up
Buy!
Comment and subscribe to help us grow!
Check out other forecasts below too!
Disclosure: I am part of Trade Nation's Influencer program and receive a monthly fee for using their TradingView charts in my analysis.

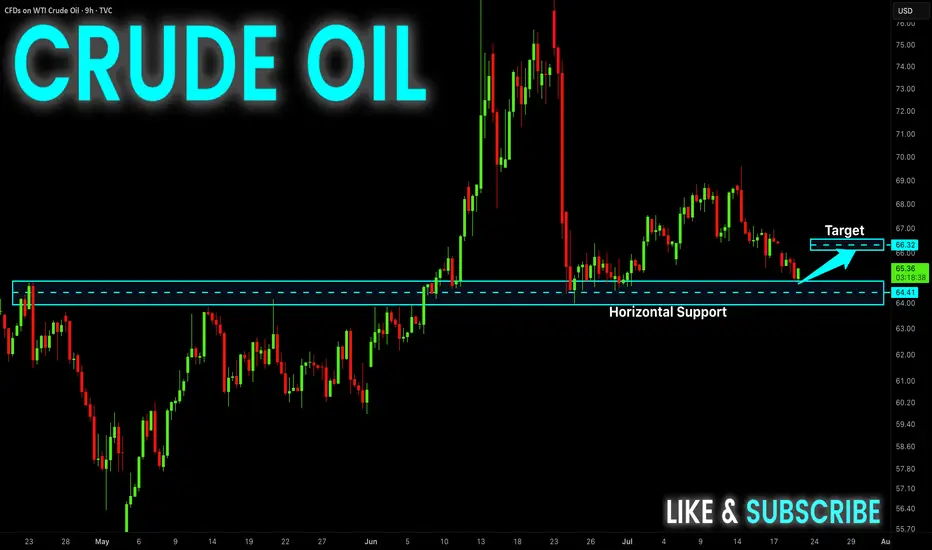
Crude Oil Rebound Incoming? Key Demand Zone 📈 1. Technical Analysis – Daily Chart (CL1!)
The price has returned to a demand zone between 64.60 and 65.30, an area that previously triggered strong bullish reactions.
The July 22nd candle shows a clear lower wick, indicating potential buyer absorption and a possible short-term reversal.
The next key resistance lies between 67.80 and 68.80, which aligns with a well-defined supply zone.
Daily RSI remains weak but shows signs of bullish divergence, suggesting potential accumulation.
Bias: bullish from current levels, targeting 67.50 – 68.00. Invalidation on a daily close below 64.40.
2. Institutional Sentiment – COT Report (CFTC, July 15, 2025)
Non-Commercials (Speculators)
Long: 308,915 (↓ -24,223)
Short: 146,488 (↑ +22,724)
Net Position: sharply declining → bearish divergence in speculative sentiment
Commercials (Hedgers)
Long: 857,803 (↑ +66,342)
Short: 1,046,199 (↑ +18,118)
Net Position: still negative, but improving → reduced hedging = less downside pressure
📉 Interpretation:
Funds are closing longs and adding shorts, showing bearish positioning. However, commercials are slowly reducing their hedging exposure, which could indicate short-term stabilization if the technical support holds.
3. Seasonality
Periods analyzed: 20, 15, 10, 5, and 2 years
July historically shows negative average returns:
-0.71% (20Y)
-1.26% (15Y)
-1.37% (10Y)
The seasonal pattern indicates continued cyclical weakness into August.
📌 Interpretation:
The summer period typically brings seasonal bearish pressure, which aligns with current 2025 performance.
🌐 4. Macro & Fundamentals
EIA inventory builds for 3 consecutive weeks → demand weakness in the U.S.
No additional OPEC+ cuts announced → supply remains ample
Stable inflation data in the U.S. and China → no uptick in energy demand
Overall macro data is neutral with a slightly bearish short-term bias
NZD_USD BULLISH BREAKOUT|LONG|
✅NZD_USD is going up
Now and the pair made a bullish
Breakout of the key horizontal
Level of 0.5980 and the breakout
Is confirmed so we are bullish
Biased and we will be expecting
A further bullish move up
LONG🚀
✅Like and subscribe to never miss a new idea!✅
Disclosure: I am part of Trade Nation's Influencer program and receive a monthly fee for using their TradingView charts in my analysis.

USOIL Long From Support! Buy!
Hello,Traders!
USOIL made a retest of
The horizontal support
Level of 64.86$ from where
We are already seeing a bullish
Reaction so we will be expecting
A further local move up
Buy!
Comment and subscribe to help us grow!
Check out other forecasts below too!
Disclosure: I am part of Trade Nation's Influencer program and receive a monthly fee for using their TradingView charts in my analysis.
USDJPYDate:
July 22,2025
Session:
Tokyo and London session
Pair:
USDJPY
Bias:
Long
1. Clean liquidity pool left unswept from last week's NYC Open (Thursday).
Took this trade earlier today but looks like price wanted to consolidate in the liquid pool its currently in. I still hold the same idea and think the sweep will definitely take place sometime this week. Now looks like the perfect time to enter. If Asia session cant get it done its up to London and New York session.
Entry:147.534
Stop Loss:147.215
Target:148.768
RR:3.89

NZDJPY: Long Trade Explained
NZDJPY
- Classic bullish setup
- Our team expects bullish continuation
SUGGESTED TRADE:
Swing Trade
Long NZDJPY
Entry Point - 87.616
Stop Loss - 87.361
Take Profit - 88.064
Our Risk - 1%
Start protection of your profits from lower levels
Disclosure: I am part of Trade Nation's Influencer program and receive a monthly fee for using their TradingView charts in my analysis.
❤️ Please, support our work with like & comment! ❤️
