GBP_AUD BEARISH BIAS|SHORT|
✅GBP_AUD is going up to retest
A horizontal resistance of 2.0892
Which makes me locally bearish biased
And I think that we will see a pullback
And a move down from the level
Towards the target below at 2.0805
SHORT🔥
✅Like and subscribe to never miss a new idea!✅
Disclosure: I am part of Trade Nation's Influencer program and receive a monthly fee for using their TradingView charts in my analysis.
Smartmoneyconcept

EUR_AUD LOCAL CORRECTION|SHORT|
✅EUR_AUD is set to retest a
Strong resistance level above at 1.8020
After trading in a local uptrend for some time
Which makes a bearish pullback a likely scenario
With the target being a local support below at 1.7940
SHORT🔥
✅Like and subscribe to never miss a new idea!✅
Disclosure: I am part of Trade Nation's Influencer program and receive a monthly fee for using their TradingView charts in my analysis.

EUR-GBP Will Grow! Buy!
Hello,Traders!
EUR-GBP keeps trading in
A strong uptrend and the
Pair made a retest and a
Rebound from the horizontal
Support level around 0.8621
So we are bullish biased and
We will be expecting a
Further bullish move up
Buy!
Comment and subscribe to help us grow!
Check out other forecasts below too!
Disclosure: I am part of Trade Nation's Influencer program and receive a monthly fee for using their TradingView charts in my analysis.

AMAZON Will Keep Growing! Buy!
Hello,Traders!
AMAZON is trading in an
Uptrend and the stock made
A breakout and retest of the
Key horizontal support
Of 218$ and is going up again
So we are bullish biased
And we will be expecting
A further bullish move up
Buy!
Comment and subscribe to help us grow!
Check out other forecasts below too!
Disclosure: I am part of Trade Nation's Influencer program and receive a monthly fee for using their TradingView charts in my analysis.

SILVER RESISTANCE AHEAD|SHORT|
✅SILVER has been growing recently
And the pair seems locally overbought
So as the pair is approaching a
Horizontal resistance of 3730$
Price decline is to be expected
SHORT🔥
✅Like and subscribe to never miss a new idea!✅
Disclosure: I am part of Trade Nation's Influencer program and receive a monthly fee for using their TradingView charts in my analysis.

TESLA: Bulls Will Push
The price of TESLA will most likely increase soon enough, due to the demand beginning to exceed supply which we can see by looking at the chart of the pair.
Disclosure: I am part of Trade Nation's Influencer program and receive a monthly fee for using their TradingView charts in my analysis.
❤️ Please, support our work with like & comment! ❤️

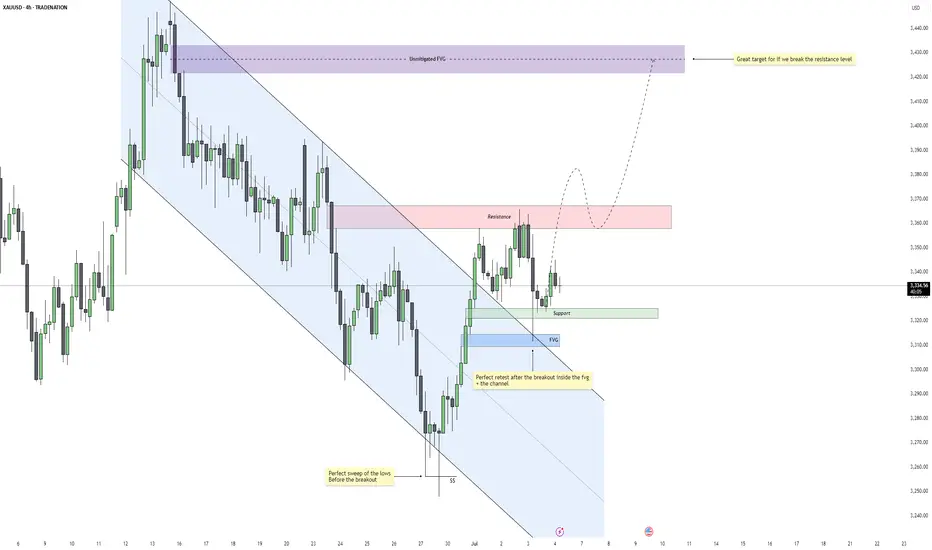
Gold – Is $3430 the Next Target After This Breakout?Gold recently completed a clean sweep of the 4H swing lows, taking out downside liquidity just before breaking out of a well-defined descending channel. This move marked a shift in momentum and structure, suggesting that the bearish leg may have concluded and the market is now transitioning into a more bullish phase.
Breakout Confirmation and Retest Zone
Following the breakout, price retraced and tapped directly into a confluence area where a fair value gap aligns with the upper boundary of the broken channel. This acted as a high-probability retest zone, and the reaction was strong. The market respected this structure perfectly, adding conviction to the breakout's validity.
Support and Resistance Dynamics
Currently, price is hovering between a nearby support level and a short-term resistance zone above. The support is holding firm after the retest, while the resistance is capping upward momentum for now. This is a healthy consolidation following the breakout, and it provides a clear structure for monitoring continuation.
Imbalance Target and Flow Outlook
Should the market gain enough strength to break through the overhead resistance, there is a large unmitigated imbalance further above that stands as a strong magnet. It represents a clean fair value gap left behind during the previous selloff and could be the next major draw if bullish momentum continues.
Overall Flow and Trade Logic
The sequence is very clean: sweep of liquidity, bullish breakout, efficient retest, and now consolidation above support. As long as price continues to form higher lows and respect the current structure, the probability of further upside remains favorable. Patience around the resistance area will be key for confirmation.
Conclusion
Gold is displaying a textbook reversal setup driven by liquidity and structure. If the current support continues to hold and buyers reclaim control above resistance, the path toward the upper imbalance becomes highly probable. The market is aligned for continuation, with bullish momentum building gradually.
Disclosure: I am part of Trade Nation's Influencer program and receive a monthly fee for using their TradingView charts in my analysis.
___________________________________
Thanks for your support!
If you found this idea helpful or learned something new, drop a like 👍 and leave a comment, I’d love to hear your thoughts! 🚀
CAD-CHF Local Long! Buy!
Hello,Traders!
CAD-CHF made a retest
Of the horizontal support
Of 0.5832 so we are locally
Bullish biased and we will be
Expecting a local bullish move up
Buy!
Comment and subscribe to help us grow!
Check out other forecasts below too!
Disclosure: I am part of Trade Nation's Influencer program and receive a monthly fee for using their TradingView charts in my analysis.

GBP-AUD Short From Resistance! Sell!
Hello,Traders!
GBP-AUD made a retest of
The horizontal resistance
Around 2.0800 from where
We will be expecting a
Local bearish move down
Sell!
Comment and subscribe to help us grow!
Check out other forecasts below too!
Disclosure: I am part of Trade Nation's Influencer program and receive a monthly fee for using their TradingView charts in my analysis.

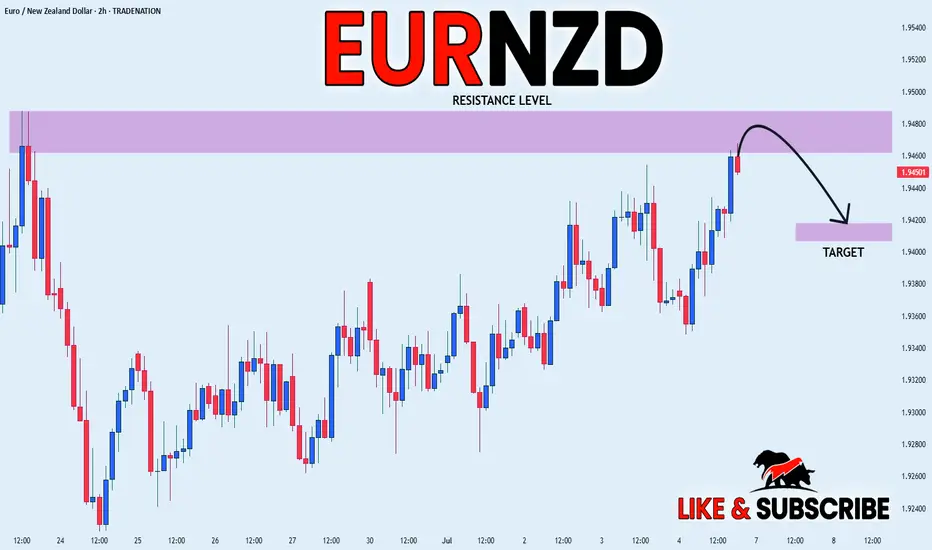
EUR_NZD LOCAL SHORT|
✅EUR_NZD is set to retest a
Strong resistance level above at 1.9488
After trading in a local uptrend for some time
Which makes a bearish pullback a likely scenario
With the target being a local support below at 1.9420
SHORT🔥
✅Like and subscribe to never miss a new idea!✅
Disclosure: I am part of Trade Nation's Influencer program and receive a monthly fee for using their TradingView charts in my analysis.
USD-CAD Local Rebound! Buy!
Hello,Traders!
USD-CAD is trading in a
Strong downtrend but
The pair made a retest
Of the horizontal support
Level of 1.3540 from where
We are already seeing a
Bullish rebound and we
Will be expecting a
Further move up
Buy!
Comment and subscribe to help us grow!
Check out other forecasts below too!
Disclosure: I am part of Trade Nation's Influencer program and receive a monthly fee for using their TradingView charts in my analysis.

Bitcoin – ATH Sweep or Breakout?Bitcoin is pushing into a critical decision point as it challenges the previous all-time high near 110k. After a strong push out of a rounded bottom formation with clean higher lows, price has now broken above the last visible resistance area and is hovering just under the ATH liquidity. This rally has been aggressive, but the reaction here will determine whether this move becomes an extended breakout or a classic trap.
Liquidity and Key Resistance
The ATH zone around 110k carries a large pool of liquidity, and price is now testing it for the first time since the breakout. We’ve already had a clean break above the prior resistance zone, but we haven’t yet seen a confirmed close above ATH with convincing volume. If price manages to close strongly above this level on the 4H or daily chart, that would be a sign that bulls are in full control. Until then, the possibility of a sweep and rejection remains firmly on the table.
Sweep Scenario and Downside Levels
If we fail to close convincingly above the ATH and instead see a wick through followed by a strong reversal, that would confirm the sweep. In that case, I’d expect short setups to activate quickly, with downside targets sitting around 105k. This level marks the structure support below the most recent breakout, and would be a logical point for price to rebalance before continuing any broader uptrend. A rejection from current levels would also trap late longs and provide fuel for a quick retracement.
Bullish Breakout Scenario
If we do get that proper breakout above 110k, backed by strong volume and continuation candles, the upside opens fast. There’s very little structure above the ATH, so price could move cleanly up into the next round psychological target around 115k. This move would confirm continuation of the higher timeframe trend and offer short-term breakout retests for potential long re-entries.
Volume and Candle Confirmation Are Crucial
At this stage, the setup is binary and all about confirmation. A clean 4H or daily close above ATH with follow-through volume will flip the bias fully bullish. But if we get signs of exhaustion and a failed breakout attempt, the sweep setup becomes highly probable. Waiting for confirmation here is key, rather than trying to front-run the move.
Conclusion
Bitcoin is sitting right at a high-stakes level. We either continue into price discovery toward 115k if momentum follows through, or we see a classic liquidity sweep and rejection back into 105k. The clean structure and recent higher lows support both sides of the argument, but execution will depend on how price reacts around the ATH. Either way, this zone is the key pivot for the next major swing.
Disclosure: I am part of Trade Nation's Influencer program and receive a monthly fee for using their TradingView charts in my analysis.
___________________________________
Thanks for your support!
If you found this idea helpful or learned something new, drop a like 👍 and leave a comment, I’d love to hear your thoughts! 🚀

EURJPY Weekly Analysis (MMC + SMC) - Trend Expansion + Target🧠 Contextual Overview:
EURJPY has been on a strong long-term bullish rally, fueled by institutional demand and consistent volume expansion patterns. This pair is approaching a critical macro resistance/reversal zone around the 175–176 level, where historically large players have shown interest in redistributing or taking profit.
This analysis uses the MMC (Market Mechanics Concept) integrated with SMC (Smart Money Concepts) to provide a complete perspective on price structure, order flow, and volume behavior.
📊 Structural Breakdown:
🔹 1. Volume Expansion as a Leading Indicator
Volume precedes price — this is a foundational MMC principle.
The recent aggressive impulse to the upside is backed by clear volume expansion visible on higher time frames.
This type of movement indicates smart money accumulation and commitment, rather than retail-driven volatility.
A key insight: Volume Expansion typically signals trend continuation, not reversal—unless a liquidity grab or divergence shows up in reversal zones.
🔹 2. Break of Structure (BOS) Confirms Trend Continuation
A clear BOS occurred when price violated previous swing highs around the 165–167 range.
This BOS suggests a new bullish leg is forming, confirming the market has transitioned from consolidation (accumulation) to distribution (markup phase).
🔹 3. Current Price Path: Heading into a Key Reversal Zone (175–176)
This zone has been mapped based on previous supply imbalances and historical resistance.
Price may tap into this zone before we see either:
A clean continuation above (indicating absorption of supply), or
A rejection or smart money sell-off pattern (distribution, divergence, or exhaustion candles).
Institutions tend to execute significant moves in these areas — watch for liquidity sweep traps and break-of-structure (BOS) on lower timeframes for confirmation.
🧱 Support Zones & Safety Net:
🔸 Major Support: 155–157 Zone
This is a historically significant demand block, respected multiple times since 2023.
A drop into this region could offer a prime long-term swing entry, should price reject the reversal zone.
Also acts as invalidity for current bullish structure. A weekly close below this would signal a potential trend shift or deeper correction.
📉 Technical Patterns & Confluences:
Trendline Breakout + Retest occurred from 2024 into early 2025. This is a classic break-and-retest continuation pattern, confirming bullish interest from smart money.
Price consolidated (reaccumulation) and exploded upward with volume expansion, aligning with Wyckoff theory’s markup phase.
Strong candles with minimal upper wicks = clear sign of institutional commitment.
🎯 Trade Strategy & Scenarios:
🟢 Bullish Continuation Scenario:
If price breaks above 176.000 with volume and closes weekly bullish, expect continuation toward 180.00+ in coming months.
Watch for:
Clean BOS above the reversal zone
Volume expansion confirmation
Retest of breakout level (176–174) for safe re-entry
🔴 Bearish Rejection Scenario:
If price rejects the reversal zone with bearish engulfing or divergence, expect a retracement back toward 165–162 short-term, and possibly 157–155 long-term.
Lower time frame structure shift (BOS to the downside) will confirm early exit from bulls or reversal setups for bears.
🧠 Psychological Perspective:
Smart Money uses reversal zones to entice late buyers before triggering liquidity grabs.
Reversal zones serve as liquidity magnets, often leading to false breakouts before true direction is revealed.
Retail traders often buy into strength at these levels, providing liquidity for institutional exits.
📌 Summary:
✅ Trend: Strong bullish
✅ Structure: Clean BOS with volume confirmation
✅ Next Key Level: 175–176 (Reversal Zone)
✅ Strategy: Monitor for rejection/continuation; align with volume + structure
✅ Volume Behavior: Expansion supports trend continuation
🔖 Final Thoughts:
The EURJPY pair presents a highly educational and strategic opportunity. Whether you trade intraday or swing, this zone (175–176) will define the market direction for the next few months. Use volume, structure shifts, and institutional behavior to guide your trades, not just candlestick patterns.

GOLD (XAUUSD) 4H Technical Analysis – Channel Breakout & Target🧠 Executive Summary:
The GOLD market has completed a key structural shift following a successful bearish trendline breakout, and is now trading within a well-formed ascending price channel. Price action has recently bounced from the channel support area, which aligns closely with a retested zone that was previously resistance. All signs now point to a potential continuation of the bullish leg—but only if the current structure holds.
This analysis outlines the technical foundation, key trading zones, price action psychology, and risk management factors that define this setup.
🔍 Technical Breakdown
🔸 1. Trendline Breakout – The Structural Shift
The bearish trendline, which previously capped multiple upside moves throughout June, has finally been broken.
The breakout was accompanied by higher volume and larger bullish candles, indicating momentum.
After the breakout, price pulled back near the trendline and respected the newly flipped support zone.
This forms a classic Breakout–Retest–Continuation pattern, one of the most reliable in trend reversal scenarios.
🔸 2. Formation of Ascending Channel – A New Bullish Structure
After the breakout, price action established a consistent pattern of higher highs and higher lows, confirming the birth of a new ascending channel.
The channel support (around 3,320–3,330) has been tested multiple times and held strong.
The channel resistance lies between 3,390–3,400, which is now the next short-term target if bulls maintain control.
The channel offers both trend direction and entry timing opportunities as price bounces between its boundaries.
🔸 3. Retest Zone – Buyer’s Territory
The price is currently bouncing off the mid-channel zone, where the previous downtrend resistance overlaps with current channel support.
This confluence area is where smart money often enters after institutional accumulation at the base (around 3,270).
The bullish wick rejections around this zone signal a likely continuation toward the upper channel.
📈 Price Behavior & Market Psychology
What’s happening here isn't just lines and candles—there’s a psychological story unfolding:
Fear drove the market lower, respecting the bearish trendline until late June.
Hope and buyer aggression surged once the breakout confirmed.
Now we’re in the "belief" phase, where traders await confirmation of the new trend.
Many are watching for entry confirmation at support zones, and as long as fear doesn’t return (i.e., price breaking below 3,320), the structure remains valid.
🧭 Key Technical Levels to Watch
Level Type Price Range Notes
Major Support Zone 3,270–3,285 Key buyer zone, invalidation of bullish case below this
Channel Support 3,320–3,330 Retest zone after breakout, current active level
Mid-Channel Area 3,350–3,360 Decision zone – price may build momentum here
Channel Resistance 3,390–3,400 First bullish target, potential breakout area
Breakout Target 3,420–3,440 If price breaks channel resistance with volume
🧮 Trade Setup Ideas (Educational – Not Financial Advice)
🟢 Long Setup Option 1:
Entry: Upon confirmation above 3,340–3,345 with bullish engulfing candle or breakout bar.
Stop-Loss: Below 3,320 or slightly below channel support.
Take Profit: Partial at 3,390 (channel top), full at 3,420–3,440 breakout zone.
R:R Ratio: 1:2.5+ (highly favorable)
🔴 Bearish Scenario (Risk Management)
If price closes below 3,320 with momentum, expect a revisit to the 3,270–3,285 support.
This invalidates the current bullish channel structure and might bring in short-term bearish pressure.
Avoid long positions until new structure is formed.
🧠 Educational Takeaway for Traders
This analysis highlights the importance of:
Structure-based entries: Instead of chasing candles, you wait for confluence and entry triggers.
Multiple timeframe confirmation: Higher timeframes also show bullish bias, giving confidence to 4H trades.
Risk management: The current setup allows tight stop losses relative to potential reward, making it attractive.
By combining trendline breakouts, channel formations, and support/resistance flips, you significantly increase the probability of a successful trade.
📌 Final Thoughts:
Gold is giving traders a clean and structured opportunity. The market has shown strength through structure, not just random price spikes. With the ascending channel intact and price respecting support zones, there is a solid foundation for a bullish continuation toward 3,400 and beyond.
But as always, confirmation is key. Wait for price action to validate your bias, and never ignore risk management.

US30 SHORT FROM RESISTANCE|
✅DOW JONES is going up now
But a strong resistance level is ahead at 45,077
Thus I am expecting a pullback
And a move down towards the target of 44,500
SHORT🔥
✅Like and subscribe to never miss a new idea!✅
Disclosure: I am part of Trade Nation's Influencer program and receive a monthly fee for using their TradingView charts in my analysis.

AUD_JPY RISKY SHORT|
✅AUD_JPY is set to retest a
Strong resistance level above at 95.600
After trading in a local uptrend for some time
Which makes a bearish pullback a likely scenario
With the target being a local support below at 95.081
SHORT🔥
✅Like and subscribe to never miss a new idea!✅
Disclosure: I am part of Trade Nation's Influencer program and receive a monthly fee for using their TradingView charts in my analysis.

SILVER Short From Resistance! Sell!
Hello,Traders!
SILVER is trading in an
Uptrend but the price will
Soon hit a horizontal resistance
Area around 37,32$ from
Where we will be expecting
A local bearish correction
Sell!
Comment and subscribe to help us grow!
Check out other forecasts below too!
Disclosure: I am part of Trade Nation's Influencer program and receive a monthly fee for using their TradingView charts in my analysis.

GBP_CAD BEARISH BREAKOUT|SHORT|
✅GBP_CAD broke the key structure level of 1.8580
While trading in an local downtrend
Which makes me bearish
And as the retest of the level is complete
Bearish continuation will follow
SHORT🔥
✅Like and subscribe to never miss a new idea!✅
Disclosure: I am part of Trade Nation's Influencer program and receive a monthly fee for using their TradingView charts in my analysis.

EUR-AUD Bearish Breakout! Sell!
Hello,Traders!
EUR-AUD was trading along
The rising support line but
Now we are seeing a bearish
Breakout so we are bearish
Biased and we will be expecting
A further bearish move down
Sell!
Comment and subscribe to help us grow!
Check out other forecasts below too!
Disclosure: I am part of Trade Nation's Influencer program and receive a monthly fee for using their TradingView charts in my analysis.

EURUSD – Bearish Reversal Confirmed After Structural BreakEURUSD has shifted out of its bullish environment after a sustained rally inside a clean ascending channel. Price recently rejected a resistance zone that capped previous buying pressure and has now started to rotate downward. This marks the first serious challenge to the trend and sets the tone for a potential bearish phase.
Channel Breakdown and Price Behavior
The ascending channel had been respected for several sessions, guiding price upward with consistent higher highs and higher lows. The recent breakdown from this structure is significant, as it shows the market is no longer willing to support higher prices within that controlled environment. This type of breakout often signals a loss of momentum and increased volatility in the opposite direction.
Break of the Low and Shift in Structure
After breaking the channel, price also took out a major internal low, which had previously held during retracements. This is a key signal of a structural shift, confirming that the uptrend has been interrupted. When price breaks a low that buyers had been defending, it shows sellers have stepped in with conviction and are likely aiming lower targets.
Short-Term Target and Reaction Zone
The first area of interest sits just below current price where a support shelf and price inefficiencies line up. This zone, marked with the dollar sign symbol on the chart, may attract a short-term reaction. If buyers are still present, this is where they would likely try to step in. However, the rejection from resistance and the structural break suggest this level could eventually give way.
Imbalance Zone Below and Liquidity Target
If that support fails, the next high-probability draw is the large untested imbalance sitting further below. This zone has remained untouched since the rally began and represents unfinished business for the market. Price often seeks out these inefficiencies, especially after trend shifts, making it a natural target for sellers if momentum continues.
Conclusion
EURUSD is showing clear signs of bearish pressure after rejecting resistance, breaking structure, and leaving behind unmitigated downside targets. As long as we remain below the broken low, the path of least resistance points lower. The imbalance zone below remains the key destination unless the market shows signs of reversal higher.
Disclosure: I am part of Trade Nation's Influencer program and receive a monthly fee for using their TradingView charts in my analysis.
___________________________________
Thanks for your support!
If you found this idea helpful or learned something new, drop a like 👍 and leave a comment, I’d love to hear your thoughts! 🚀

EUR_GBP BULLISH BIAS|LONG|
✅EUR_GBP broke the key
Structure level of 0.8620
While trading in an local uptrend
Which makes me bullish
And I think that after the retest
Of the broken level is complete
A rebound and bullish continuation will follow
LONG🚀
✅Like and subscribe to never miss a new idea!✅
Disclosure: I am part of Trade Nation's Influencer program and receive a monthly fee for using their TradingView charts in my analysis.

AUD-USD Very Strong Uptrend! Buy!
Hello,Traders!
AUD-USD is trading in a
Very strong uptrend and
The pair broke a key horizontal
Level around 0.6540 which
Is now a support and we
Are already seeing a rebound
So we are bullish biased
And we will be expecting
A further move up
Buy!
Comment and subscribe to help us grow!
Check out other forecasts below too!
Disclosure: I am part of Trade Nation's Influencer program and receive a monthly fee for using their TradingView charts in my analysis.

BITCOIN STRONG RESISTANCE AHEAD|SHORT|
✅BITCOIN is going up now
But a strong resistance level is ahead at 112,000$
Which is also an All-Time-High
Thus I am expecting a pullback
And a move down towards the target of 107,300$
SHORT🔥
✅Like and subscribe to never miss a new idea!✅
Disclosure: I am part of Trade Nation's Influencer program and receive a monthly fee for using their TradingView charts in my analysis.
