AUD_JPY MOVE DOWN AHEAD|SHORT|
✅AUD_JPY made a retest of
The strong horizontal resistance of 93.900
Level of 106.083 and as you
Can see the pair is already
Making a local pullback from
The level which sends a clear
Bearish signal to us therefore
We will be expecting a
Further bearish correction
SHORT🔥
✅Like and subscribe to never miss a new idea!✅
Disclosure: I am part of Trade Nation's Influencer program and receive a monthly fee for using their TradingView charts in my analysis.
Smartmoneyconcept

AUD-CHF Pullback Ahead! Sell!
Hello,Traders!
AUD-CHF made a retest
Of the strong wide horizontal
Resistance around 0.5289
And we are already seeing a
Local pullback so we are
Locally bearish biased and
We will be expecting a
Further bearish move down
On Monday
Sell!
Comment and subscribe to help us grow!
Check out other forecasts below too!
Disclosure: I am part of Trade Nation's Influencer program and receive a monthly fee for using their TradingView charts in my analysis.

NZD_CAD REBOUND AHEAD|LONG|
✅NZD_CAD is set to retest a
Strong support level below at 0.8160
After trading in a local downtrend for some time
Which makes a bullish rebound a likely scenario
With the target being a local resistance above at 0.8182
LONG🚀
✅Like and subscribe to never miss a new idea!✅
Disclosure: I am part of Trade Nation's Influencer program and receive a monthly fee for using their TradingView charts in my analysis.

NATGAS Growth Ahead! Buy!
Hello,Traders!
NATGAS made a retest of
The horizontal support level
Of 3.450$ then established
A double bottom pattern
And a we are already
Seeing some rebound so
We are locally bullish biased
And we will be expecting a
Further bullish move up
On Monday
Buy!
Comment and subscribe to help us grow!
Check out other forecasts below too!
Disclosure: I am part of Trade Nation's Influencer program and receive a monthly fee for using their TradingView charts in my analysis.

Bitcoin - Bears vs Bulls: $100k next?Price recently tapped into a well-defined 4H and daily resistance zone and was met with an immediate rejection. That rejection wasn’t just a reaction, it led to a confirmed market structure shift as price broke the previous low. This transition from higher highs to a lower low signals the first sign of bearish control, flipping the short-term bias and setting the tone for a move lower.
Retest of MSS and Inversion Fair Value Gap
After the break in structure, price retraced directly into the origin of the move, retesting the same zone where the shift occurred. A previously bullish 4H gap has now flipped into resistance, rejecting price perfectly. This inversion, where a bullish imbalance turns into a bearish reaction zone, confirms the change in direction and strengthens the downside narrative.
New FVG as Entry Opportunity
The latest bearish impulse created a clean new fair value gap just above current price. A retest of this gap would offer a high-probability continuation setup, as it aligns with both recent structure and order flow. This zone becomes the critical level for bears to defend, and unless price reclaims it, the expectation remains for continuation toward lower liquidity.
Liquidity Outlook and Bearish Target
Below current price, a large pool of liquidity is sitting just above a major psychological round number. That level hasn’t been swept yet and is a likely downside magnet. With no meaningful support between the current FVG and that draw on liquidity, price is likely to reach for it next. This fits the typical sequence following a market structure shift: rejection, shift, retest, continuation, and liquidity sweep.
Momentum and Contextual Confluence
Zooming out slightly, the current move fits within broader bearish momentum that has been developing across timeframes. There’s no sign of strong bullish absorption, and each push higher has been met with efficient selling. This isn’t a chaotic breakdown, but a controlled sequence of lower highs and lower lows, supported by clean structural shifts and consistent rejection zones.
Conclusion
The chart tells a clear story. A clean rejection from a key resistance zone led to a confirmed bearish structure shift, followed by a textbook retest and fresh fair value gap. As long as price remains below that gap, the setup favors continuation lower, with the nearest liquidity pool being the most likely draw. This remains a high-probability bearish scenario until proven otherwise by a shift back above invalidation levels.
___________________________________
Thanks for your support!
If you found this idea helpful or learned something new, drop a like 👍 and leave a comment, I’d love to hear your thoughts! 🚀

TESLA WILL GO DOWN|SHORT|
✅TESLA is going up now
But a strong resistance level is ahead at 336$
Thus I am expecting a pullback
And a move down towards the target of 320$
SHORT🔥
✅Like and subscribe to never miss a new idea!✅
Disclosure: I am part of Trade Nation's Influencer program and receive a monthly fee for using their TradingView charts in my analysis.

CAD_CHF SHORT FROM RESISTANCE|
✅CAD_CHF has retested a key resistance level of 0.5990
And as the pair is already making a bearish pullback
A move down to retest the demand level below at 0.5960 is likely
SHORT🔥
✅Like and subscribe to never miss a new idea!✅
Disclosure: I am part of Trade Nation's Influencer program and receive a monthly fee for using their TradingView charts in my analysis.

NZD-CAD Free Signal! Buy!
Hello,Traders!
NZD-CAD is about to retest
A horizontal support level
Of 0.8161 from where we
Will be expecting a local
Bullish rebound so we can
Enter a long trade with the
Take Profit of 0.8191 and
The Stop Loss of 0.8153
Buy!
Comment and subscribe to help us grow!
Check out other forecasts below too!
Disclosure: I am part of Trade Nation's Influencer program and receive a monthly fee for using their TradingView charts in my analysis.

Every breakdown is just a setup — if you know where the reaccumuPrice collapsed. But I didn’t flinch. Because beneath that move sits something most won’t look for: High-Volume Rebalancing (H RB), paired with a clean FVG structure that tells me exactly where Smart Money wants to reload.
The structure:
The breakdown into ~2483 wasn’t just a move — it was intentional. That candle didn’t just fall, it delivered into the H RB zone and paused. Below that? Nothing but inefficient space and a tightly engineered low.
Above? Three clear target zones:
TP1: 2528
TP2 : 2582
TP3: 2656
Final objective: 2762 — the origin of the final collapse
Every leg above is engineered to grab liquidity, rebalance inefficiency, and then clear out the next range. It’s a chain of fulfillment.
The trade:
Entry: 2483–2500 zone
SL: Below the H RB zone (~2470)
TP1: 2528
TP2: 2582
TP3: 2656
Optional extension: 2762
We aren’t buying because it’s “down.” We’re executing because it’s deliberate.
Final thought:
“Collapse isn’t the end. It’s the invitation.”

AUD_CHF LOCAL SHORT|
✅AUD_CHF has retested a resistance level of 0.5290
And we are seeing a bearish reaction
With the price going down but we need
To wait for a confirmation
Before entering the trade, so that we
Get a higher success probability of the trade
SHORT🔥
✅Like and subscribe to never miss a new idea!✅
Disclosure: I am part of Trade Nation's Influencer program and receive a monthly fee for using their TradingView charts in my analysis.

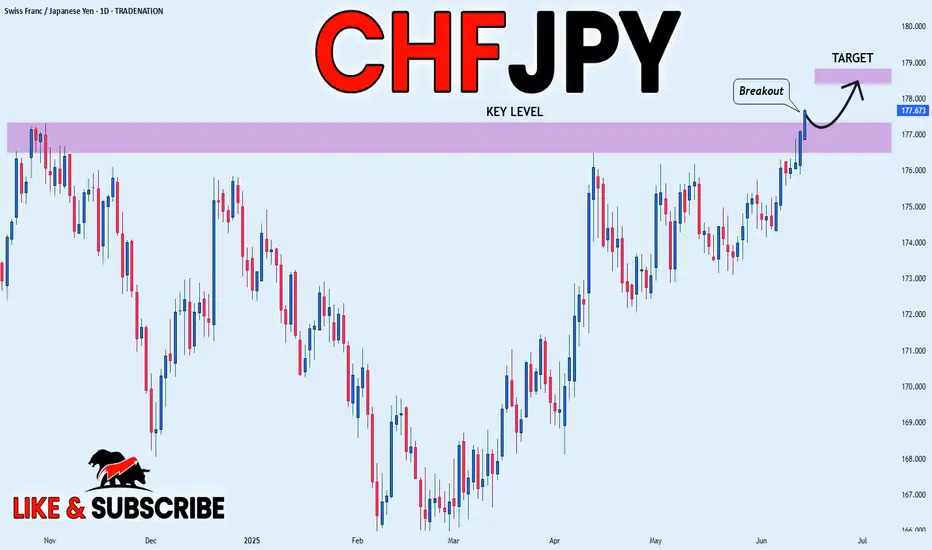
CHF_JPY BULLISH BREAKOUT|LONG|
✅CHF_JPY is going up
Now and the pair made a bullish
Breakout of the key horizontal
Level of 177.000 and the breakout
Is confirmed so we are bullish
Biased and we will be expecting
A further bullish move up
On Monday
LONG🚀
✅Like and subscribe to never miss a new idea!✅
Disclosure: I am part of Trade Nation's Influencer program and receive a monthly fee for using their TradingView charts in my analysis.
AUD-JPY Will Go Down! Sell!
Hello,Traders!
AUD-JPY made a retest
A wide horizontal resistance
Around 93.900 from where
We are already seeing a
Local bearish pullback so
We will be expecting
A further bearish move
Down on Monday
Sell!
Comment and subscribe to help us grow!
Check out other forecasts below too!
Disclosure: I am part of Trade Nation's Influencer program and receive a monthly fee for using their TradingView charts in my analysis.

CAD-JPY Free Signal! Sell!
Hello,Traders!
CAD-JPY went up sharply
But the pair failed to break
A strong horizontal resistance
Of 106.266 from where we
Can enter a short trade with
The Take Profit of 105.768
And the Stop Loss of 106.326
Sell!
Comment and subscribe to help us grow!
Check out other forecasts below too!
Disclosure: I am part of Trade Nation's Influencer program and receive a monthly fee for using their TradingView charts in my analysis.

GBP_JPY LOCAL SHORT|
✅GBP_JPY has been growing recently
And the pair seems locally overbought
So as the pair is approaching a horizontal resistance of 196.400
Price decline is to be expected
SHORT🔥
✅Like and subscribe to never miss a new idea!✅
Disclosure: I am part of Trade Nation's Influencer program and receive a monthly fee for using their TradingView charts in my analysis.

GBP_CHF RESISTANCE AHEAD|SHORT|
✅GBP_CHF is going up now
But a strong resistance level is ahead at 1.1070
Thus I am expecting a pullback
And a move down towards the target of 1.1013
SHORT🔥
✅Like and subscribe to never miss a new idea!✅
Disclosure: I am part of Trade Nation's Influencer program and receive a monthly fee for using their TradingView charts in my analysis.

EUR-CAD An Interesting Setup! Buy!
Hello,Traders!
EUR-CAD is trading in an
Uptrend along the rising
Support which now
Confluences with the falling
Support line as well so as the
Pair was making a bearish
Correction we will be expecting
A bullish rebound from the
Confluence area and a further
Bullish move up
Sell!
Comment and subscribe to help us grow!
Check out other forecasts below too!
Disclosure: I am part of Trade Nation's Influencer program and receive a monthly fee for using their TradingView charts in my analysis.

EUR-NZD Potential Short! Sell!
Hello,Traders!
EUR-NZD is going up
Just as we predicted but
The pair will soon hit a
Horizontal resistance
Of 1.9287 from where
We will be expecting a
Local pullback and a
Move down
Sell!
Comment and subscribe to help us grow!
Check out other forecasts below too!
Disclosure: I am part of Trade Nation's Influencer program and receive a monthly fee for using their TradingView charts in my analysis.

TESLA Will Fall! Sell!
Hello,Traders!
TESLA went up from the
Horizontal support but has
Hit a horizontal resistance
Of 335$ and we are already
Seeing a bearish pullback
So we will be expecting
A further local move down today
Sell!
Comment and subscribe to help us grow!
Check out other forecasts below too!
Disclosure: I am part of Trade Nation's Influencer program and receive a monthly fee for using their TradingView charts in my analysis.

CAD_CHF STRONG SUPPORT AHEAD|LONG|
✅CAD_CHF will be retesting a support
Level soon around 0.5920
From where I am expecting a bullish reaction
With the price going up but we need
To wait for a reversal pattern to form
Before entering the trade, so that we
Get a higher success probability of the trade
LONG🚀
✅Like and subscribe to never miss a new idea!✅
Disclosure: I am part of Trade Nation's Influencer program and receive a monthly fee for using their TradingView charts in my analysis.

AUD-CHF Free Signal! Buy!
Hello,Traders!
AUD-CHF fell down sharply
But the pair will soon hit a
Horizontal support level
Of 0.5281 from where we
Can go long with the
Take Profit of 0.5312
And the Stop Loss of 0.5273
Buy!
Comment and subscribe to help us grow!
Check out other forecasts below too!
Disclosure: I am part of Trade Nation's Influencer program and receive a monthly fee for using their TradingView charts in my analysis.

NZD_JPY WILL KEEP GROWING|LONG|
✅NZD_JPY is trading along
The rising support line
And as the pair is going up now
After the retest of the line
I am expecting the price to keep growing
To retest the supply levels above at 87.429
LONG🚀
✅Like and subscribe to never miss a new idea!✅
Disclosure: I am part of Trade Nation's Influencer program and receive a monthly fee for using their TradingView charts in my analysis.

US100 - Riding the Ascending Channel Towards $22800NASDAQ is showing a very clear and well-respected ascending channel, with price moving steadily within its bounds. Each pullback has been relatively shallow, and buyers continue to step in near the midline or lower boundary of the channel. This is classic trending behavior, with bullish structure intact and momentum favoring continuation higher.
Break and Flip of Resistance into Support
A key resistance level has just been broken, and more importantly, it has now flipped into support. Price retested this zone cleanly after the breakout, confirming the shift in order flow and adding confidence to the current leg up. This kind of structure shift is significant, especially when paired with a strong trending environment like this one.
Daily Resistance Ahead
Looking ahead, there’s a major daily resistance level just above. This area has acted as a reaction zone in the past and will likely bring some short-term volatility or hesitation. However, in the context of the current trend, that resistance could be used as fuel for the next breakout. If price manages to pierce through it with strength and hold above, it would open the path for a move toward the upper boundary of the channel.
Plan and Expectation
The ideal scenario now is simple: I want to see a clean break above the daily resistance, followed by a retest and confirmation of support. That would set up a strong continuation move targeting the top of the channel. If the resistance holds, I’ll wait for signs of weakness or range formation, but as long as we remain inside this rising structure, the bias remains bullish.
Disclosure: I am part of Trade Nation's Influencer program and receive a monthly fee for using their TradingView charts in my analysis.
___________________________________
Thanks for your support!
If you found this idea helpful or learned something new, drop a like 👍 and leave a comment, I’d love to hear your thoughts! 🚀

Time for the Hammer?” – When Price Breaks, Then Breathes🧠 What Just Happened?
The chart opens with a classic market behavior:
Price runs above recent highs — triggering a wave of emotional entries and stop hunts. Right after, it drops sharply, hinting that something deeper is at play.
This sequence reflects how markets often:
Bait retail traders with a breakout
Break structure suddenly
Then pull back — not for mercy, but to reload
🔍 Why This Pullback Matters
After the aggressive drop, price didn't just fall aimlessly. It paused and returned to a zone of imbalance , a gap where liquidity is still waiting. That retrace isn’t weakness — it’s intent.
This kind of setup teaches a key concept:
“The real move comes after the aggressive move — not before.”
📚 A Lesson in Patience
Most traders enter on the breakout (the sweep)
Smart traders enter on the pullback into value
Pros wait for the reaction + structure shift before doing anything
This isn’t about being first. It’s about being right when it matters.
🧭 Final Thought
The hammer doesn't fall until the trap is fully set.
Study these moves. Study the emotion behind the candles. That's where edge lives.
💬 Drop your thoughts — did you catch this behavior on Gold today?
🔁 Follow for more thought-driven, story-based chart breakdowns.
