GBP-USD Swing Long! Buy!
Hello,Traders!
GBP-USD is trading in an
Uptrend and the pair made
A retest of the horizontal
Support of 1.3419 from where
We are already seeing a
Bullish rebound so we will be
Expecting a further
Bullish move up
Buy!
Comment and subscribe to help us grow!
Check out other forecasts below too!
Disclosure: I am part of Trade Nation's Influencer program and receive a monthly fee for using their TradingView charts in my analysis.
Smartmoneyconcept

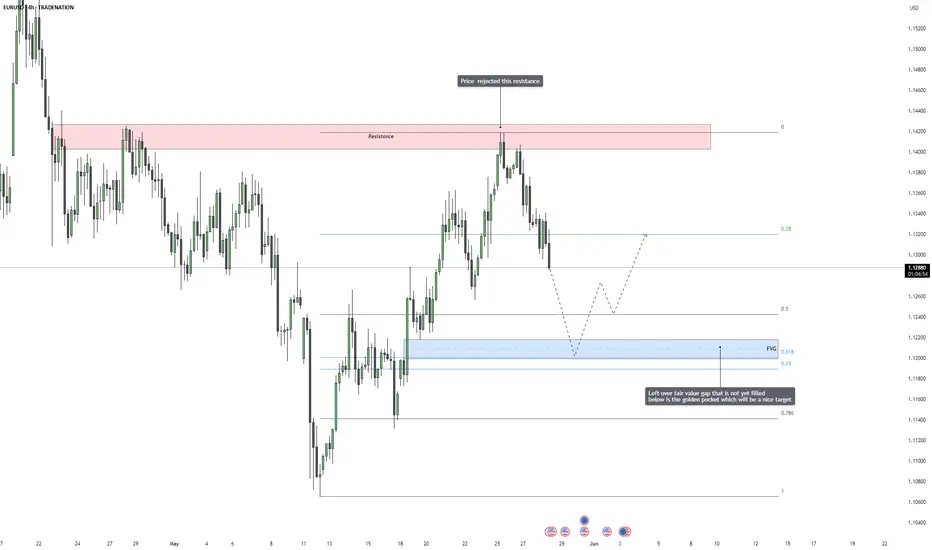
EURUSD – Bearish Reversal in Motion, Fair Value Gap Draws Price EURUSD has recently reacted strongly to a major resistance zone, where price previously stalled and reversed in the past. After running into this area again, we saw a sharp and immediate rejection, which confirms the presence of aggressive selling pressure. This rejection was not just a weak pullback, but a strong displacement candle that shows real intent from institutional participants.
This kind of price action is typically a sign that the market has found a short-term top, and will now look to rebalance lower, especially if there are inefficiencies left behind during the last move up. With the rejection now confirmed and price starting to rotate lower, the odds increase that we see a deeper retracement in the coming sessions.
Resistance Reaction and Liquidity Story
The price reached into a well-defined supply area and rejected cleanly. This level was likely filled with buy-side liquidity from breakout traders and late longs, which institutions needed in order to fill their sell orders. After sweeping above the previous highs and triggering breakout entries, price snapped back below, creating a shift in short-term structure.
That move also created a market imbalance, a price inefficiency that the market tends to come back and correct. With bullish liquidity absorbed at the highs, price is now looking for sell-side liquidity, which can typically be found below the previous higher lows and inside unfilled value areas.
Fair Value Gap and Fibonacci Confluence
Below the current market, we have a clean fair value gap that was left behind during the most recent impulsive bullish move. What makes this area even more attractive is that it overlaps perfectly with the golden pocket zone, the 0.618 to 0.65 Fibonacci retracement level. This confluence creates a high-probability target area, not just because of the imbalance, but also because this level acts as a common retracement zone where institutional traders often look to reaccumulate or exit short-term positions.
This area is also likely to hold resting liquidity from traders who placed stop losses under recent higher lows. All these factors combined make the fair value gap plus golden pocket area a natural draw for price, the market tends to gravitate toward these zones when there’s unfinished business left behind.
Expectations and Potential Development
Going forward, I expect price to continue bleeding lower in a controlled fashion, possibly forming minor lower highs along the way. Once the fair value gap is reached and filled, we could see signs of support or accumulation, depending on the context at the time. It’s important not to blindly long from that area, but instead wait for a market reaction, ideally a shift in structure on the lower timeframes, to signal that buyers are stepping back in.
If the market holds that area and confirms support, it could launch a new leg higher. However, if the fair value gap fails and price continues to break down, it would signal that this move is not just a retracement but possibly the start of a larger bearish leg.
Conclusion
The rejection from resistance has opened the door for a deeper retracement. With a clear fair value gap and Fibonacci golden pocket below, the market now has a logical destination to correct toward. This level offers a clean narrative for continuation lower, and it aligns with both price action structure and algorithmic models. Patience is key now, the best opportunities come when price delivers into clean zones like this one.
Disclosure: I am part of Trade Nation's Influencer program and receive a monthly fee for using their TradingView charts in my analysis.
___________________________________
Thanks for your support!
If you found this idea helpful or learned something new, drop a like 👍 and leave a comment, I’d love to hear your thoughts! 🚀
GBP_NZD RISKY LONG|
✅GBP_NZD is going down now
But a strong support level is ahead at 2.2520
Thus I am expecting a rebound
And a move up towards the target of 2.2609
LONG🚀
✅Like and subscribe to never miss a new idea!✅
Disclosure: I am part of Trade Nation's Influencer program and receive a monthly fee for using their TradingView charts in my analysis.

EUR-USD Free Signal! Buy!
Hello,Traders!
EUR-USD is going down
And the pair will soon hit
A horizontal support level
Around 1.1270 from where
We will be able to go long
With the Take Profit of 1.1328
And the Stop Loss of 1.1254
Buy!
Comment and subscribe to help us grow!
Check out other forecasts below too!
Disclosure: I am part of Trade Nation's Influencer program and receive a monthly fee for using their TradingView charts in my analysis.

Mastering the ICT Power of 3 concept - How to use it in trading!The financial markets often appear chaotic and unpredictable, but behind the scenes, institutional players operate with clear strategies that shape price action. One such strategy is the ICT (Inner Circle Trader) "Power of 3" model, a framework used to understand and anticipate market cycles through three key phases: accumulation, manipulation, and distribution. This guide will break down each of these phases in detail, explaining how smart money operates and how retail traders can align themselves with the true direction of the market.
What will be discussed?
- The 3 phases
- Examples of the PO3
- How to trade the PO3
- Tips for trading the PO3
The 3 phases
Accumulation
The Accumulation Phase in the ICT "Power of 3" model refers to the initial stage of a market cycle where institutional or "smart money" participants quietly build their positions. During this time, price typically moves sideways within a tight range, often showing little to no clear direction. This is intentional. The market appears quiet or indecisive, which is designed to confuse retail traders and keep them out of alignment with the real intentions of the market's larger players.
In this phase, smart money is not looking to move the market dramatically. Instead, they are focused on accumulating long or short positions without drawing attention. They do this by keeping price contained within a consolidation zone. The idea is to gather enough liquidity, often from unsuspecting retail traders entering early breakout trades or trying to trade the range, before making a more aggressive move.
Manipulation
The Manipulation Phase in the ICT "Power of 3" model is the second stage that follows accumulation. This phase is where smart money deliberately moves the market in the opposite direction of their intended move to trigger retail stop losses, induce emotional decisions, and create liquidity.
After price has consolidated during accumulation, many retail traders are either already positioned or have orders waiting just outside the range, either stop losses from those trading the range or breakout orders from those anticipating a directional move. The manipulation phase exploits this positioning. Price will often break out of the accumulation range in one direction, appearing to confirm a new trend. This move is designed to look convincing, it might even come with a spike in volume or momentum to draw traders in.
However, this breakout is a false move. It doesn’t represent the true intention of smart money. Instead, it's meant to sweep liquidity, triggering stop losses above or below the range, and then reverse sharply. This stop run provides the liquidity needed for large players to finalize their positions at optimal prices. Once enough liquidity is collected, and retail traders are caught offside, the real move begins.
Distribution
The Distribution Phase in the ICT "Power of 3" model is the final stage of the cycle, following accumulation and manipulation. This is where the true intention of smart money is revealed, and the market makes a sustained, directional move, either bullish or bearish. Unlike the earlier phases, distribution is marked by clear price expansion, increased volatility, and decisive momentum.
After smart money has accumulated positions and shaken out retail traders through manipulation, they have the liquidity and positioning needed to drive the market in their desired direction. The distribution phase is where these positions are "distributed" into the broader market, meaning, institutions begin to offload their positions into the retail flow that is now chasing the move. Retail traders, seeing the strong trend, often jump in late, providing the liquidity for smart money to exit profitably.
This phase is typically what retail traders perceive as the real trend, and in a sense, it is. However, by the time the trend is obvious, smart money has already entered during accumulation and profited from the manipulation. What appears to be a breakout or trend continuation to most retail participants is actually the final leg of the smart money’s strategy. They are now unloading their positions while price continues to expand.
Examples of the Power of 3
How to trade the PO3?
Start by identifying a clear accumulation range. This typically happens during the Asian session or the early part of the London session. Price moves sideways, forming a consolidation zone. Your job here isn’t to trade, but to observe. Draw horizontal lines marking the high and low of the range. These become your key liquidity zones.
Next, anticipate the manipulation phase, which usually occurs during the London session or at the NY open. Price will often break out of the range, triggering stop losses above the high or below the low of the accumulation zone. This move is deceptive, it is not the real trend. Do not chase it. Instead, wait for signs of rejection, such as a sharp reversal after the liquidity grab, imbalance filling, or a shift in market structure on a lower timeframe (like a 1- or 5-minute chart).
Once manipulation has swept liquidity and price starts showing signs of reversing back inside the range or beyond, you now look for a confirmation of the true move, this begins the distribution phase. You enter in the direction opposite of the manipulation move, ideally once price breaks a structure level confirming that smart money has taken control.
For example, if price consolidates overnight, fakes a move to the downside (running sell stops), and then quickly reverses and breaks above a key swing high, that's your signal that the true move is likely up. Enter after the break and retest of structure, using a tight stop loss below the recent low. Your target should be based on liquidity pools, fair value gaps, or higher-timeframe imbalances.
The key to trading the Power of 3 is patience and precision. You're not trying to catch every move, but to wait for the market to complete its cycle of deception and then ride the clean expansion. Ideally, your entry comes just after manipulation, and you hold through the distribution/expansion phase, taking partials at key liquidity levels along the way.
Tips for trading the PO3
1. Learn price movements
Before you can effectively apply the ICT Power of 3 strategy, it’s crucial to have a deep understanding of how price behaves. This means being comfortable identifying market structure, recognizing trend direction, and interpreting candlestick dynamics. Since the Power of 3 is deeply rooted in how price moves in real time, a strong grasp of these basics will give you the confidence to read the market correctly as each phase develops.
2. Analyse multiple timeframes
Although the Power of 3 pattern shows up on lower timeframes, relying on just one can lead to misreads. You’ll gain a clearer picture when you align the short-term view with higher timeframe structure. For example, what appears to be accumulation on the 15-minute chart may simply be a retracement in a larger trend on the 1-hour or daily. By examining multiple timeframes together, you can better identify the true setup and avoid being tricked by noise.
3. Exercise patience
A key part of trading the Power of 3 is knowing when to act, and more importantly, when not to. It’s easy to get impatient during the accumulation or manipulation phases, but entering too early often leads to frustration or losses. True discipline comes from waiting for the expansion or distribution phase, when the market reveals its real direction. This is where the most favorable risk-to-reward setups occur.
Thanks for your support.
- Make sure to follow me so you don't miss out on the next analysis!
- Drop a like and leave a comment!

Bitcoin - Bulls in Control $113k Next targetBitcoin just delivered a textbook bullish reaction following a decisive liquidity sweep beneath the 4H range lows. Instead of continuing lower or entering a consolidation phase, price responded with immediate strength, snapping back with velocity, reclaiming structural levels, and rejecting decisively from a key Fair Value Gap (FVG). This kind of aggressive post-sweep price action usually signals the end of a stop hunt and the beginning of a new directional leg, which, given the current structure, is leaning heavily to the upside.
This is not just a random bounce, it’s a clear shift in intent. The behavior we’re seeing reflects a strategic move by smart money: first clear out liquidity from trapped longs and eager breakout sellers, then reverse and defend key zones that align with institutional discount pricing. The result? A bullish narrative that looks ready to drive price significantly higher.
Liquidity Sweep and FVG Reclaim
The initial sharp drive lower ran through the 4H lows, which had built up significant liquidity from both early long entries and breakout traders looking for continuation. This kind of move is engineered, designed to clean the board before a major shift. Price wicked deep into a 4H Fair Value Gap and immediately snapped back above it, closing strong and leaving behind a long lower wick. That reaction tells a story: there was demand waiting, and it stepped in with authority.
The Fair Value Gap wasn't just tested, it was respected. The fact that price closed back above the gap, after wicking through it, confirms it wasn't simply a liquidity grab but also a moment of rebalancing. The imbalance created earlier was filled efficiently, and the market moved on. That combination of liquidity sweep, deep FVG test, and bullish close is often what marks the end of manipulation and the beginning of a true move. It's a clear signal of smart money stepping in and defending value.
Structural Shift and Accumulation Signal
Following the sweep, the structure shifted rapidly. Price reclaimed the previous 4H support base that had been broken during the stop hunt, invalidating the bearish continuation thesis and instead suggesting accumulation. This is classic behavior after a manipulation low, price doesn’t hesitate or consolidate much, it simply turns with strength.
We’re also seeing signs of absorption and accumulation, particularly in the way price rejected cleanly from discount levels and stabilized within the FVG range. Multiple attempts to break down have failed, and the bounce wasn’t just reactive, it came with commitment. With each retest of the 110.3K resistance, that level weakens structurally. What began as resistance is now showing signs of turning into a launchpad.
If this is indeed the final leg of an accumulation phase, we should expect a marked expansion soon. The setup aligns with smart money accumulation logic: sweep liquidity, shift structure, trap shorts, and then displace with force.
Price Targets and Expectations
The 110.3K level remains the most immediate point of interest. It has acted as resistance multiple times, but each rejection has grown weaker. If price clears this level with conviction, ideally through a sharp displacement candle, the breakout has legs. Above that, we enter clean air with little resistance overhead.
The next logical target becomes 113K, which aligns both psychologically and technically with the next liquidity cluster. It’s an untested zone and represents the next area where sellers might appear. However, given the strength of the reversal and lack of major supply between 110.3K and 113K, price could move swiftly once the breakout is confirmed.
Longer-term, if momentum holds and Bitcoin maintains strength above 110.3K, we could see a retest of the all-time highs come into focus sooner than expected. But for now, the priority is to monitor how price interacts with 110.3K and look for signs of breakout strength or failed move traps.
Conclusion
Bitcoin isn’t in a boring range or slow grind, it just executed a classic liquidity play: sweep, react, reclaim. The reaction off the 1H Fair Value Gap that followed the 4H sweep is a strong signal that the market has shifted gears. With clear signs of demand stepping in and structure now favoring the bulls, the 110.3K level looks increasingly vulnerable. If that breaks, the path toward higher prices, including 113K and beyond, opens up fast.
The overall context has shifted from consolidation to directional expansion, and everything about the recent move points toward the bulls regaining control. Keep your eyes on the structure, the volume, and the displacement above key levels, the next leg could be explosive.
___________________________________
Thanks for your support!
If you found this idea helpful or learned something new, drop a like 👍 and leave a comment, I’d love to hear your thoughts! 🚀

EUR_AUD WILL GO DOWN|SHORT|
✅EUR_AUD price grew again
To retest the resistance of 1.7640
But it is a strong key level
So I think that there is a high chance
That we will see a bearish move down
SHORT🔥
✅Like and subscribe to never miss a new idea!✅
Disclosure: I am part of Trade Nation's Influencer program and receive a monthly fee for using their TradingView charts in my analysis.

Dow Jones Index Local Short! Sell!
Hello,Traders!
US30 index keeps going up
But the price will soon hit
A strong horizontal resistance
Level around 42,876 from where
We will be expecting a local
Pullback and a move down
Sell!
Comment and subscribe to help us grow!
Check out other forecasts below too!
Disclosure: I am part of Trade Nation's Influencer program and receive a monthly fee for using their TradingView charts in my analysis.

EUR-AUD Short From Resistance! Sell!
Hello,Traders!
EUR-AUD made a retest
Of the key horizontal
Resistance level of 1.7640
From where we are already
Seeing a bearish pullback so
As we are locally bearish
Biased and we will be
Expecting a further
Bearish move down
Sell!
Comment and subscribe to help us grow!
Check out other forecasts below too!
Disclosure: I am part of Trade Nation's Influencer program and receive a monthly fee for using their TradingView charts in my analysis.

AUD_USD LONG FROM RISING SUPPORT|
✅AUD_USD is trading along
The rising support line
And as the pair will soon retest it
I am expecting the price to go up
To retest the supply levels above 0.6460
LONG🚀
✅Like and subscribe to never miss a new idea!✅
Disclosure: I am part of Trade Nation's Influencer program and receive a monthly fee for using their TradingView charts in my analysis.

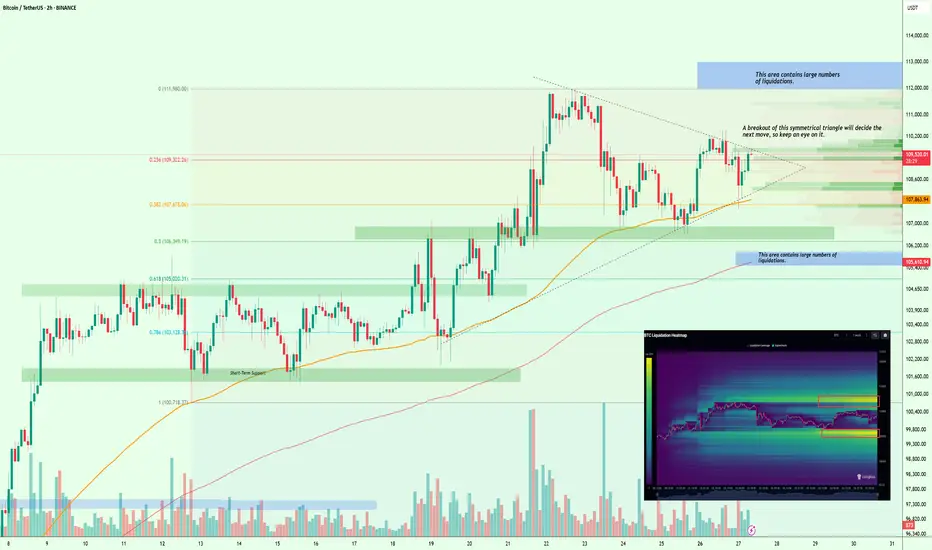
$BTC Liquidity Squeeze Incoming – Breakout or Breakdown?#Bitcoin
According to the liquidation heat map, CRYPTOCAP:BTC is building a large cluster of liquidations on both the upside and downside, creating some confusion in the market. However, the nearest major liquidation zone is around $112K–$113K, which increases the chances of a move toward that range.
Technically, BTC is forming a symmetrical triangle, and the breakout from this pattern will likely determine the next major move.
So keep a close eye on it.
I’ll keep you posted as things unfold.
If you find my updates helpful, don’t forget to like and follow for more!
EUR/USD - Is the uptrend about to end?The EUR/USD currency pair has demonstrated a consistent uptrend on the 4-hour chart for approximately two weeks. This sustained bullish momentum has captured the attention of traders and analysts alike, who are now questioning whether the pair can maintain its upward trajectory or if a retracement is imminent as it approaches significant resistance levels.
Rising wedge
A closer examination of the price action reveals that EUR/USD has been advancing within a rising wedge formation. This technical pattern is generally considered bearish, as it often precedes a reversal or a breakdown rather than a continued rally. Rising wedges are characterized by converging trendlines, with price making higher highs and higher lows at a diminishing rate, which typically signals waning bullish momentum and a potential for sellers to regain control.
Strong resistance
Recently, the pair encountered a notable resistance zone around the 1.141 level. Upon reaching this area, EUR/USD faced a rejection, resulting in a pullback from its recent highs. While there is a possibility that the pair could make another attempt to test this resistance, the initial rejection suggests that the upward move may be losing steam. As a result, the likelihood of a retracement has increased, especially given the bearish implications of the rising wedge pattern.
Support/target zone
If the pair does indeed correct lower, a logical target for a cooldown would be the green support zone near 1.127. This level has previously acted as a strong support area, and it could serve as a foundation for buyers to step in once more, potentially setting the stage for another move higher. Until the resistance at 1.141 is decisively broken, caution is warranted, and a period of consolidation or a pullback towards support appears increasingly probable.
Thanks for your support.
- Make sure to follow me so you don't miss out on the next analysis!
- Drop a like and leave a comment!

Bitcoin – Possible 4h Sweep at 106.5kBitcoin recently printed a sharp rejection after revisiting a key supply area formed by a 4H fair value gap, overlapping perfectly with the golden pocket zone from the most recent down move. This confluence provided a strong technical ceiling, causing a clear reaction and shifting short-term sentiment to the downside. The rejection was sharp and clean, leaving behind an upper wick that signals strong selling interest. From here, price appears to be in search of support, and our eyes are now locked on the 4H imbalance around the 108.2k level, which could serve as a key pivot for the next directional move.
Consolidation and Confluence Structure
This recent move isn’t just a random drop. We’ve built a range around this resistance zone, with multiple failed attempts to break higher, followed by a clear rejection from inside the 4H FVG and golden pocket. This kind of structure usually tells us two things: first, buyers are struggling to break through strong institutional resistance, and second, there’s still liquidity left below that the market may want to sweep before any continuation higher. This is where the FVG at 108.2k and the PDL around 106.5k come into play. Both zones are clean, visible, and highly likely to draw price if the current level doesn’t hold.
Fair Value Gap Reaction Potential
The 108.2k zone is where the first major reaction could occur. It marks a fresh 4H imbalance created during the impulsive move upward, and price is now backfilling that inefficiency. If buyers step in here, respecting this imbalance as a demand zone, we could easily see a rotation back up toward 110.2k and eventually a retest of the upper resistance band near 111k. This would be a typical FVG play: price rebalances into the gap, finds demand, and continues higher.
Failure Scenario and Liquidity Sweep Setup
If the 108.2k FVG fails to hold as support, the next target becomes much more obvious, the previous day’s low at 106.5k. That level is also a 4H swing low, making it a prime liquidity draw. A move below that low would allow price to collect sell-side liquidity, sweep out late longs, and potentially trap breakout traders expecting further downside. If this level is swept cleanly and followed by bullish displacement, it could offer a high-probability long entry from the discount zone. The risk-reward from this setup would be ideal, especially if we reclaim 108.2k afterward.
Market Context and Higher Timeframe Bias
Zooming out, the structure remains bullish on higher timeframes, but this local rejection is a necessary reset. It’s a shakeout that allows price to reprice into demand and generate momentum for the next leg up. This kind of behavior is typical in trending markets, corrective moves that dig into inefficiencies, hunt liquidity, and then reestablish the trend. As long as we don’t see sustained closes below 106k, the bias remains tilted toward continuation to the upside, with current price action offering a potential entry opportunity.
Price Target and Expectations
If we hold the 108.2k zone, my first short-term target is the 110.2k structure high, followed by the upper resistance area around 111k where the initial rejection occurred. A reclaim of that zone opens the door to expansion toward 112k. If instead we sweep the PDL and bounce from 106.5k, the first target would be a retrace into the 108.2k imbalance, with the next leg aiming for the same resistance range. Either path sets up a long opportunity from areas of value.
Conclusion
Bitcoin is at an important decision point. The rejection from the 4H FVG and golden pocket confirms strong resistance, and price is now seeking support lower. The 108.2k FVG is a critical zone, a hold here gives us a clean continuation setup, while a failure could lead to a deeper liquidity sweep toward 106.5k. Either scenario offers high-quality trade potential as long as we stay disciplined and wait for confirmation from price action. Patience is key, but both levels present opportunities to position long from areas where smart money typically steps in.
___________________________________
Thanks for your support!
If you found this idea helpful or learned something new, drop a like 👍 and leave a comment, I’d love to hear your thoughts! 🚀

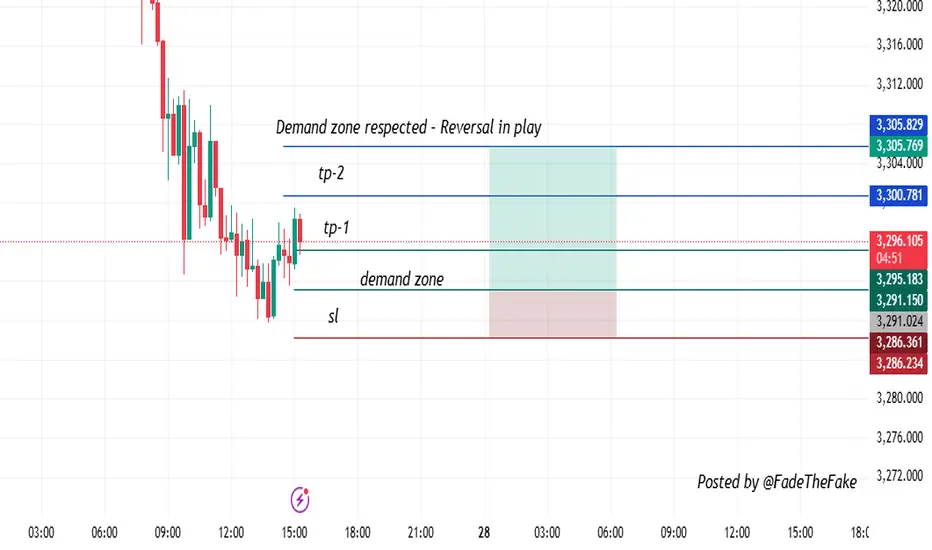
Structure Shift at Key Support – Is the Bullish Reversal InPrice aggressively broke down recently but showed strong reaction near the 3,280–3,290 demand zone, reflecting potential buyer absorption at lower prices. Following several bearish attempts that failed, price started making higher lows, reflecting a change in short-term structure.
Trade Idea:
Expecting a bullish reversal from this demand zone with a clean RR setup.
Entry Zone: 3,290–3,292 (bullish confirmation candle or wick rejection)
Stop Loss: 3,280 (below liquidity sweep & structure low)
Take Profit Targets:
• TP1: 3,300 – intraday bounce zone
• TP2: 3,305 – mid-level resistance
• TP3: 3,310 – structural breakout area
Why this setup?
✅ Structure shift (higher lows)
✅ Demand zone tapped with strong wick rejection
✅ Clean RR with risk tightly managed
✅ No major macro resistance until 3,310
Risk Note:
Steer clear of early entries without confirmation. If price doesn't hold above 3,288, bearish continuation is still in play.
How to use advanced candlestick anatomy in trading: CADJPYEvery candlestick on the chart is made up of different or multiple candles on the lower timeframe. For example, a weekly candle is made up of seven daily candles. While a 4 hours candle is made up of four 1 hour candles. Understanding how these candles contribute to the formation of a single or more candlesticks will go a long way in improving our performance.
Candlestick anatomy has to do with the formation of candlestick on the chart and the implication of such candlestick. Conventionally, common candlesticks are engulfing candlestick, doji, evening star, hammer, pin bar and the rest. Some signify continuation while others are meant for reversal. The formation of these candlesticks at key levels provide an helpful insights into understanding the next market move. Hence, they can serve as confluence and confirmation for our trading decision.
Taking this further a bit, by examining these candlesticks, one can get to understand better a precise point for entry and exit. This may be new to a retail trader who trades just the candlestick while it will provide more insights for anyone looking for ways to optimize his performance.
As a case study, I had a sell setup on CADJPY and it gave a bearish engulfing candlestick on 1 hour timeframe as a confirmation for selling. Instead of entering the trade after the bearish candle closed, I changed to 5 minutes timeframe to examine the anatomy of the candlestick. Then, I discovered that there was sweep and change of character. Based on the price narrative on 5 minutes timeframe, then trading decision was made using the 5 minutes timeframe, targeting 3 RR. If 1 hour timeframe had been used for taking the trade, one is likely to have lost the profit by now.
Candlestick anatomy will help you to optimize your performance and returns.
I hope you've learnt something helpful from this post.
Thanks.
Fatai Kareem, Kof T Fx.

GBP-JPY Resistance Cluster! Sell!
Hello,Traders!
GBP-JPY made a retest
Of the resistance cluster
Of the rising and horizontal
Resistance lines around 193.989
And we are already seeing a
Bearish reaction so we will be
Expecting a further bearish
Move down
Sell!
Comment and subscribe to help us grow!
Check out other forecasts below too!
Disclosure: I am part of Trade Nation's Influencer program and receive a monthly fee for using their TradingView charts in my analysis.

AUD_NZD SUPPORT AHEAD|LONG|
✅AUD_NZD is going down now
But a strong support level is ahead at 1.0780
Thus I am expecting a rebound
And a move up towards the target at 1.0827
LONG🚀
✅Like and subscribe to never miss a new idea!✅
Disclosure: I am part of Trade Nation's Influencer program and receive a monthly fee for using their TradingView charts in my analysis.

EUR-USD Local Long! Buy!
Hello,Traders!
EUR-USD made a retest
Of the key horizontal
Support level of 1.1369
And we are already seeing
A bullish rebound so we will
Be expecting a further
Bullish move up
Buy!
Comment and subscribe to help us grow!
Check out other forecasts below too!
Disclosure: I am part of Trade Nation's Influencer program and receive a monthly fee for using their TradingView charts in my analysis.

GOLD → Descending Channel and Triangle Appear on H4 Gold Technical Analysis
EMA 200
Last Thursday, gold broke below the 200 EMA, signaling a potential trend reversal to bearish, followed by a rejection at 3,128.00 — an H4 order block area. However, on Tuesday, price action pushed back above the 200 EMA and held, indicating a return to bullish momentum.
Chart Pattern
Price movement is currently constrained by several trendlines, forming a descending channel and triangle pattern, creating a sideways market structure.
Order Block Mapping
A new H4 order block has formed, representing a key area to look for potential buy entries. If this zone is broken, it may offer a strong opportunity for a sell entry.
🟢 Bullish Scenario
If gold reaches the 3,318.00 level — an H4 order block area — it may present a potential buying opportunity. A breakout above the upper trendline would confirm bullish continuation, with the first target at 3,366.00 (TP1), followed by a second target at 3,440.00 (TP2), which is also an H4 order block area.
🔴 Bearish Scenario
If gold breaks below the H4 order block at 3,290.00 and breaches the lower trendline, it may offer a selling opportunity, with the next downside target at 3,055.00 — a key daily order block level.
Best Regard

EURAUD (BOS 1H + DEMAND + OTE)Hello traders!
Description: Now we already in 0,5 of fib level, price want to close imb and mitigate demand + 705 OTE in case BOS 1H.
Entry: Confirmation on LTF in POI
Target: New HH
P.S: check also previous idea.
Have a profitable day and don't forget to subscribe for more updates!
If you like this idea drop a like, leave a comment.

GOLD Local Short! Sell!
Hello,Traders!
GOLD made a retest a
Horizontal resistance
Of 3,366$ and we are
Already seeing a local
Bearish reaction so a
Further local pullback
Is expected with the
Target being 3,337$ level
Sell!
Comment and subscribe to help us grow!
Check out other forecasts below too!
Disclosure: I am part of Trade Nation's Influencer program and receive a monthly fee for using their TradingView charts in my analysis.

EUR_CAD RISKY LONG|
✅EUR_CAD is going down to retest
A horizontal support of 1.5570
Which makes me locally bullish biased
And I think that we will see a rebound
And a move up from the level
Towards the target above at 1.5630
LONG🚀
✅Like and subscribe to never miss a new idea!✅
Disclosure: I am part of Trade Nation's Influencer program and receive a monthly fee for using their TradingView charts in my analysis.

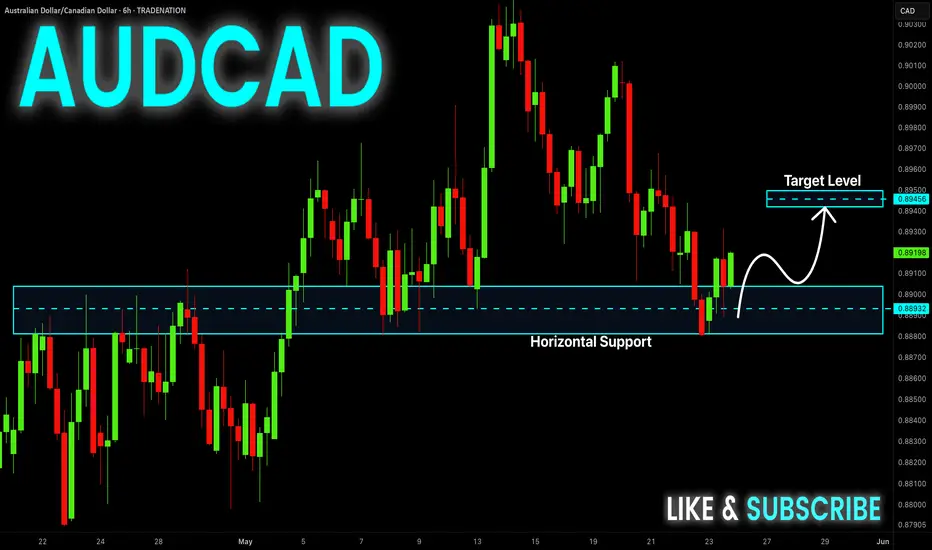
AUD-CAD Will Go UP! Buy!
Hello,Traders!
AUD-CAD made a retest
Of the horizontal support
Level of 0.8880 and we
Are already seeing a
Bullish rebound so we are
Locally bullish biased and
We will be expecting a
Further bullish move up
Buy!
Comment and subscribe to help us grow!
Check out other forecasts below too!
Disclosure: I am part of Trade Nation's Influencer program and receive a monthly fee for using their TradingView charts in my analysis.