USD-JPY Will Keep Growing! Buy!
Hello,Traders!
USD-JPY keep growing and
The pair made a bullish breakout
Of the key horizontal level
Of 149.181 and the pair is
Already retesting the new
Support and we will be
Expecting a further
Bullish move up
Sell!
Comment and subscribe to help us grow!
Check out other forecasts below too!
Disclosure: I am part of Trade Nation's Influencer program and receive a monthly fee for using their TradingView charts in my analysis.
Smartmoneyconcept

AUD_USD BEARISH BREAKOUT|SHORT|
✅AUD_USD broke the key
Structure level of 0.6460
While trading in an local downtrend
Which makes me bearish
And I think that after the retest of
The broken level is complete
A bearish continuation will follow
SHORT🔥
✅Like and subscribe to never miss a new idea!✅
Disclosure: I am part of Trade Nation's Influencer program and receive a monthly fee for using their TradingView charts in my analysis.

AUD-JPY Bearish Breakout! Sell!
Hello,Traders!
AUD-JPY made a bearish
Breakout of the rising support
Line and we are bearish biased
So we will be expecting a
Further bearish move down
Sell!
Comment and subscribe to help us grow!
Check out other forecasts below too!
Disclosure: I am part of Trade Nation's Influencer program and receive a monthly fee for using their TradingView charts in my analysis.

USD_CAD BULLISH BREAKOUT|LONG|
✅USD_CAD is going up
Now and the pair made a bullish
Breakout of the key horizontal
Level of 1.3800 and the breakout
Is confirmed so we are bullish
Biased and we will be expecting
A further bullish move up
LONG🚀
✅Like and subscribe to never miss a new idea!✅
Disclosure: I am part of Trade Nation's Influencer program and receive a monthly fee for using their TradingView charts in my analysis.

EURUSD - 4-Hour Chart with Order Block Reversal StrategyThe EUR/USD 4-hour chart shows a significant bearish retracement approaching a well-defined order block zone, which represents a potential strong support area where major buyers may step in.
Price has experienced a clear downtrend following a break of structure (BOS) from the recent high near 1.18000 into the order block area around 1.13900 - 1.14150. This order block acts as a demand zone where smart money is anticipated to accumulate buy orders, making it a critical level to watch for potential market reversal.
The trading plan anticipates price will test this order block support and generate bullish reversal signals such as price rejection candlesticks or increased buying volume. Confirmation at this zone sets up a potential long trade aiming for a significant retracement to the previous weak high near 1.19200, targeting a strong risk-to-reward opportunity.
Risk management is vital, placing stop losses just below the lower boundary of the order block to protect against false breakouts or further downside continuation.
This plan combines market structure analysis, smart money concepts of order blocks, and technical confirmation to capture a high-probability reversal trade. Traders should patiently wait for clear reversal signals before entry and monitor price action closely within the order block for optimal trade timing.

EUR-USD Free Signal! Buy!
Hello,Traders!
EUR-USD keeps falling and
The pair is locally oversold so
As the pair is retesting the
Horizontal support level
Of 1.1468 we can enter a
Long trade with Take Profit
Of 1.1510 and Stop Loss
Of 1.1443
Buy!
Comment and subscribe to help us grow!
Check out other forecasts below too!
Disclosure: I am part of Trade Nation's Influencer program and receive a monthly fee for using their TradingView charts in my analysis.

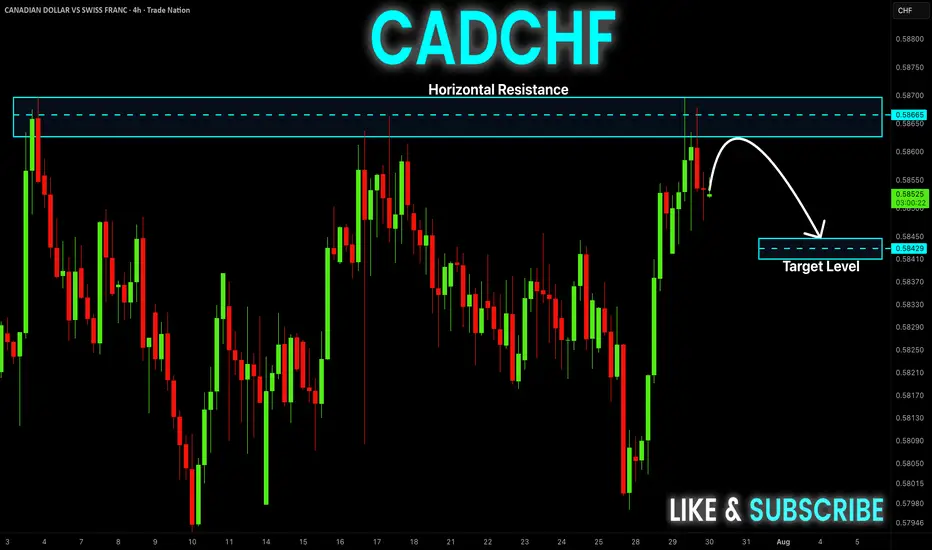
CAD-CHF Local Short! Sell!
Hello,Traders!
CAD-CHF went up and
Made a retest of the
Horizontal resistance
Around 0.5870 and we
Are already seeing a bearish
Pullback so we will be
Expecting a further
Bearish correction
Sell!
Comment and subscribe to help us grow!
Check out other forecasts below too!
Disclosure: I am part of Trade Nation's Influencer program and receive a monthly fee for using their TradingView charts in my analysis.
GOLD BEARISH BIAS|SHORT|
✅GOLD broke the rising
Support line which is now
A resistance and the price
Is retesting the line now so
We are locally bearish biased
And we will be expecting a
Local move down
SHORT🔥
✅Like and subscribe to never miss a new idea!✅
Disclosure: I am part of Trade Nation's Influencer program and receive a monthly fee for using their TradingView charts in my analysis.

GBP-JPY Rising Support! Buy!
Hello,Traders!
GBP-JPY is trading in an
Uptrend and the pair made
A retest of the rising support
And we are seeing a local
Bullish rebound and we will
Be expecting a further
Local move up
Buy!
Comment and subscribe to help us grow!
Check out other forecasts below too!
Disclosure: I am part of Trade Nation's Influencer program and receive a monthly fee for using their TradingView charts in my analysis.

USD-CAD Short From Resistance! Sell!
Hello,Traders!
USD-CAD went up and
Retested a horizontal
Resistance of 1.3800
From where we are
Already seeing a local
Bearish pullback and
As we are locally bearish
Biased so we will be
Expecting a local move down
Sell!
Comment and subscribe to help us grow!
Check out other forecasts below too!
Disclosure: I am part of Trade Nation's Influencer program and receive a monthly fee for using their TradingView charts in my analysis.

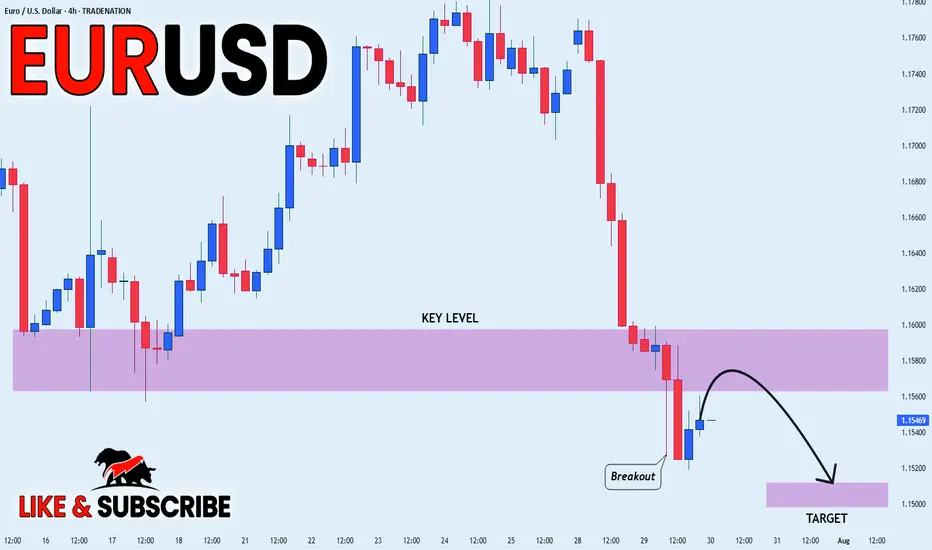
EUR_USD BEARISH BREAKOUT|SHORT|
✅EUR_USD broke the key
Structure level of 1.1580
While trading in an local downtrend
Which makes me bearish
And I think that after the retest of
The broken level is complete
A bearish continuation will follow
SHORT🔥
✅Like and subscribe to never miss a new idea!✅
Disclosure: I am part of Trade Nation's Influencer program and receive a monthly fee for using their TradingView charts in my analysis.
EUR_NZD REBOUND AHEAD|LONG|
✅EUR_NZD fell again to retest the support of 1.9380
But it is a strong key level
So I think that there is a high chance
That we will see a bullish rebound and a move up
LONG🚀
✅Like and subscribe to never miss a new idea!✅
Disclosure: I am part of Trade Nation's Influencer program and receive a monthly fee for using their TradingView charts in my analysis.

USD/JPY Chart Analysis (Educational Breakdown)📊USD/JPY Chart Analysis (Educational Breakdown)
🗓 Date: July 28, 2025
⏰ Timeframe: 2H (2-Hour Candles)
🧠 Concepts: Liquidity | Fair Value Gap | Order Block | Structure | Support/Resistance
⸻
1. Market Structure Overview
• The pair has been bullish, making higher highs and higher lows.
• Recently, price tapped into a resistance zone (~148.40–149.00) and sharply rejected, suggesting a potential short-term reversal.
• The price may now aim to sweep liquidity below support before a possible rebound.
⸻
2. Key Levels
🟥 Resistance Zone (148.50–149.00)
• Marked by a previous supply zone where sellers stepped in aggressively.
• Current Bearish Order Block sits just below this resistance, confirming institutional interest in selling this level.
🟫 Bearish Order Block
• Last bullish candle before sharp drop acts as a bearish order block (around 148.30–148.50).
• This is a high-probability sell-side reaction area — ideal for liquidity grabs and reversals.
🟦 Fair Value Gap (FVG)
• Between mid-17th–18th July, an imbalance was left after strong bullish momentum.
• Price returned to this zone, partially filled the gap, and then dropped again — confirming its importance.
🟥 Support Zone (145.80–146.30)
• Long-standing demand area where buyers previously stepped in.
• This area aligns closely with sell-side liquidity (SSL).
⸻
3. Liquidity Zones
🔵 Buy-Side Liquidity (BSL) – Above resistance (149.00+)
• Stop-loss clusters above previous swing highs.
• Liquidity for institutional sell positions.
🟣 Sell-Side Liquidity (SSL) – Below 146.00
• Positioned right under support.
• Ideal liquidity target for smart money to trigger stop hunts and fill positions before reversing.

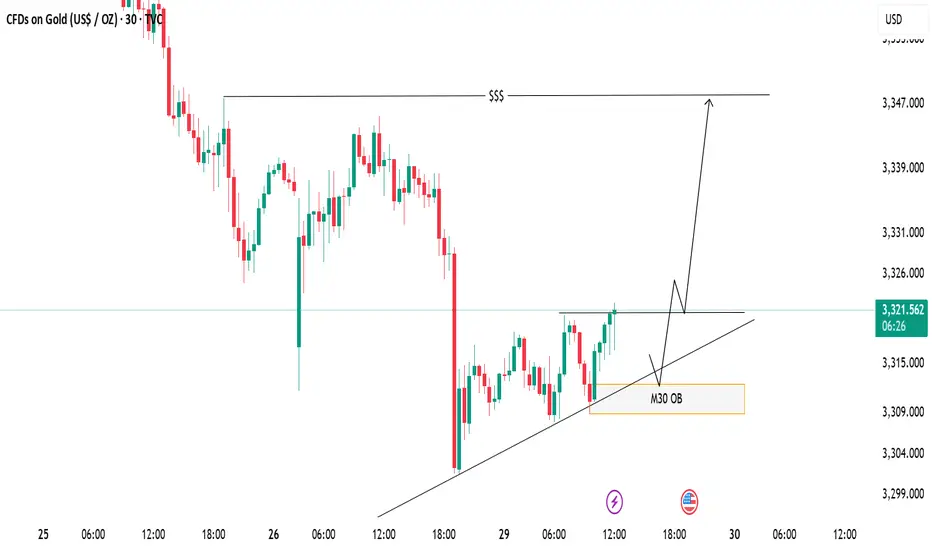
XAUUSD Eyeing Liquidity Grab – M30 OB Zone in PlayPrice is respecting the ascending trendline and consolidating near a key resistance level. A bullish breakout is expected, with a potential retest of the trendline and the M30 Order Block (OB) zone acting as a key demand area.
📈 Trade Plan:
Wait for a minor pullback into the OB and trendline confluence
Look for bullish confirmation to go long
Target the liquidity zone above (around 3347)
📌 A clean structure and bullish order flow hint at a continuation to the upside.
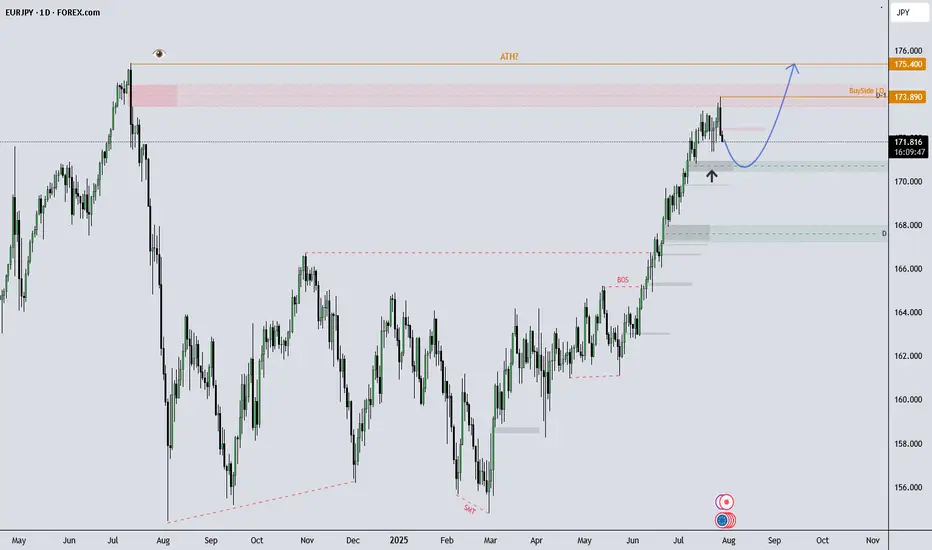
EURJPY Eyes New Highs After Pullback?What I see!
EURJPY Technical Outlook –
EURJPY remains in a strong uptrend and recently tapped into buy-side liquidity at 173.89, which now marks the All-Time High (ATH). After a brief rejection from that level, price is currently showing signs of a healthy pullback.
I’m observing the 170.00–171.00 zone, which aligns with previous demand. If price continues to respect this area, the overall bullish structure remains intact, with potential for a move back toward (and possibly beyond) the ATH.
A sustained break below 170.00 could indicate room for a deeper pullback, potentially toward the 168.00s, which would be a key area to monitor.
This analysis is shared for educational and discussion purposes only.
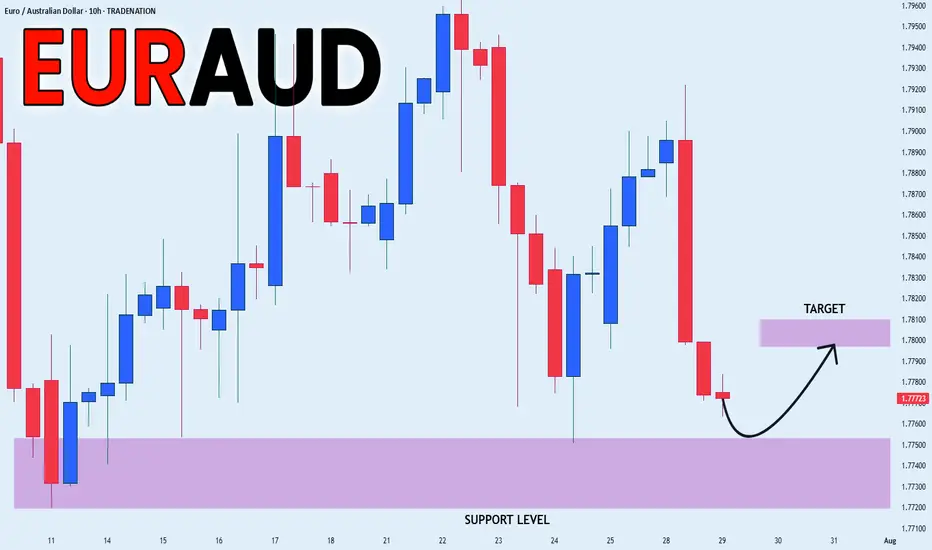
EUR_AUD LOCAL GROWTH AHEAD|LONG|
✅EUR_AUD will soon retest a key support level of 1.7750
So I think that the pair will make a rebound
And go up to retest the supply level above at 1.7800
LONG🚀
✅Like and subscribe to never miss a new idea!✅
Disclosure: I am part of Trade Nation's Influencer program and receive a monthly fee for using their TradingView charts in my analysis.
EUR-NZD Will Grow! Buy!
Hello,Traders!
EUR-NZD keeps falling
Down and we are bearish
Biased mid-term but there is
A horizontal support level
Below at 1.9370 so after
The retest we might expect
A local bullish correction
Buy!
Comment and subscribe to help us grow!
Check out other forecasts below too!
Disclosure: I am part of Trade Nation's Influencer program and receive a monthly fee for using their TradingView charts in my analysis.

GBP_CAD RISKY SETUP|LONG|
✅GBP_CAD is going down to retest
A horizontal support of 1.8320
Which makes me locally bullish biased
And I think that we will see a rebound
And a move up from the level
Towards the target above at 1.8380
LONG🚀
✅Like and subscribe to never miss a new idea!✅
Disclosure: I am part of Trade Nation's Influencer program and receive a monthly fee for using their TradingView charts in my analysis.

AUD-NZD Rebound Ahead! Buy!
Hello,Traders!
AUD-NZD made a retest
Of the wide horizontal support
Level again at 1.0909 and we
Are already seeing a bullish
Reaction so a local bullish
Rebound can be expected
Buy!
Comment and subscribe to help us grow!
Check out other forecasts below too!
Disclosure: I am part of Trade Nation's Influencer program and receive a monthly fee for using their TradingView charts in my analysis.

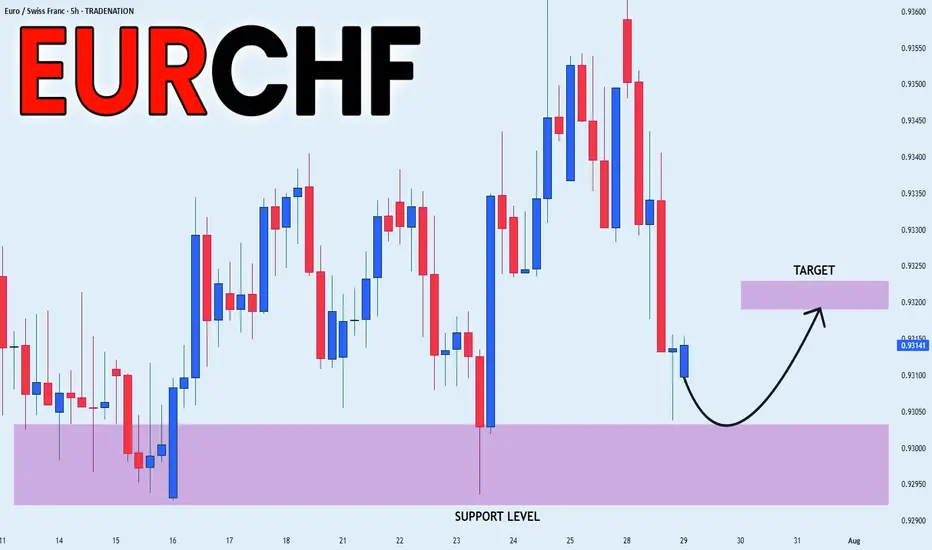
EUR_CHF RISKY LONG|
✅EUR_CHF is set to retest a
Strong support level below at 0.9300
After trading in a local downtrend for some time
Which makes a bullish rebound a likely scenario
With the target being a local resistance above at 0.9320
LONG🚀
✅Like and subscribe to never miss a new idea!✅
Disclosure: I am part of Trade Nation's Influencer program and receive a monthly fee for using their TradingView charts in my analysis.
CRUDE OIL Bullish Continuation! Buy!
Hello,Traders!
CRUDE OIL made a rebound
From the support just as
I predicted and the price
Went further still and broke
The key horizontal level
Of 66.50$ and the breakout
Is confirmed so we are
Bullish biased and we will be
Expecting a further bullish
Move up!
Buy!
Comment and subscribe to help us grow!
Check out other forecasts below too!
Disclosure: I am part of Trade Nation's Influencer program and receive a monthly fee for using their TradingView charts in my analysis.

DXY LOCAL SHORT|
✅DXY is going up now
But a strong resistance level is ahead at 98.948
Thus I am expecting a pullback
And a move down towards the target of 98.451
SHORT🔥
✅Like and subscribe to never miss a new idea!✅
Disclosure: I am part of Trade Nation's Influencer program and receive a monthly fee for using their TradingView charts in my analysis.

GOLD Epic Trendline Breakout! Sell!
Hello,Traders!
GOLD was trading along
A long-term trend-line but
It is broken now and the
Breakout is confirmed so
We are bearish biased now
And we will be expecting a
Further bearish move down
Sell!
Comment and subscribe to help us grow!
Check out other forecasts below too!
Disclosure: I am part of Trade Nation's Influencer program and receive a monthly fee for using their TradingView charts in my analysis.
