Bitcoin - Blue Skies, Retest Before $125k?Bitcoin has pushed into blue skies after breaking through a major resistance zone around 110,000 USD. The breakout was sharp and impulsive, pushing price well into uncharted territory above 117,000. At these levels, traditional resistance becomes harder to pinpoint, and the market often behaves irrationally, so caution is warranted. With all-time highs being challenged, any small retracement must be handled with precision.
Support and Retest Zones
The previous resistance zone between 109,000 and 111,000 has now turned into a potential support area. This level acted as a ceiling for weeks and was finally broken with strong momentum. Price already had a minor retest on the breakout candle, which offers a bullish sign of acceptance. However, a deeper retest of this same zone remains a valid possibility, especially if short-term profit-taking intensifies.
Trendline Confluence
Alongside the horizontal support, we have an ascending trendline that has guided price from the June lows. This trendline now intersects with the 111,000–113,000 area, offering a secondary potential bounce level. If Bitcoin holds the trendline, a shallower correction could be enough to reset before another rally. But if we break below it, the horizontal support remains the final stronghold before deeper downside risks emerge.
Short-Term Scenarios
There are two likely short-term paths here. Either Bitcoin continues higher without a deep pullback, targeting 120,000–125,000 directly, or we see one more sweep into the 111,000 area before the trend resumes. The first scenario would trap sidelined traders, forcing late entries at higher levels. The second would provide a clean retest of structure, fueling a healthier, more sustainable breakout.
Price Target and Expectations
Assuming the retest scenario plays out cleanly and price confirms support at either the trendline or the former resistance zone, upside targets sit around 120,000 as the next psychological barrier, with 125,000 as a likely extension. These are natural magnet levels in a trending environment, especially with momentum still intact from the previous breakout.
Conclusion
Bitcoin is currently in price discovery, which means the structure must guide our expectations. A retest of either the trendline or former resistance could provide the next best entry. As long as we hold above the green support zone, the bullish structure remains intact, and higher targets remain in sight.
Disclosure: I am part of Trade Nation's Influencer program and receive a monthly fee for using their TradingView charts in my analysis.
___________________________________
Thanks for your support!
If you found this idea helpful or learned something new, drop a like 👍 and leave a comment, I’d love to hear your thoughts! 🚀
Smartmoneyconcept

AUD_JPY IS OVERBOUGHT|SHORT|
✅AUD_JPY is trading in a strong
Uptrend but the pair is now
Locally overbought so after the
Pair hits the horizontal resistance
Level of 97.350 we will be expecting
A pullback and a bearish correction
On Monday!
SHORT🔥
✅Like and subscribe to never miss a new idea!✅
Disclosure: I am part of Trade Nation's Influencer program and receive a monthly fee for using their TradingView charts in my analysis.

GBP-CHF Bearish Breakout! Sell!
Hello,Traders!
GBP-CHF is trading in a strong
Downtrend and the pair
Broke the key horizontal
Level around 1.0780 which
Reinforces our bearish
Bias and we will be
Expecting a further
Bearish move down
On Monday!
Sell!
Comment and subscribe to help us grow!
Check out other forecasts below too!
Disclosure: I am part of Trade Nation's Influencer program and receive a monthly fee for using their TradingView charts in my analysis.

EUR_CAD GROWTH AHEAD|LONG|
✅EUR_CAD went down to retest
A horizontal support of 1.5964
Which makes me locally bullish biased
And I think that a move up
From the level is to be expected
Towards the target above at 1.6040
LONG🚀
✅Like and subscribe to never miss a new idea!✅
Disclosure: I am part of Trade Nation's Influencer program and receive a monthly fee for using their TradingView charts in my analysis.

EUR-AUD Bullish Bias! Buy!
Hello,Traders!
EUR-AUD went down but
A strong horizontal support
Level is below around 1.7690
And as the pair is trading in
An uptrend we will be expecting
A round and a move up
On Monday!
Buy!
Comment and subscribe to help us grow!
Check out other forecasts below too!
Disclosure: I am part of Trade Nation's Influencer program and receive a monthly fee for using their TradingView charts in my analysis.

EUR_NZD RESISTANCE AHEAD|SHORT|
✅EUR_NZD has been growing recently
And the pair seems locally overbought
So as the pair is approaching a horizontal resistance of 1.9500
Price decline is to be expected
SHORT🔥
✅Like and subscribe to never miss a new idea!✅
Disclosure: I am part of Trade Nation's Influencer program and receive a monthly fee for using their TradingView charts in my analysis.

USD-JPY Short From Resistance! Sell!
Hello,Traders!
USD-JPY keeps growing but
A strong horizontal resistance
Is ahead around 148.500
So after the retest we will
Be expecting a local
Bearish correction on Monday!
Sell!
Comment and subscribe to help us grow!
Check out other forecasts below too!
Disclosure: I am part of Trade Nation's Influencer program and receive a monthly fee for using their TradingView charts in my analysis.

GBP-USD Swing Long! Buy!
Hello,Traders!
GBP-USD is trading in a
Long-term uptrend along
The rising support support
Line and the pair will soon
Hit it and from there we will
Be expecting a bullish
Rebound on Monday
Buy!
Comment and subscribe to help us grow!
Check out other forecasts below too!
Disclosure: I am part of Trade Nation's Influencer program and receive a monthly fee for using their TradingView charts in my analysis.

EUR_USD STRONG UPTREND|LONG|
✅EUR_USD is trading in an uptrend
With the pair set to retest
The rising support line
From where I think the growth will continue
LONG🚀
✅Like and subscribe to never miss a new idea!✅
Disclosure: I am part of Trade Nation's Influencer program and receive a monthly fee for using their TradingView charts in my analysis.

CAD_JPY BULLISH BREAKOUT|LONG|
✅CAD_JPY broke the key
Structure level of 107.400
While trading in a strong uptrend
Which makes me bullish biased
And I think that after the retest of
The broken level is complete
A rebound and bullish continuation will follow
LONG🚀
✅Like and subscribe to never miss a new idea!✅
Disclosure: I am part of Trade Nation's Influencer program and receive a monthly fee for using their TradingView charts in my analysis.

AUD-CHF Local Long! Buy!
Hello,Traders!
AUD-CHF made a bullish
Breakout of the key horizontal
Level of 0.5221 which is now a
Support and the pair is going down
To retest the level from where
We will be expecting a
Further bullish move up
Buy!
Comment and subscribe to help us grow!
Check out other forecasts below too!
Disclosure: I am part of Trade Nation's Influencer program and receive a monthly fee for using their TradingView charts in my analysis.

GBP_AUD LONG FROM SUPPORT|
✅GBP_AUD fell down sharply
But a strong support level was hit at 2.0500
Thus I am expecting a rebound
And a move up towards the target of 2.0580
LONG🚀
✅Like and subscribe to never miss a new idea!✅
Disclosure: I am part of Trade Nation's Influencer program and receive a monthly fee for using their TradingView charts in my analysis.

EUR-JPY Will Keep Growing! Buy!
Hello,Traders!
EUR-JPY is trading in an
Uptrend and the pair already
Made a bullish rebound from
The rising support so we are
Bullish biased and we will
Be expecting a further
Bullish move up
Buy!
Comment and subscribe to help us grow!
Check out other forecasts below too!
Disclosure: I am part of Trade Nation's Influencer program and receive a monthly fee for using their TradingView charts in my analysis.

GOLD SWING LONG|
✅GOLD is trading in a strong
Long-term uptrend along the
Rising support line so we are
Bullish biased and after the price
Breakout of the local opening wedge
We we will be expecting a
Further bullish move up
LONG🚀
✅Like and subscribe to never miss a new idea!✅
Disclosure: I am part of Trade Nation's Influencer program and receive a monthly fee for using their TradingView charts in my analysis.

NZD-CHF Broken Wedge Pattern! Buy!
Hello,Traders!
NZD-CHF was trading in a
Narrowing bullish wedge pattern
And now we are finally seeing
A bullish breakout so we are
Bullish biased now and we
Will be expecting a further
Bullish move up after a
Local correction
Buy!
Comment and subscribe to help us grow!
Check out other forecasts below too!
Disclosure: I am part of Trade Nation's Influencer program and receive a monthly fee for using their TradingView charts in my analysis.

Bitcoin – Rejection Confirms Trap, Next Stop: $107kBitcoin attempted to take out the swing high around 110.5k but failed to clear the previous all-time high, resulting in a sharp rejection. This failure marks a significant turning point, suggesting a lack of bullish momentum at premium levels. The rejection came after a sweep of equal highs within a well-defined resistance zone, indicating a potential liquidity grab.
Highs Swept, But No Breakout
After dropping into support around the 107.5k region, price managed to push up and form a new swing high, but once again met heavy selling pressure after sweeping the prior equal highs. That sweep and the subsequent rejection give this structure the character of a classic liquidity trap, where smart money runs the highs only to reverse.
Weak Lows Below
The support zone has now been tapped multiple times, and the most recent low is structurally weak. It failed to produce a higher high, which makes it vulnerable to a clean stop hunt. Given this context, these lows are likely to be targeted next, as price seeks out sell-side liquidity resting beneath.
Expected Path Forward
I’m expecting further downside to unfold from here. The rejection from resistance, paired with the weak internal structure, suggests Bitcoin will take out the weak lows near 107.5k. Once those lows are swept, I expect a bullish reaction from the same demand zone, setting up a potential long opportunity back into the 109k–110k area. The plan is to look for signs of a reversal after the sweep, such as a 5M market structure shift or a fair value gap entry setup.
Liquidity Map and Trade Plan
The current price action is best viewed through the lens of liquidity. The highs were engineered to trap breakout buyers and then rejected. Now, the weak lows offer the next logical draw on liquidity. My focus is on short-term downside targeting that 107.2k–107.5k support region, followed by a potential bullish reversal setup once that liquidity is cleared.
Conclusion
This is a clean example of a failed breakout, followed by engineered liquidity moves in both directions. As long as price respects the current structure, my bias remains short into the weak lows, followed by a high-probability long setup once those lows are swept and the market shifts.
Disclosure: I am part of Trade Nation's Influencer program and receive a monthly fee for using their TradingView charts in my analysis.
___________________________________
Thanks for your support!
If you found this idea helpful or learned something new, drop a like 👍 and leave a comment, I’d love to hear your thoughts! 🚀

AUD_CAD WILL KEEP GROWING|LONG|
✅AUD_CAD is going up
Now and the pair made a bullish
Breakout of the key horizontal
Level of 0.8980 and the breakout
Is confirmed so we are bullish
Biased and we will be expecting
A further bullish move up
LONG🚀
✅Like and subscribe to never miss a new idea!✅
Disclosure: I am part of Trade Nation's Influencer program and receive a monthly fee for using their TradingView charts in my analysis.

EUR-USD Bullish Bias! Buy!
Hello,Traders!
EUR-USD is trading in an
Uptrend and the pair is
Making a local bearish correction
But we are bullish biased and
After the retest of the horizontal
Support of 1.1640
We will be expecting a further
Bullish move up
Buy!
Comment and subscribe to help us grow!
Check out other forecasts below too!
Disclosure: I am part of Trade Nation's Influencer program and receive a monthly fee for using their TradingView charts in my analysis.

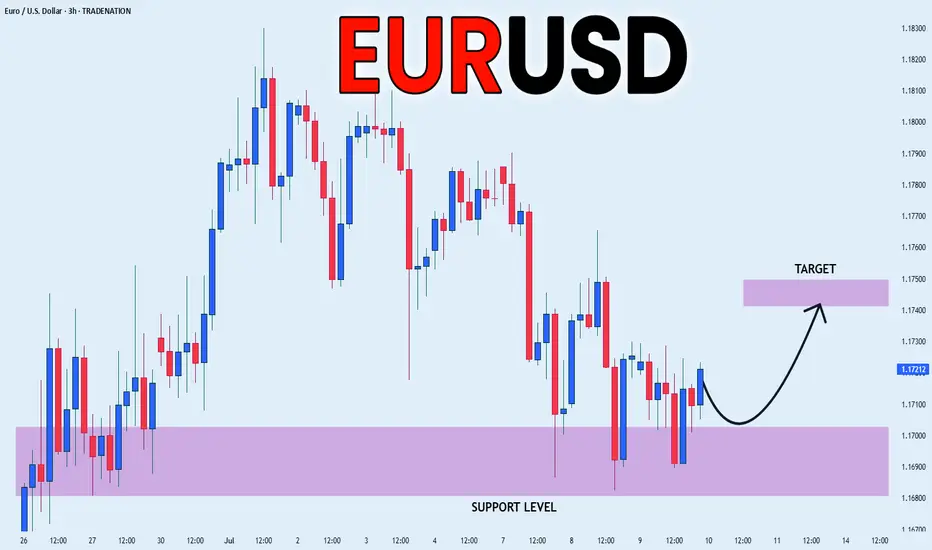
EUR_USD LOCAL REBOUND|LONG|
✅EUR_USD has retested a key support level of 1.1690
And as the pair is already making a bullish rebound
A move up to retest the supply level above at 1.1744 is likely
LONG🚀
✅Like and subscribe to never miss a new idea!✅
Disclosure: I am part of Trade Nation's Influencer program and receive a monthly fee for using their TradingView charts in my analysis.
NATGAS Support Ahead! Buy!
Hello,Traders!
NATGAS keeps falling but
The price will soon hit a
Horizontal support of 2.90$
From where we will be expecting
A local bullish rebound
Buy!
Comment and subscribe to help us grow!
Check out other forecasts below too!
Disclosure: I am part of Trade Nation's Influencer program and receive a monthly fee for using their TradingView charts in my analysis.

CAD_CHF STRONG SUPPORT|LONG|
✅CAD_CHF has been falling recently
And the pair seems locally oversold
So as the pair is approaching a
Horizontal support of 0.5790
Price growth is to be expected
LONG🚀
✅Like and subscribe to never miss a new idea!✅
Disclosure: I am part of Trade Nation's Influencer program and receive a monthly fee for using their TradingView charts in my analysis.

AUD-NZD Short From Resistance! Sell!
Hello,Traders!
AUD-NZD keeps growing
And the pair is overbought
So after it hits the horizontal
Resistance of 1.0921 from
Where we will be expecting
A local bearish correction
Sell!
Comment and subscribe to help us grow!
Check out other forecasts below too!
Disclosure: I am part of Trade Nation's Influencer program and receive a monthly fee for using their TradingView charts in my analysis.

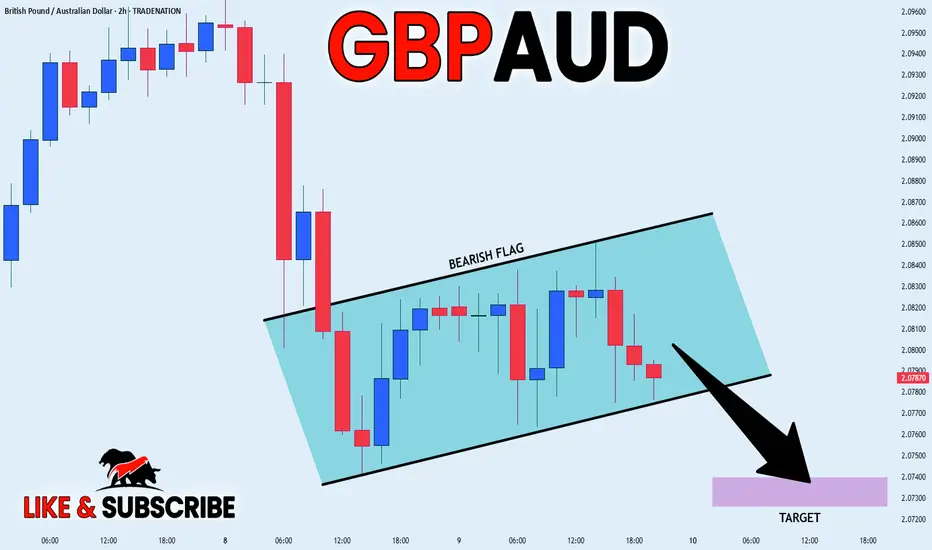
GBP_AUD BEARISH FLAG|SHORT|
✅GBP_AUD is going down now
And the pair has formed
A bearish flag pattern
Which makes me bearish biased
And after the breakout
I believe we will see bearish continuation
SHORT🔥
✅Like and subscribe to never miss a new idea!✅
Disclosure: I am part of Trade Nation's Influencer program and receive a monthly fee for using their TradingView charts in my analysis.