USD_CHF SHORT FROM RESISTANCE|
✅USD_CHF has been growing recently
And the pair seems locally overbought
So as the pair is approaching
A horizontal resistance of 0.8064
Price decline is to be expected
SHORT🔥
✅Like and subscribe to never miss a new idea!✅
Disclosure: I am part of Trade Nation's Influencer program and receive a monthly fee for using their TradingView charts in my analysis.
Smartmoneyconcepts

USD-JPY Is Overbought! Sell!
Hello,Traders!
USD-JPY is trading in a
Strong uptrend and the pair
Will soon hit a horizontal
Resistance of 149.200
So after the retest a
Local bearish pullback
Is to be expected
Sell!
Comment and subscribe to help us grow!
Check out other forecasts below too!
Disclosure: I am part of Trade Nation's Influencer program and receive a monthly fee for using their TradingView charts in my analysis.

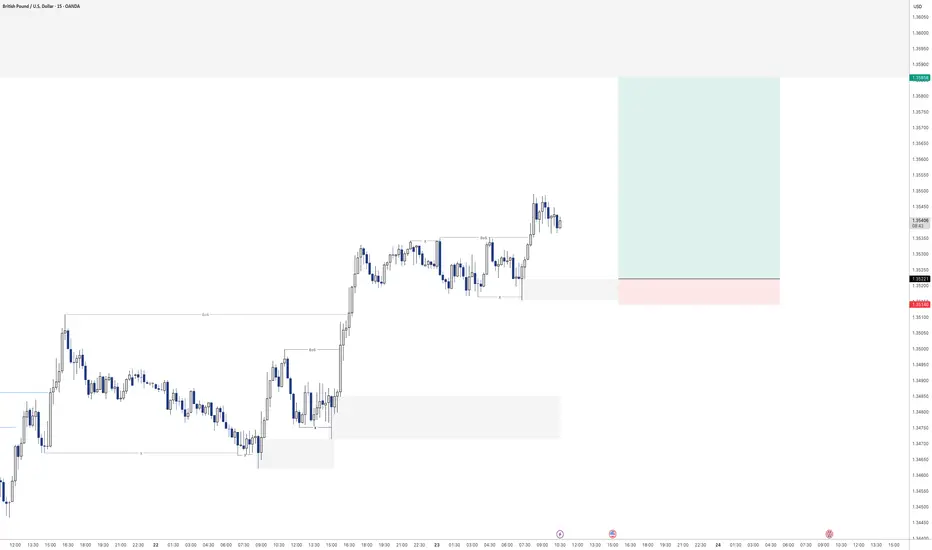
GBP_USD BEARISH BREAKOUT|SHORT|
✅GBP_USD is going down currently
As the pair broke the key structure level of 1.3380
Which is now a resistance, and after the pullback
And retest, I think the price will go further down
SHORT🔥
✅Like and subscribe to never miss a new idea!✅
Disclosure: I am part of Trade Nation's Influencer program and receive a monthly fee for using their TradingView charts in my analysis.

EUR-USD Support Ahead! Buy!
Hello,Traders!
EUR-USD is making a massive
Bearish correction and the pair
Is already locally oversold
So after it hits a horizontal
Support level below at 1.1568
We will be expecting a local
Bullish rebound
Buy!
Comment and subscribe to help us grow!
Check out other forecasts below too!
Disclosure: I am part of Trade Nation's Influencer program and receive a monthly fee for using their TradingView charts in my analysis.

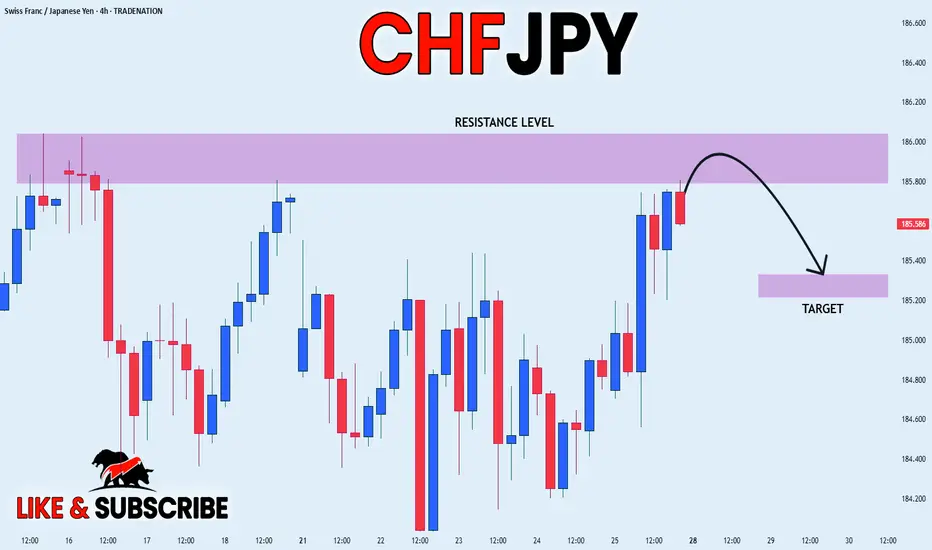
CHF-JPY Short From Resistance! Sell!
Hello,Traders!
CHF-JPY keeps trading in
An uptrend and the pair
Is locally overbought so after
The pair hits the horizontal
Resistance level of 186.000
We will be expecting a local
Bearish correction
Sell!
Comment and subscribe to help us grow!
Check out other forecasts below too!
Disclosure: I am part of Trade Nation's Influencer program and receive a monthly fee for using their TradingView charts in my analysis.

CHF_JPY RISKY SHORT|
✅CHF_JPY is going up now
But a strong resistance level is ahead at 186.036
Thus I am expecting a pullback
And a move down towards the target of 185.329
SHORT🔥
✅Like and subscribe to never miss a new idea!✅
Disclosure: I am part of Trade Nation's Influencer program and receive a monthly fee for using their TradingView charts in my analysis.
SILVER SUPPORT AHEAD|LONG|
✅SILVER has been falling recently
And Silver seems locally oversold
So as the pair is approaching
A horizontal support of 37.80$
Price growth is to be expected
LONG🚀
✅Like and subscribe to never miss a new idea!✅
Disclosure: I am part of Trade Nation's Influencer program and receive a monthly fee for using their TradingView charts in my analysis.

CAD-CHF Local Rebound Ahead! Buy!
Hello,Traders!
CAD-CHF made a retest
Of the horizontal support
At 0.5797 from where we
Are already seeing a bullish
Reaction so we will be
Expecting a further local
Bullish move up
Buy!
Comment and subscribe to help us grow!
Check out other forecasts below too!
Disclosure: I am part of Trade Nation's Influencer program and receive a monthly fee for using their TradingView charts in my analysis.

EUR_JPY WILL GROW|LONG|
✅EUR_JPY will keep growing
Because the pair is in the uptrend
And recently broke the key level of 173.200
So we will be expecting
Bullish continuation
LONG🚀
✅Like and subscribe to never miss a new idea!✅
Disclosure: I am part of Trade Nation's Influencer program and receive a monthly fee for using their TradingView charts in my analysis.

EUR-GBP Swing Short! Sell!
Hello,Traders!
EUR-GBP keeps growing in
A strong uptrend but the pair
Is locally overbought so after
The price hits a horizontal
Resistance level of 0.8764
We will be expecting a
Local bearish correction
Sell!
Comment and subscribe to help us grow!
Check out other forecasts below too!
Disclosure: I am part of Trade Nation's Influencer program and receive a monthly fee for using their TradingView charts in my analysis.

EUR_CAD LOCAL SHORT|
✅EUR_CAD is going up to retest
A horizontal resistance of 1.6110
Which makes me locally bearish biased
And I think that we will see a pullback
And a move down from the level
Towards the target below at 1.6077
SHORT🔥
✅Like and subscribe to never miss a new idea!✅
Disclosure: I am part of Trade Nation's Influencer program and receive a monthly fee for using their TradingView charts in my analysis.

GBP_USD LONG FROM SUPPORT|
✅GBP_USD has been falling recently
And the pair seems locally oversold
So as the pair is approaching
A horizontal support of 1.3399
Price growth is to be expected
LONG🚀
✅Like and subscribe to never miss a new idea!✅
Disclosure: I am part of Trade Nation's Influencer program and receive a monthly fee for using their TradingView charts in my analysis.

EURUSD - Next Buy Zone? This one has some nice potential
We will see how it plays out if we get tagged in

NZD_CAD POTENTIAL SHORT|
✅NZD_CAD has been growing recently
And the pair seems locally overbought
So as the pair is approaching
A horizontal resistance of 0.8260
Price decline is to be expected
SHORT🔥
✅Like and subscribe to never miss a new idea!✅
Disclosure: I am part of Trade Nation's Influencer program and receive a monthly fee for using their TradingView charts in my analysis.

NZD_JPY SHORT FROM RESISTANCE|
✅NZD_JPY is going up now
But a strong resistance level is ahead at 88.900
Thus I am expecting a pullback
And a move down towards the target of 88.572
SHORT🔥
✅Like and subscribe to never miss a new idea!✅
Disclosure: I am part of Trade Nation's Influencer program and receive a monthly fee for using their TradingView charts in my analysis.

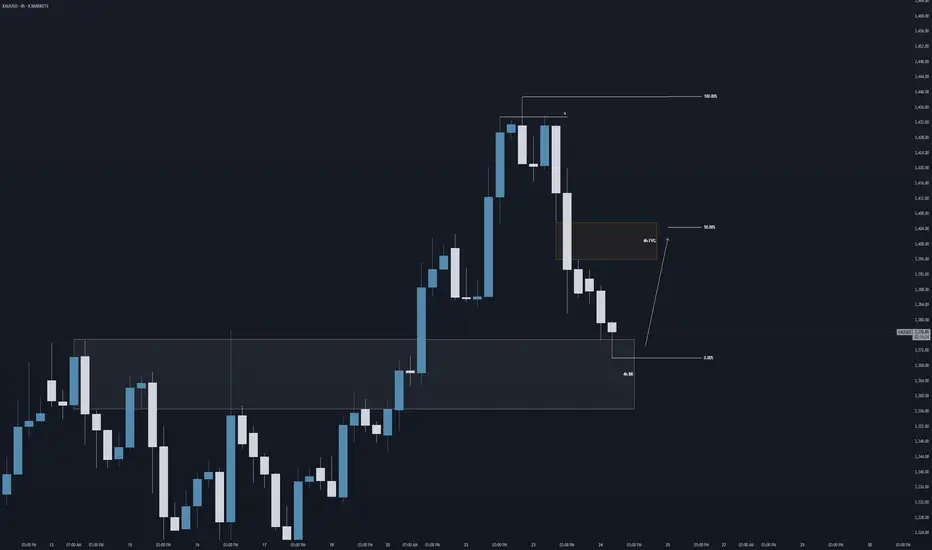
Bullish Leg on Gold? Good morning traders,
Here is my forecast on the 4h chart for Gold.
We could potentially see a bullish leg if this 4h breaker block price area holds as support. And could see a retracement towards buyside imbalance in the form of a 4h FVG (Fair Value Gap) at around equilibrium (50%) towards $3,400.
Regards,
Aman
GBPUSD - Next buy from demandLooking here for potential further buying momentum to the upside.
Will see how this plays out tomorrow

AUD_USD BULLISH BREAKOUT|LONG|
✅AUD_USD is going up
Now and the pair made a bullish
Breakout of the key horizontal
Level of 0.6590 and the breakout
Is confirmed so we are bullish
Biased and we will be expecting
A further bullish move up
LONG🚀
✅Like and subscribe to never miss a new idea!✅
Disclosure: I am part of Trade Nation's Influencer program and receive a monthly fee for using their TradingView charts in my analysis.

GOLD LOCAL LONG|
✅GOLD went down from
The resistance just as I predicted
But a strong support level is ahead at 3380$
Thus I am expecting a rebound
And a move up towards the target of 3400$
LONG🚀
✅Like and subscribe to never miss a new idea!✅
Disclosure: I am part of Trade Nation's Influencer program and receive a monthly fee for using their TradingView charts in my analysis.

NZD-JPY Resistance Ahead! Sell!
Hello,Traders!
NZD-JPY is trading in an
Uptrend but the pair is locally
Overbought so after the pair
Hits the horizontal resistance
Level of 88.900 we will be
Expecting a local bearish
Move down
Sell!
Comment and subscribe to help us grow!
Check out other forecasts below too!
Disclosure: I am part of Trade Nation's Influencer program and receive a monthly fee for using their TradingView charts in my analysis.

CAD-JPY Local Long! Buy!
Hello,Traders!
CAD-JPY made a retest
Of the horizontal support
Level of 107.400 and we
Are already seeing a bullish
Rebound and we will be
Expecting a further local
Bullish move up
Buy!
Comment and subscribe to help us grow!
Check out other forecasts below too!
Disclosure: I am part of Trade Nation's Influencer program and receive a monthly fee for using their TradingView charts in my analysis.

Simple Swing Trading Strategy with Smart Money Concept Explained
I will share with you the essential basics of swing trading forex gold with Smart Money Concepts.
You will learn how to do swing trading with the best SMC strategy.
I will teach you to c ombine order blocks, liquidity zones and imbalances to spot accurate entries and confirmation signals.
If you just started learning swing trading Forex with Smart Money Concepts, I strictly recommend trading with the trend only.
The cases and examples that we will discuss will be strictly trend-following ones.
Swing Trading with SMC in Uptrend
For swing buying any forex pair, we will look for the market that is trading in a bullish trend.
To confirm that the market is rising, you will need to execute structure mapping and find a forex pair that updates Higher Highs HH and Higher Lows HL.
Above is the example how I confirmed that GBPUSD is bullish with structure mapping. You can see that the pair consistently updates the highs.
Once you identified a bullish pair, your next step will be to find the zone from where the next swing move will follow.
According to the rules, the market remains in uptrend till the price is staying above or on the level of the last Higher Low HL.
Here is such a zone on GBPUSD.
It is based on the last Higher Low and current price levels.
We will assume that buying orders will concentrate within that area and from that a bullish rally will follow.
The problem is that this area is extremely wide, and we can not just buy randomly within.
Our next step will be to find liquidity zones within.
To buy, we need demand areas.
I found 4 price action based historic demand zones on GBPUSD.
We will need to wait for the test of one of these zones and then wait for an order block - a place where smart money are placing their buy orders.
The problem is that we don't know in which of these areas the order block is, so we will need to wait for tests of these zones and a consequent imbalance to confirm it.
To confirm a bullish imbalance for swing trading Forex, I recommend analyzing a 4H time frame after a test of a demand zone.
According to Smart Money Concepts, a bullish imbalance can be any sign of strength of the buyers : bullish breakout of a vertical/horizontal resistance, change of character, high momentum bullish candle, bullish price action pattern, etc.
An order block on GBPUSD was confirmed with a breakout of a resistance line of a falling channel on a 4H time frame.
That was the signal that Smart Money are buying, and that is your signal to open a swing long trade.
You place a buy position then with a stop loss below the order block and a target - at least a current high.
Swing Trading with SMC in Downtrend
For swing selling any forex pair, you will need to find a market that is trading in a bearish trend.
I suggest applying structure mapping to identify such a pair.
It simply should update Lower Lows LL and Lower Highs consistently.
USDCAD is trading in a bearish trend.
Structure mapping helps to easily confirm that.
Then, we will need to identify the zone from where the next bearish wave will start.
According to Smart Money Concepts structure mapping rules, the market remains bearish till the price is staying below or on the level of the last Lower High LH.
That's such a zone on USDCAD.
It is based on current prices and the last Lower High.
We will assume that selling orders will be distributed along the entire lenth of our zone.
Of course, we can not sell randomly within that zone because it is relatively extended.
Our next task will be to find liquidity supply zones within.
I found 2 price action based supply zones within our underlined area.
Before we sell, we will need to find an order block.
A place from where smart money are selling big.
To spot that, I suggest waiting for a test of one of our supply zones and wait for a bearish imbalance on a 4H time frame.
According to SMC, a bearish imbalance can be a bearish high momentum candle, a bearish CHoCH, a bearish price action pattern, a bearish breakout of a horizontal/vertical support , etc.
You can see that a lower supply zone was tested on USDCAD.
Our bearish order block confirmation is a bearish Change of Character, a formation of a high momentum bearish candle and a breakout of a rising trend line.
After that we can open a swing sell position and expect a bearish movement at least to a current low.
Stop loss should lie strictly above the order block.
TP should be at least a c urrent low.
That is how a trade should be executed on USDCAD pair.
Remember that there is no guarantee that the order block will be within a liquidity zone. You should learn to track the signs of smart money and their operations.
A proper combination of a trend analysis, liquidity zones and order block is the essential basis of a profitable swing trading Forex.
Mastering that, practice recognizing the imbalances and confirmations for spotting the best swing trading entries.
❤️Please, support my work with like, thank you!❤️
I am part of Trade Nation's Influencer program and receive a monthly fee for using their TradingView charts in my analysis.
GBPUSD - Buying continuationLooking to keep buying the bullish orderflow on the 15min.
Had a nice sweep of liquidity before creating a new high. Will see how this one plays out over the day