GBP_CHF LONG SIGNAL|
✅GBP_CHF is trading in an uptrend
Along the rising support line
Which makes me bullish biased
And the pair is about to retest the rising support
Thus, a rebound and a move up is expected
So we can enter a long trade with
The TP of 1.1410 and SL of 1.1350
LONG🚀
✅Like and subscribe to never miss a new idea!✅
Disclosure: I am part of Trade Nation's Influencer program and receive a monthly fee for using their TradingView charts in my analysis.
Smartmoneyconcepts
TRADE IDEAS: ES FUTURES (ESM2025) – 3/26/2025 PLAYBOOK# 📊 TRADE IDEAS: ES FUTURES (ESM2025) – 3/26/2025 PLAYBOOK
## 🟢 SCENARIO 1 (BULLISH)
**DIRECTION:** Long
**STRUCTURE BIAS:** Bullish
**ENTRY LEVEL:** 5,795-5,815 (current zone, buying sell-side liquidity raids)
**STOP LEVEL:** 5,785 (invalidate if hourly close below this level)
**TARGET LEVELS:**
- **Target 1:** 5,880-5900 (Weekly Key High Resistance Level)
**R/R RATIO:** ~3:1 (depending on final execution)
### EXECUTION STRATEGY
- **Entry Confirmation:** Look for price to raid previous unhit weekly lows (sell-side liquidity)
- **Long Entries:** Establish long positions as price successfully raids these lows but fails to sustain below them
- **Stop Placement:** Use 5,785 as a hard stop (hourly close below invalidates the trade idea)
- **Target:** Take profits at 5880 - 5,900 (Weekly Key High Resistance)
### KEY POINTS
- Current price action targeting sell-side liquidity in the form of previous unhit weekly lows
- Wednesday typically not a low/high of week formation day, suggesting potential for continued movement
- Tomorrow's High Impact News Event (GDP at 8:30 AM) likely to create volatility and could accelerate the move
- Bullish structure prevails as long as price maintains above liquidity raid zones
---
## 🔴 SCENARIO 2 (BEARISH)
**DIRECTION:** Short
**STRUCTURE BIAS:** Bearish after bullish extension
**ENTRY LEVEL:** 5,880-5910 (Weekly Key High Resistance Level)
**STOP LEVEL:** 5,9550 (invalidate if hourly close above this level)
**TARGET LEVELS:**
- **Target 1:** 5,740 (Weekly Opening Gap upper boundary)
**R/R RATIO:** ~3:1 (depending on final execution)
### EXECUTION STRATEGY
- **No Immediate Short:** Wait for price to extend to Weekly Key High Resistance Level (blue line ~5,900)
- **Rejection Confirmation:** Look for reversal candles and selling pressure at resistance
- **Short Entries:** Establish short positions once price trades below confirmation level after testing resistance
- **Stop Placement:** Use 5,925-5950 as a hard stop (hourly close above invalidates the trade idea)
- **Scaling Out:** Partial profit near 5,800, hold remaining for potential move to 5,745 area
### KEY POINTS
- After liquidity is taken at the Weekly Key High Resistance (blue line), expect manipulation and reversal
- Short opportunity emerges only after bulls exhaust momentum at key resistance
- Weekly Opening Gap (red zone) remains a significant downside target for next move
- Any sustained hourly close above 5,965 **invalidates** this bearish setup
## MARKET BIAS
- **SHORT TERM (Today – 1 Day):**
- **Bullish** bias as price is likely to find support at current levels and move toward the Weekly Key High Resistance
- Current price action suggests accumulation before a move higher
- Tomorrow's GDP numbers (8:30 AM) represent a potential catalyst for accelerated movement
- **LONGER TERM (1–2 Weeks):**
- After testing the Weekly Key High Resistance level (~5,900), expect a reversal and move back toward the Weekly Opening Gap (red zone)
- Market structure suggests a "liquidity hunt" pattern – first to the upside, then reversing to the downside
- Major liquidity draw currently at the blue line, once exhausted, focus will shift back to the Weekly Opening Gap
SPY WILL FALL|SHORT|
✅SPY has hit a key structure level of 577.50$
Which implies a high likelihood of a move down
As some market participants will be taking profit from their long positions
While others will find this price level to be good for selling
So as usual we will have a chance to ride the wave of a bearish correction
SHORT🔥
✅Like and subscribe to never miss a new idea!✅
Disclosure: I am part of Trade Nation's Influencer program and receive a monthly fee for using their TradingView charts in my analysis.
USOIL SHORT FROM RESISTANCE|
✅CRUDE OIL has hit a TP
Of our last free signal and
Went further up just as we
Predicted but will soon hit
A horizontal resistance level
Of 70.57$ from where we will
Be expecting a local bearish
Correction and a move down
SHORT🔥
✅Like and subscribe to never miss a new idea!✅
Disclosure: I am part of Trade Nation's Influencer program and receive a monthly fee for using their TradingView charts in my analysis.
USD_CAD LOCAL LONG|
✅USD_CAD fell again to
Retest the support of 1.4420
But it is a strong key level
So I think that there is a high chance
We will see a bullish rebound and a move up
LONG🚀
✅Like and subscribe to never miss a new idea!✅
Disclosure: I am part of Trade Nation's Influencer program and receive a monthly fee for using their TradingView charts in my analysis.
NIKKEI INDEX BEARISH BIAS|SHORT|
✅NIKKEI is going up now
But a strong resistance level is ahead at 38,400
Thus I am expecting a pullback
And a move down towards the target of 37,530
SHORT🔥
✅Like and subscribe to never miss a new idea!✅
Disclosure: I am part of Trade Nation's Influencer program and receive a monthly fee for using their TradingView charts in my analysis.
USD-CAD Long From Support! Buy!
Hello,Traders!
USD-CAD made a retest of
The horizontal support level
Of 1.4256 and we are already
Seeing a bullish rebound so
We will be expecting a
Further bullish move up
Buy!
Comment and subscribe to help us grow!
Check out other forecasts below too!
Disclosure: I am part of Trade Nation's Influencer program and receive a monthly fee for using their TradingView charts in my analysis.
CAD_JPY POTENTIAL LONG|
✅CAD_JPY made a bullish
Breakout of the key horizontal
Level of 104.800 and the breakout
Is confirmed which reinforces our
Bullish bias and makes us expect
A further move up after the
Retest of the new support
LONG🚀
✅Like and subscribe to never miss a new idea!✅
Disclosure: I am part of Trade Nation's Influencer program and receive a monthly fee for using their TradingView charts in my analysis.
NZD-CAD Risky Long! Buy!
Hello,Traders!
NZD-CAD made a retest
Of the horizontal support
Of 0.8170 and we are already
Seeing a bullish rebound
So we are bullish biased
And we will be expecting
A further bullish move up
Buy!
Comment and subscribe to help us grow!
Check out other forecasts below too!
Disclosure: I am part of Trade Nation's Influencer program and receive a monthly fee for using their TradingView charts in my analysis.
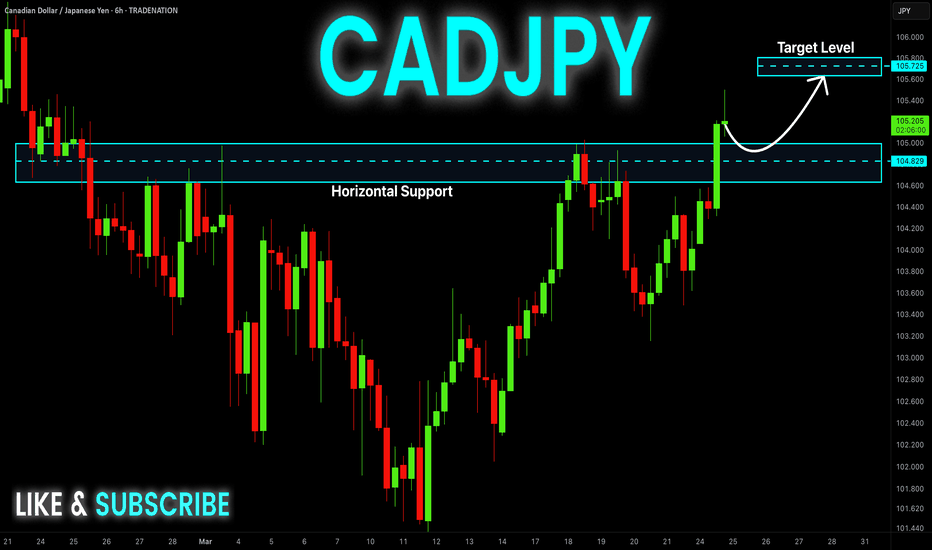
CAD-JPY Bullish Breakout! Buy!
Hello,Traders!
CAD-JPY is trading in a
Local uptrend and the pair
Made a nice bullish breakout
Of the key horizontal level
Of 104.829 which is now
A support and the breakout
Is confirmed so we are
Locally bullish biased and
We will be expecting a
Further bullish move up
Buy!
Comment and subscribe to help us grow!
Check out other forecasts below too!
Disclosure: I am part of Trade Nation's Influencer program and receive a monthly fee for using their TradingView charts in my analysis.
NZD_USD SUPPORT AHEAD|LONG|
✅NZD_USD is set to retest a
Strong support level below at 0.5690
After trading in a local downtrend from some time
Which makes a bullish rebound a likely scenario
With the target being a local resistance above at 0.5750
LONG🚀
✅Like and subscribe to never miss a new idea!✅
Disclosure: I am part of Trade Nation's Influencer program and receive a monthly fee for using their TradingView charts in my analysis.
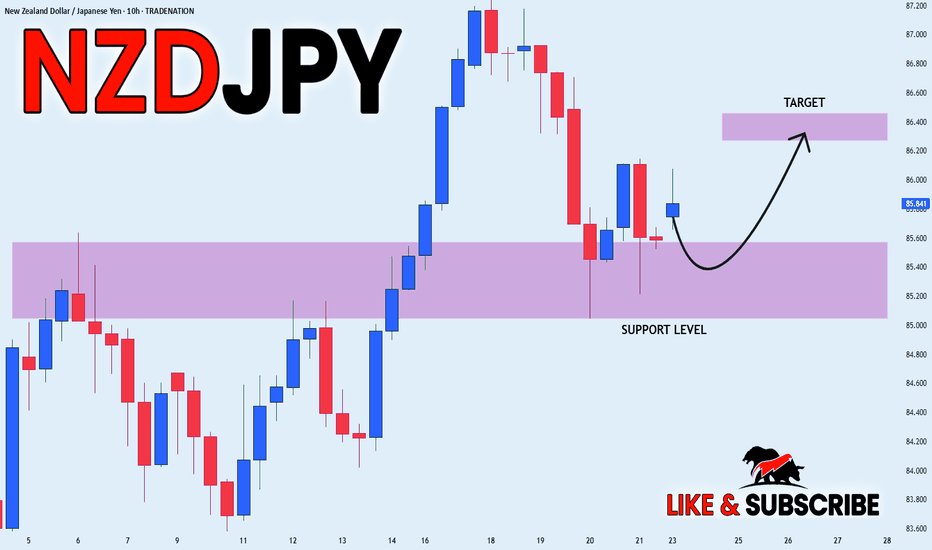
NZD_JPY WILL GO UP|LONG|
✅NZD_JPY has retested a key support level of 85.200
And as the pair is already making a bullish rebound
A move up to retest the supply level above at 86.400 is likely
LONG🚀
✅Like and subscribe to never miss a new idea!✅
Disclosure: I am part of Trade Nation's Influencer program and receive a monthly fee for using their TradingView charts in my analysis.
NZD_CHF RISKY LONG|
✅NZD_CHF is going down to retest a horizontal support of 0.5050
Which makes me locally bullish biased
And I think that we will see a rebound
And a move up from the level
Towards the target above at 0.5073
LONG🚀
✅Like and subscribe to never miss a new idea!✅
Disclosure: I am part of Trade Nation's Influencer program and receive a monthly fee for using their TradingView charts in my analysis.
GOLD Risky Short! Sell!
Hello,Traders!
GOLD made a rebound
From the support and went
Up but will now retest a
Local horizontal level
Of 3030$ from where
We will be expecting
A local bearish reaction
Sell!
Comment and subscribe to help us grow!
Check out other forecasts below too!
Disclosure: I am part of Trade Nation's Influencer program and receive a monthly fee for using their TradingView charts in my analysis.
AUD-CAD Bearish Breakout! Sell!
Hello,Traders!
AUD-CAD made a bearish
Breakout of the key horizontal
Level of 0.9022 which is now
A resistance and the breakout
Is confirmed so we are bearish
Biased and we will be expecting
A further move down
Sell!
Comment and subscribe to help us grow!
Check out other forecasts below too!
Disclosure: I am part of Trade Nation's Influencer program and receive a monthly fee for using their TradingView charts in my analysis.
USD_CHF SHORT FROM RESISTANCE|
✅USD_CHF is going up now
But a strong resistance level is ahead at 0.8866
Thus I am expecting a pullback
And a move down towards the target of 0.8810
SHORT🔥
✅Like and subscribe to never miss a new idea!✅
Disclosure: I am part of Trade Nation's Influencer program and receive a monthly fee for using their TradingView charts in my analysis.
GBPUSD – Bearish Setup Forming | Fair Value Gap Rejection PlayThe 4H chart on GBP/USD shows a clean bearish market structure, with price currently in a corrective phase after recent downside momentum. A Fair Value Gap (FVG) has been identified between the 1.29700–1.30000 range, which acts as a key supply zone for potential short setups.
📊 Technical Breakdown
1. Fair Value Gap (FVG)
A visible imbalance was left after an aggressive bearish move—marked in the yellow zone.
Price is expected to retrace into this inefficient zone to fill orders before continuing downward.
The anticipated entry for shorts is around 1.29798, near the midpoint of the FVG.
2. Bearish Market Structure
Lower highs and lower lows dominate the current structure.
The bounce is corrective in nature and lacks momentum, indicating a potential bull trap.
Expecting a short-term retracement up to the FVG zone, followed by a continuation to the downside.
3. Target Zone
Target: 1.28042 — this level sits just above a previous demand zone, making it a natural TP1.
This area also overlaps with previous price reactions, giving it high confluence.
🧠 Trade Idea
Entry: ~1.29798 (within the FVG)
Target: 1.28042
Risk Management : A stop loss above 1.30000 or above the upper boundary of the FVG to account for false breaks.
Rationale: Risk-reward is favorable due to tight invalidation zone and strong downside continuation probability.
⚠️ Key Notes
Watch for confirmation at the FVG zone such as bearish engulfing or lower timeframe break of structure.
If price breaks above 1.3000 and holds, the idea will be invalidated.
USD-JPY Move Down Ahead! Sell!
Hello,Traders!
USD-JPY is trading in a
Downtrend below the falling
Resistance line and the pair
Will soon hit the resistance
From where we will be
Expecting a further move down
Sell!
Comment and subscribe to help us grow!
Check out other forecasts below too!
Disclosure: I am part of Trade Nation's Influencer program and receive a monthly fee for using their TradingView charts in my analysis.
DAX WILL GO UP|LONG|
✅DAX is trading in an uptrend
Along the rising support line
Which makes me bullish biased
And the index is about to retest the rising support
Thus, a rebound and a move up is expected
With the target of retesting the level above at 23,200
LONG🚀
✅Like and subscribe to never miss a new idea!✅
Disclosure: I am part of Trade Nation's Influencer program and receive a monthly fee for using their TradingView charts in my analysis.
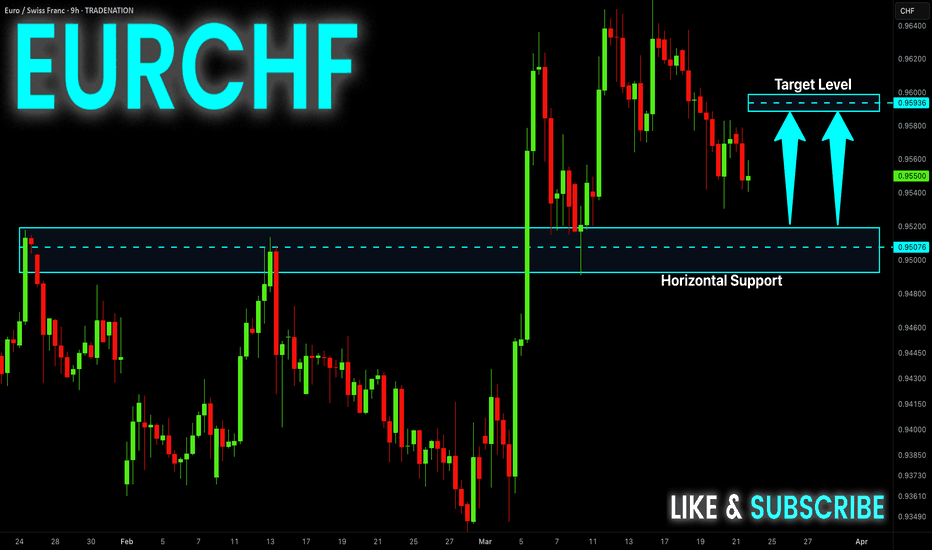
EUR-CHF First Down, Then UP! Buy!
Hello,Traders!
EUR-CHF keeps falling down
After making it through the
Local structure of 0.9580
So we think that the pair will
First fall further down to
Retest the horizontal support
Of 0.9507 and after that
We will see a rebound and
A new wave of growth
Buy!
Comment and subscribe to help us grow!
Check out other forecasts below too!
Disclosure: I am part of Trade Nation's Influencer program and receive a monthly fee for using their TradingView charts in my analysis.
DAX Growth Ahead! Buy!
Hello,Traders!
DAX is going down
And will soon retest the
Rising support and after
The retest we will be
Expecting a bullish rebound
Because we are bullish biased
Buy!
Comment and subscribe to help us grow!
Check out other forecasts below too!
Disclosure: I am part of Trade Nation's Influencer program and receive a monthly fee for using their TradingView charts in my analysis.
AUD_USD RISING SUPPORT AHEAD|LONG|
✅AUD_USD is trading along the rising support
And as the pair will soon retest it
I am expecting the price to go up
To retest the supply levels above at 0.6300
LONG🚀
✅Like and subscribe to never miss a new idea!✅
Disclosure: I am part of Trade Nation's Influencer program and receive a monthly fee for using their TradingView charts in my analysis.
EUR_CHF SUPPORT AHEAD|LONG|
✅EUR_CHF will be retesting a support level of 0.9500 soon
From where I am expecting a bullish reaction
With the price going up but we need
To wait for a reversal pattern to form
Before entering the trade, so that we
Get a higher success probability of the trade
LONG🚀
✅Like and subscribe to never miss a new idea!✅
Disclosure: I am part of Trade Nation's Influencer program and receive a monthly fee for using their TradingView charts in my analysis.


