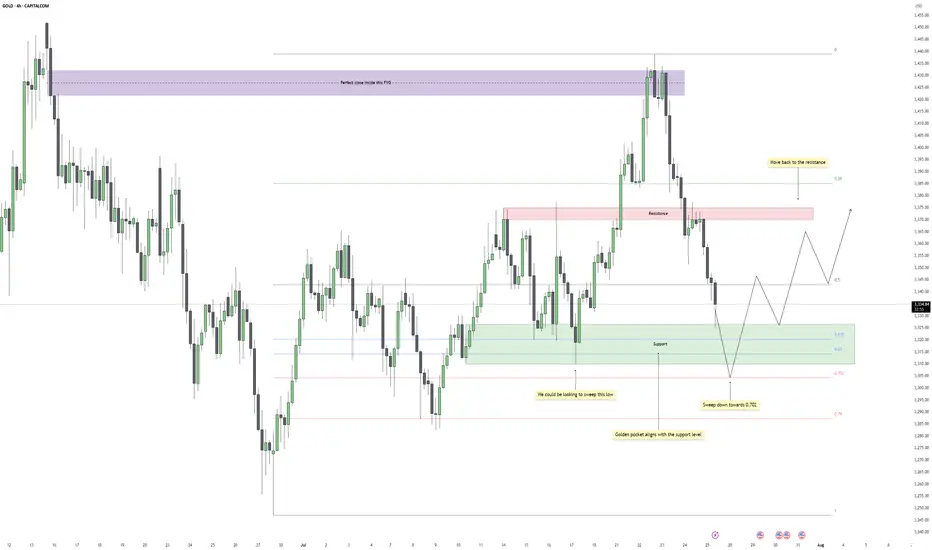
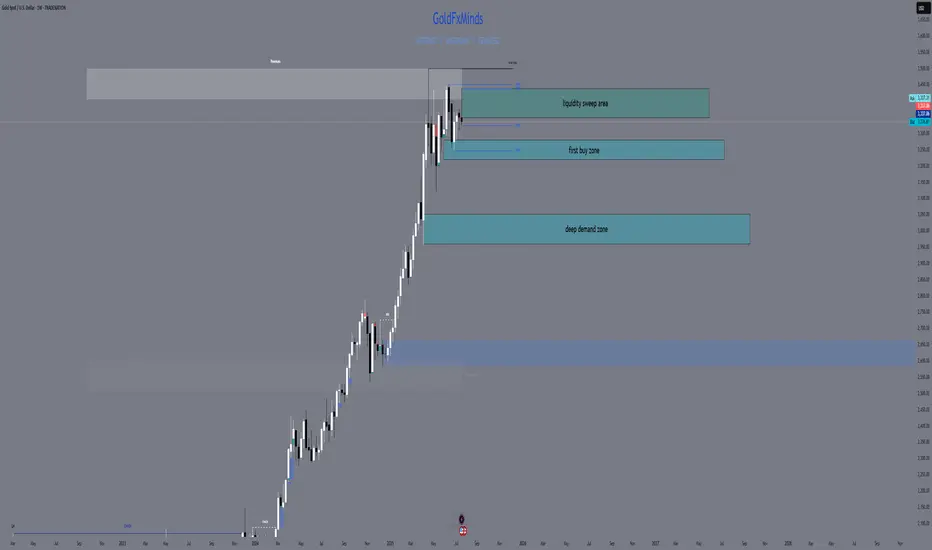
Gold - Eyes on the Final Flush Before ReclaimGold recently dropped after reacting perfectly inside a higher time frame fair value gap. That zone acted as clean supply, offering a precise close within the imbalance and initiating a strong bearish leg. The move confirmed that buyers were overwhelmed at that level, and price began its descent back into a broader consolidation range.
Support Cluster and Fibonacci Alignment
The current zone being tested holds significant weight. Price has tapped into a clear support region, one that has already caused multiple strong bounces in recent sessions. What adds further confluence is the alignment of this zone with the golden pocket region of the entire upward leg. This kind of technical overlap increases the chances of responsive buying once liquidity is cleared below.
Liquidity Target and Inducement Setup
Just below current price action, there's a clean low that hasn't been taken out yet. This low acts as the inducement, sitting right above deeper Fibonacci levels, especially the 0.702. If price continues lower in the short term, a sweep of that low into the golden pocket would provide the ideal liquidity grab before a reversal. The market often rewards those who wait for that final flush.
Bullish Recovery Path
Once the liquidity is taken and price stabilizes at the golden pocket zone, the path is open for a recovery move back into the midrange and potentially higher. The most likely magnet for price after a successful bounce would be the previous resistance zone, which coincides with the 0.5 retracement of the recent drop. That area should act as the next decision point and could either cap the rally or provide the base for a continuation if buyers show strength.
What I’m Watching
The cleanest scenario would be a sweep of the low just below support, ideally pushing into the lower green box near the 0.702 level, followed by a strong bullish reaction. I’ll be watching for a market structure shift on the lower timeframes at that point to confirm the entry. If that happens, the trade has room to develop back into the prior resistance zone, offering a solid range for intraday or swing setups.
Conclusion
Gold remains in a broader range for now, but the technicals suggest one more drop to clear late long positions before a recovery. The reaction at the support cluster will be crucial. If bulls step in after the sweep, there’s a high-probability path back toward resistance, with the move likely supported by the golden pocket confluence.
___________________________________
Thanks for your support!
If you found this idea helpful or learned something new, drop a like 👍 and leave a comment, I’d love to hear your thoughts! 🚀
SMC
XAUUSD H4 Outlook – “Fed Week: Only the Real Zones”Hello, gold traders!
FOMC week is here, the dollar’s flexing, and gold is stuck under a fortress of supply. No fantasy, no overlaps, just your real, actionable H4 map—zones spaced, logic tight, and all fluff deleted.
⬜Bias:
Neutral to bearish while price is capped under 3,355 and the EMA cluster.
Only flip bullish if price closes and holds above 3,375 with strong confirmation after news.
Current Price: 3,336.81
Summary for your audience:
Neutral–bearish: All the EMAs (21/50/100/200) are overhead, and the primary supply and decision zones are blocking any upside.
No reason to flip bullish unless gold breaks out and holds above both the decision zone and the full supply ceiling after major news.
All bounces into supply are likely to get faded, unless the structure changes dramatically post-FOMC.
🟥 ULTRA SUPPLY ZONE: 3,390 – 3,405
127–161.8% Fib extension—liquidity grab and stop-hunt target for news-driven spikes
Only short if you see a monster upper wick and hard rejection
🟥 PRIMARY SUPPLY: 3,365 – 3,375
All EMAs (21/50/100/200) are stacked overhead; unfilled FVG at 3,370–3,375
Short on a clear rally rejection or bearish engulfing candle—this is where most breakouts get trapped
🔶 DECISION ZONE: 3,340 – 3,355
EMA100/200 straddle this level; small FVG at 3,350–3,352
Market “decides” here—fade unless price closes decisively above 3,355
🔵 EQUILIBRIUM SHELF: 3,320 – 3,335
50% Fib at 3,327; filled FVG at 3,325–3,330; SMA50 just below
Bounce/fake-break zone—wait for a clean H4 reversal, not a guess
🟢 FIRST DEMAND BASE: 3,290 – 3,310
H4 Order Block, hidden FVG (3,300–3,305), Fib 38.2% around 3,295
Longs only with strong pin-bar/engulf and quick EMA50 reclaim
🔵 DEEP PULLBACK BAY: 3,250 – 3,280
Weekly EMA21 and 61.8% Fib (~3,260), strong volume
Only consider a long on a panic flush and a powerful reversal wick
⚡️ MACRO CONTEXT
USD: On fire into ADP and FOMC; gold moves will be explosive, not logical
Events:
Tue: ADP
Wed: FOMC + Powell
Thu: Core PCE
Fri: NFP, ISM
Bias: Neutral-bearish under 3,355; only bullish if we close and hold above 3,375
EMAs: Clustered tightly overhead—bulls get no respect until this ceiling is crushed
🎯 TRADE LOGIC
Shorts:
3,390–3,405 (big wicks and clear rejection only)
3,365–3,375 (news spike or failed breakout with bearish candle)
Longs:
3,340–3,355 (only on a confirmed close above)
3,320–3,335 (strong reversal only—don’t front run)
3,290–3,310 (classic H4 pin-bar/engulf + EMA50 reclaim)
3,250–3,280 (deep panic flush and major reversal only)
NO TRADE: In the gaps—let the gamblers get chewed up, not you.
💬 Which zone will you snipe? Drop a comment and show you’re here for structure, not noise!
👍 Like & Follow for high-value, real-time sniper maps every day.
Disclosure: Chart via Trade Nation’s TradingView feed. Influencer Program participant.
GoldFxMinds 💛
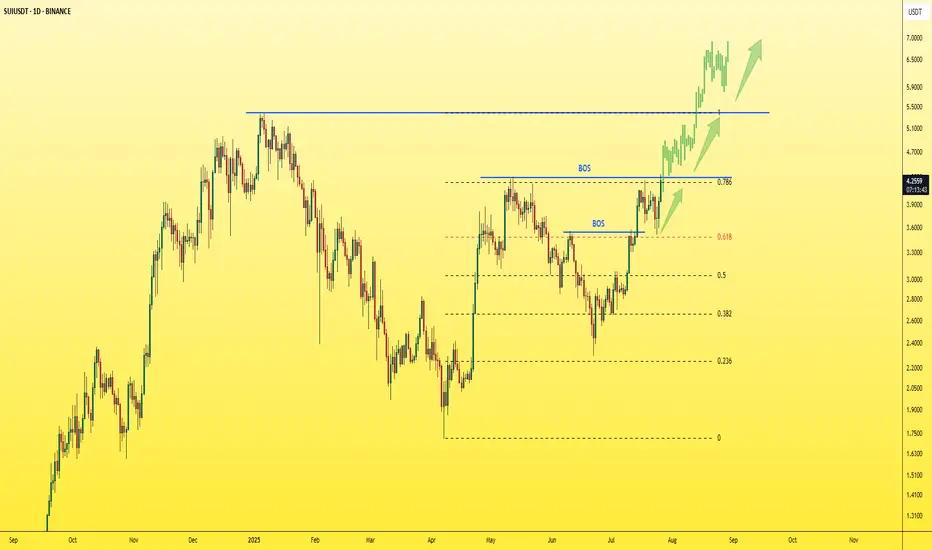
SUI - Just one step away from the explosion!The last candle on the daily chart just confirmed a BOS (Break of Structure) — a clear and strong sign of bullish continuation for the asset.
✅ This is a textbook entry for a long position.
🎯 Next target: $5 — and so far, no bearish signs in sight.
Best regards,
Ceciliones 🎯
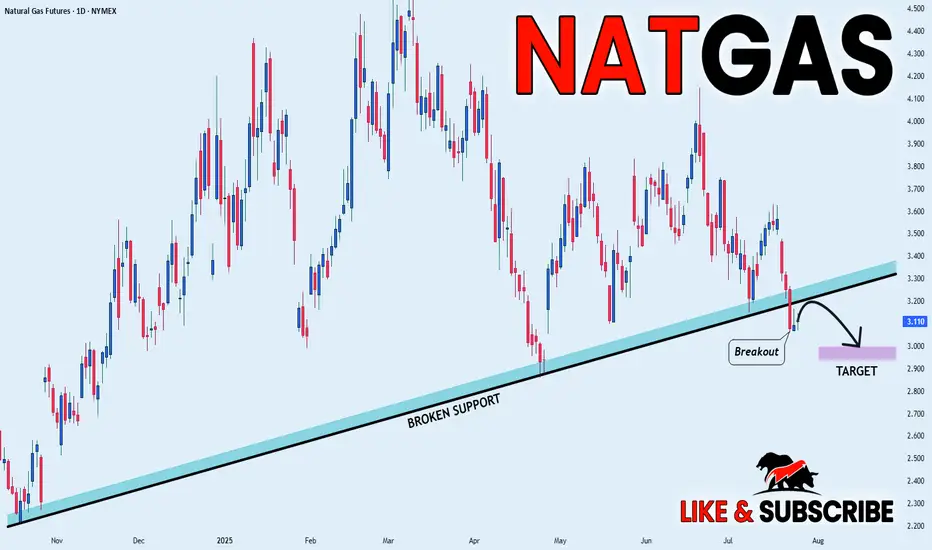
NATGAS BEARISH BREAKOUT|SHORT|
✅NATGAS broke the rising support
While trading in an local downtrend
Which makes me bearish
And I think that after the retest of the broken line is complete
A rebound and bearish continuation will follow
SHORT🔥
✅Like and subscribe to never miss a new idea!✅
Disclosure: I am part of Trade Nation's Influencer program and receive a monthly fee for using their TradingView charts in my analysis.
Daily XAUUSD Outlook — Riding the Fed Wave (July 28, 2025)Hey Gold Hunters! 🌟
Today feels like the calm before a storm—ADP whispers tomorrow, the Fed speaks Wednesday, and gold is inching toward its next big move. Let’s weave the macro pulse into our Smart‑Money map, highlight the five real zones, then plot our sniper‑perfect entries. No fluff—just the human beat of the market.
1️⃣ Macro Pulse & Market Mood
US Dollar: Bullish tilt as markets price in another hawkish Fed pause.
Tomorrow (Tue): ADP jobs print could spark an early swing.
Wed PM: FOMC Statement & Powell’s press conference—biggest catalyst this week.
Thu/Fri: Core PCE, Unemployment Claims, then Friday’s NFP + ISM Manufacturing.
Gold is caught in suspense: a squeeze here (into supply) or a slide there (into demand) will come fast once the Fed drops its hint.
🧭 Bias: Neutral‑bearish—looking for lower highs under the 3,345–3,375 supply zone, with a preference to short rallies into that band until price convincingly breaks and holds above 3,375. Once we see a clean weekly‑style close above that level, we’ll flip to neutral‑bullish.
2️⃣ Five Breathing Zones (Top → Bottom)
🛑 Zone 1 “Sky Trap” (3,380 – 3,415)
The final airspace above our daily EMAs (10/50) where stops are hunted. Fib ext’s 127%–161.8% and an unfilled Fair‑Value Gap live here. Any spike that ends in a long upper wick or bearish engulf = short‑trap.
(let price fall clear of this zone before the next)
⚔️ Zone 2 “Premium Supply” (3,345 – 3,375)
The two‑week high order block, hugged by EMA50 and Fib 61.8%. Friday’s rejection candle was born here. Watch for bearish PA after a retest—your core sell zone.
(space down to next)
🌊 Zone 3 “First Demand Cove” (3,290 – 3,320)
Where mid‑June’s buyers piled in: June consolidation OB, filled FVG, and Fib 38.2–50% confluence. SMA100 sits below for extra gravity. A clean drop and bullish reaction here = sniper‑long trigger.
(gap to deep zone)
🚀 Zone 4 “Deep Pullback Bay” (3,240 – 3,270)
Hidden Fair‑Value Gap, BOS origin, and weekly EMA21 converge. If Zone 3 breaks, this is your deep‑dip reload—hunt that D1 reversal wick.
(last space)
🛡️ Zone 5 “Macro Reset Block” (3,000 – 3,140)
The root of 2024’s CHoCH, EMA200/SMA200 cluster, and 78.6–88.6% Fib retrace. Only if gold truly panics on a USD blitz—ultimate accumulation.
3️⃣ Sniper‑Perfect Scenarios
🔴 Short Setup
Where: A thrust into Zone 1 or 2 (3,345+).
Cue: Long upper wick → bearish engulf on D1/M30.
Edge: FVG fill + Fib confluence + RSI rollover.
🟢 Long Setup
Where: A dip into Zone 3 or, if swept, Zone 4.
Cue: Bullish pin‑bar or engulf + reclaim of EMA10/50.
Edge: June OB base + RSI bounce from ~50.
4️⃣ Your To‑Do List
Morning Watch: Does gold flirt with 3,375? Prep your shorts.
Mid‑Day Pull: A drop to 3,300? Hunt your longs.
Avoid: The gaps between zones—those are “no‑man’s land.”
News Trades: Let the daily candle close post‑Fed before committing.
💬 What’s your plan today? Comment below—let’s refine our edge!
👍 Enjoyed this map? Smash that Like & Follow for more pulse‑driven, zero‑fluff outlooks.
Disclosure: Chart powered by Trade Nation’s TradingView feed. I participate in their Influencer Program.
GoldFxMinds 💛
XAUUSD SNIPER OUTLOOK – JULY 28, 2025🔥 Macro & Sentiment
The dollar remains dominant — DXY holding above 105 keeps gold under pressure. No fundamental support for bullish continuation unless major macro shifts. Risk flows are defensive, not aggressive. FOMC and US GDP data remain key drivers for direction this week.
BIAS:
• Short-term bearish under 3350
• Market still in distribution mode — every bounce gets sold
• Real buy interest only deep below 3315
🔻 INTRADAY SUPPLY ZONES (Short Only With Rejection)
1. 3382–3370 (H1/M30 Premium Supply)
🔹 H1 order block, FVG alignment, EMA21/50/100 convergence
🔹 Liquidity inducement above → then rejection
📍 Short only if rejection shows via engulf / upper wick.
2. 3355–3340 (Decision Zone / Micro Supply)
🔹 EMA100/200 alignment, former support flipped resistance
🔹 M30 FVG fully filled, structure flip from mid-July
📍 Short bias below. Long only if reclaimed with H1 close above 3355.
🔵 NEUTRAL / PIVOT ZONE
3. 3338–3326 (Decision Band – M30/M15)
🔹 Consolidation area post-BOS, internal liquidity sweeps
🔹 EMA21 base on M15, no clear dominance
📍 Wait for clean reaction. Bullish engulf = scalp long to 3355. Failure = slide to demand.
🟢 DEMAND ZONES (Buy Only On Strong Reversal Confirmation)
4. 3314–3302 (M30/M15 Deep Demand)
🔹 H1 OB + hidden FVG + fib 38.2%
🔹 First real demand zone where buyers may engage
📍 Long only if strong M15 confirmation: engulf + RSI cross + EMA5/21 angle change.
5. 3289–3272 (True Reversal Demand – H1/M30)
🔹 Full NY reversal origin (July 18), major FVG left unfilled
🔹 Institutional volume + liquidity grab zone
📍 Buy only on full flush + fast snapback with BOS on M15/H1.
🧭 BIAS & EXECUTION BY TIMEFRAME
H4 Bias:
Bearish while below 3350. No valid supply above until 3370+. Avoid longs unless price sweeps 3314 or 3272 and confirms.
H1 Bias:
Sell clean rejection at 3355 or 3370–3382. Only flip long above 3355 with full-bodied close.
M30 Bias:
Watch decision zone 3338–3326 for direction. No-man’s land in between — don’t force trades.
M15 Bias:
Scalp long from 3314 or 3272 only on full confluence (OB + RSI + EMA realignment). Short only confirmed rejections above.
📊 FULL INTRADAY KEY LEVELS (Top → Bottom)
Level Context
3405 Fib ext. 127% (HTF sweep target only)
3385 OB
3375–3350 Valid Premium Supply (H1 shelf)
3350–3340 Micro Supply / Flip Zone
3338–3326 Decision Zone – watch reaction
3314–3302 Deep Demand (H1/M30 confluence)
3289–3272 Extreme Demand Base
3260 Fib 61.8% + HTF support
3250 Minor volume node
3240 Final structural floor
✅ EXECUTION NOTES
⛔ Avoid entering inside 3340–3326 → fakeout zone
✅ Play only clean sniper triggers with structure
⚠️ Wait for macro — FOMC / GDP releases may fake both sides
💡 Patience wins. Pick your zone, wait for setup, strike.
Which zone are you watching to strike? Drop your bias below.
📍 Like, comment & follow GoldFxMinds for the most precise sniper maps on TradingView.
Disclosure: This plan is based on the Trade Nation chart feed. I am part of their Influencer Program.

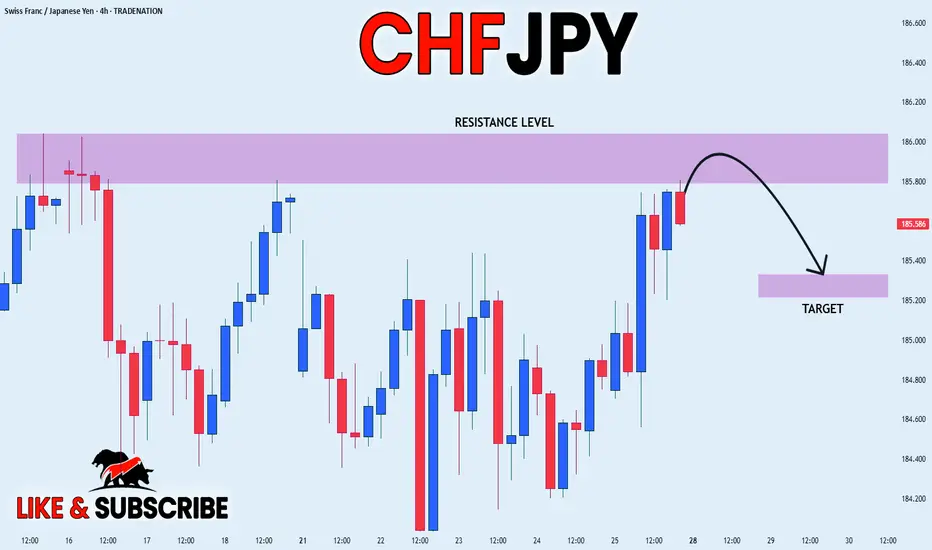
CHF-JPY Short From Resistance! Sell!
Hello,Traders!
CHF-JPY keeps trading in
An uptrend and the pair
Is locally overbought so after
The pair hits the horizontal
Resistance level of 186.000
We will be expecting a local
Bearish correction
Sell!
Comment and subscribe to help us grow!
Check out other forecasts below too!
Disclosure: I am part of Trade Nation's Influencer program and receive a monthly fee for using their TradingView charts in my analysis.

EUR-JPY Local Long! Buy!
Hello,Traders!
EUR-JPY is trading in an
Uptrend and the pair made
A breakout, a retest and
A bullish rebound from the
Horizontal support of 173.200
So we are bullish biased and
We will be expecting a
Further bullish move up
On Monday!
Buy!
Comment and subscribe to help us grow!
Check out other forecasts below too!
Disclosure: I am part of Trade Nation's Influencer program and receive a monthly fee for using their TradingView charts in my analysis.

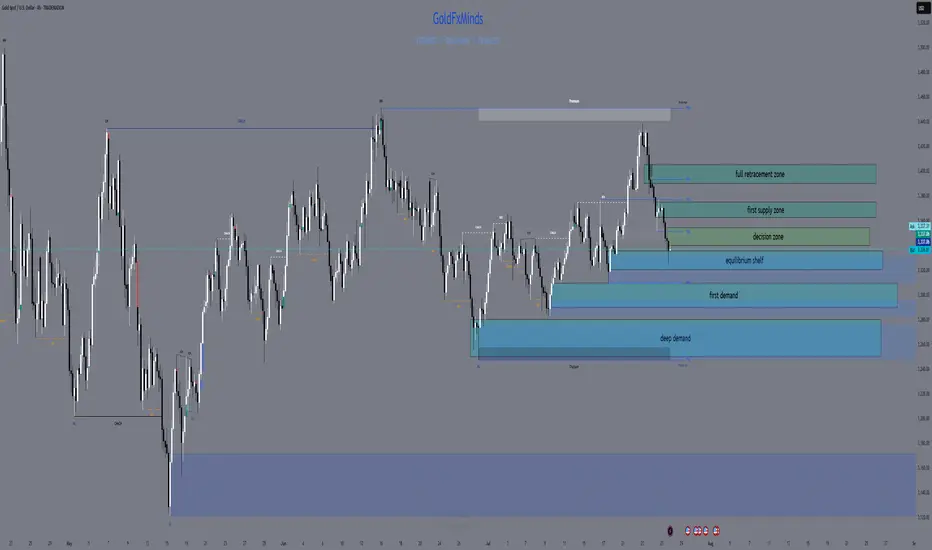
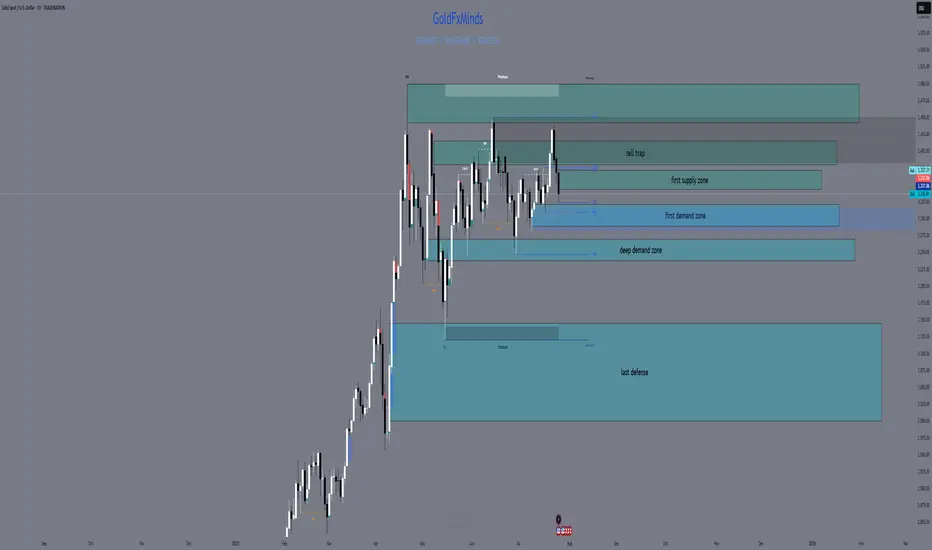
XAUUSD FULL WEEKLY STRUCTURE MAPHello traders! 🌟
We’re stepping into a pivotal week for gold (XAUUSD), and the weekly chart tells a story of tension, liquidity hunts, and potential big moves. Let’s dive into the three truly critical zones, backed by SMC/ICT logic, Fibonacci, EMAs, RSI, and fair‑value gaps — all in one elegant map. 🎨✨
🔹 HTF Overview & Macro Pulse
Current Price: 3336
Weekly Trend: Bullish overall, but momentum is fading as price coils under premium highs.
EMAs (5/21/50/200):
EMA5 & EMA21 are flattening beneath price, hinting at stall.
EMA50 sitting near 3120 as a deep support magnet.
RSI (Weekly): Cooling from ~75 down to ~66, showing bearish divergence vs those upper wicks.
Fair‑Value Gaps:
Unfilled 3365–3405 zone above — institutional imbalance still waiting.
Partially filled 3280–3320 below — common reaction pocket.
Fibonacci Extensions (1984 → 3365 high): 127.2% at 3405, 161.8% at 3439 — the exact top of our supply wick.
Macro Catalysts This Week
Wed (Jul 30): FOMC + Fed Statement
Thu (Jul 31): Core PCE + Unemployment Claims
Fri (Aug 1): NFP + ISM Manufacturing
Prepare for violent spikes into one of our zones — then trade the reaction.
🔸 The Three TRUE Weekly Zones
W1 Supply (Ultimate Wick Zone)
🔥 3350 – 3439
This entire wick from May–July is YOUR one and only supply zone on weekly.
Pure liquidity sweep area
Confluence: unfilled fair‑value gap, 127–161.8% Fib, RSI divergence
Every touch here is a short‑trap until we see a full weekly close above 3439.
W1 Demand (Primary Buy Zone)
🌊 3220 – 3285
The last robust order block & BOS base before gold ran vertical.
Confluence: filled FVG, weekly OB body, EMA21 target, RSI back at 50
Ideal sniper entry after a news‑driven sell‑off into this range.
Deep Discount Block
🛡️ 2960 – 3050
The origin of the full 2024–2025 bull trend — true institutional accumulation.
Confluence: March 2024 CHoCH base, EMA50/200 proximity, 78.6–88.6% Fib retrace
Only for a major quarterly reset; not on the immediate radar unless USD spikes dramatically.
🧭 Strategy & Execution
Short Bias: Wait for a liquidity spike into 3350–3439 (likely around FOMC/NFP), then watch for a clean rejection candle.
Long Bias: After a thrust down into 3220–3285, look for wick‑based rejection plus EMA21 hold and a bullish engulf on weekly.
Avoid the mid‑zone between 3285–3350 — that’s noise, not structure.
Patience is everything. Let price sweep, then let us strike. The real power trades this week will be born from clear structure — not guesswork.
💬 What’s your favorite zone to watch? Drop a comment below!
👍 Smash that like🚀🚀🚀 if you found this map helpful, and hit follow for more GoldFxMinds sniper blueprints.
Disclosure: Analysis based on Trade Nation’s TradingView feed. I’m part of their Influencer Program.
GoldFxMinds 💛
BTCUSD: Bears Are Winning! Short!
My dear friends,
Today we will analyse BTCUSD together☺️
The in-trend continuation seems likely as the current long-term trend appears to be strong, and price is holding below a key level of 118,973 So a bearish continuation seems plausible, targeting the next low. We should enter on confirmation, and place a stop-loss beyond the recent swing level.
❤️Sending you lots of Love and Hugs❤️

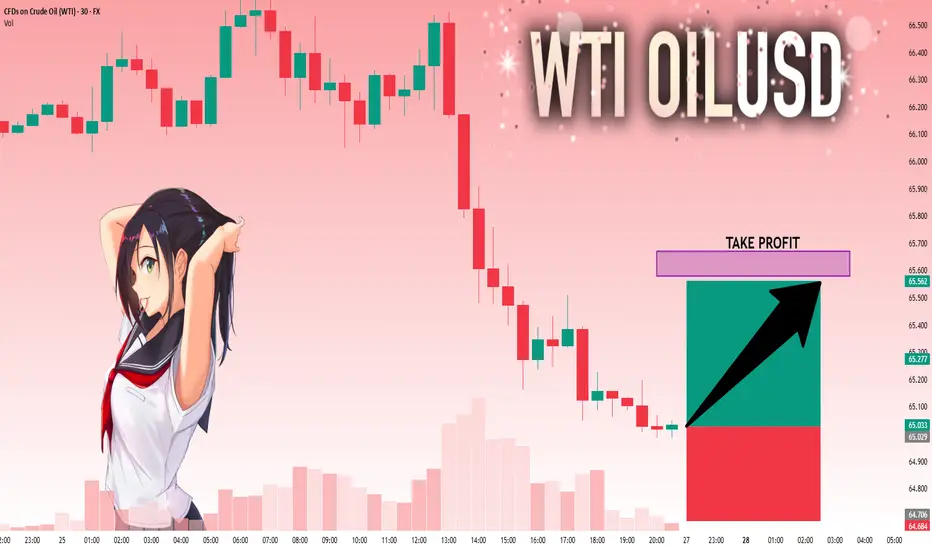
CRUDE OIL Risky Long! Buy!
Hello,Traders!
CRUDE OIL will soon hit
A horizontal support
Of 64.50$ and as it is
A strong level we will be
Expecting a local bullish
Rebound on Monday
Buy!
Comment and subscribe to help us grow!
Check out other forecasts below too!
Disclosure: I am part of Trade Nation's Influencer program and receive a monthly fee for using their TradingView charts in my analysis.

CAD-CHF Local Rebound Ahead! Buy!
Hello,Traders!
CAD-CHF made a retest
Of the horizontal support
At 0.5797 from where we
Are already seeing a bullish
Reaction so we will be
Expecting a further local
Bullish move up
Buy!
Comment and subscribe to help us grow!
Check out other forecasts below too!
Disclosure: I am part of Trade Nation's Influencer program and receive a monthly fee for using their TradingView charts in my analysis.

ETHUSD: Strong Bullish Sentiment! Long!
My dear friends,
Today we will analyse ETHUSD together☺️
The recent price action suggests a shift in mid-term momentum. A break above the current local range around 3,826.1 will confirm the new direction upwards with the target being the next key level of 3,883.6 and a reconvened placement of a stop-loss beyond the range.
❤️Sending you lots of Love and Hugs❤️

CHF_JPY RISKY SHORT|
✅CHF_JPY is going up now
But a strong resistance level is ahead at 186.036
Thus I am expecting a pullback
And a move down towards the target of 185.329
SHORT🔥
✅Like and subscribe to never miss a new idea!✅
Disclosure: I am part of Trade Nation's Influencer program and receive a monthly fee for using their TradingView charts in my analysis.
GBP-NZD Will Keep Falling! Sell!
Hello,Traders!
GBP-NZD keeps falling down
And the pair made a strong
Bearish breakout of the key
Horizontal key level of 2.2400
And the breakout is confirmed
So we are bearish biased and
We will be expecting a further
Bearish move down on Monday
Sell!
Comment and subscribe to help us grow!
Check out other forecasts below too!
Disclosure: I am part of Trade Nation's Influencer program and receive a monthly fee for using their TradingView charts in my analysis.

EUR-GBP Swing Short! Sell!
Hello,Traders!
EUR-GBP keeps growing in
A strong uptrend but the pair
Is locally overbought so after
The price hits a horizontal
Resistance level of 0.8764
We will be expecting a
Local bearish correction
Sell!
Comment and subscribe to help us grow!
Check out other forecasts below too!
Disclosure: I am part of Trade Nation's Influencer program and receive a monthly fee for using their TradingView charts in my analysis.

NI225: Move Down Expected! Short!
My dear friends,
Today we will analyse NI225 together☺️
The recent price action suggests a shift in mid-term momentum. A break below the current local range around 41,456.23 will confirm the new direction downwards with the target being the next key level of 40,954.70 and a reconvened placement of a stop-loss beyond the range.
❤️Sending you lots of Love and Hugs❤️

USOIL: Next Move Is Up! Long!
My dear friends,
Today we will analyse USOIL together☺️
The market is at an inflection zone and price has now reached an area around 65.029 where previous reversals or breakouts have occurred.And a price reaction that we are seeing on multiple timeframes here could signal the next move up so we can enter on confirmation, and target the next key level of 65.579.Stop-loss is recommended beyond the inflection zone.
❤️Sending you lots of Love and Hugs❤️
NG1!: Target Is Up! Long!
My dear friends,
Today we will analyse NG1! together☺️
The price is near a wide key level
and the pair is approaching a significant decision level of 3.087 Therefore, a strong bullish reaction here could determine the next move up.We will watch for a confirmation candle, and then target the next key level of 3.107.Recommend Stop-loss is beyond the current level.
❤️Sending you lots of Love and Hugs❤️

Next Move On EURUSD: A Bullish ContinuationWith this 4H bearish impulsive move, it’s easy to assume a reversal is underway to break the previous daily swing low. However, this appears more like a liquidity grab—fueling the next leg to the upside.
Price has retraced into a key zone that previously performed a strong liquidation. With significant liquidity already swept and clean inducements now resting above, this level becomes crucial.
This zone is the last stand: a break downward may target the daily swing low, while a hold and reaction could propel price toward the swing high.
Fingers crossed 🤞 as we watch price play out.
Have a great trading week, traders.
Catch you in the next one. 🫡

btc short tradeon 1hr timeframe btc take the inducement and on 15m done MSS and now rice going to retest the 15m advanced oder block
entry 19131
stoploss 120990
target 1; 114685
target 2 ; 113650

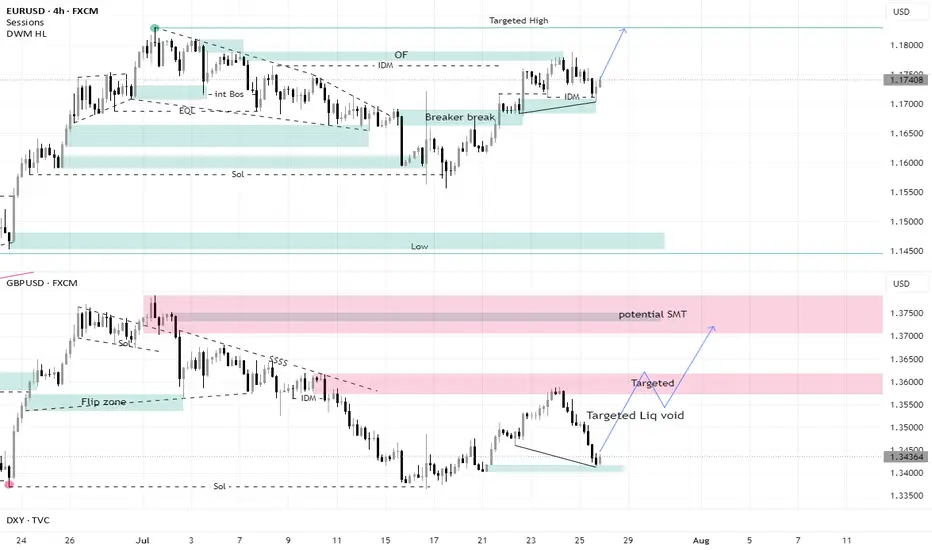
SMT in EU and GU + Targeting Liquidity voidI did not expect the GBPUSD to fall with all this force, but the EURUSD’s refusal to fall with it all these points indicates the strength of the current Low from which it rebounded, and it is expected that this bottom will hold
It is clear that GBPUSD was looking for more liquidity and that is why it dropped all these points. With this drop, it created a liquidity void that allowed it to rise and take all these pips back.