AUD_CAD BULLISH BIAS|LONG|
✅AUD_CAD is approaching a demand level around 0.8800
So according to our strategy
We will be looking for the signs of the reversal in the trend
To jump onto the bullish bandwagon just on time to get the best
Risk reward ratio for us
LONG🚀
✅Like and subscribe to never miss a new idea!✅
Disclosure: I am part of Trade Nation's Influencer program and receive a monthly fee for using their TradingView charts in my analysis.
SMC-ICT

EURUSD 4H ELLIOTT WAVE COUNT – DOWNSIDE TARGET CONFIRMED!Good Morning, Traders,
I’m sharing my wave analysis for EURUSD with you. After completing its first five waves, it formed the A-B wave and is now expected to move into the C wave.
The target level for the C wave is currently 1.11838.
I meticulously prepare these analyses for you, and I sincerely appreciate your support through likes. Every like from you is my biggest motivation to continue sharing my analyses.
I’m truly grateful for each of you—love to all my followers

GBP_AUD RIKSY LONG|
✅GBP_AUD is going down to retest
A horizontal support of 2.2504
And we are locally bullish biased
So I think that we will see a rebound
And a move up from the level
Towards the target above at 2.2571
LONG🚀
✅Like and subscribe to never miss a new idea!✅
Disclosure: I am part of Trade Nation's Influencer program and receive a monthly fee for using their TradingView charts in my analysis.

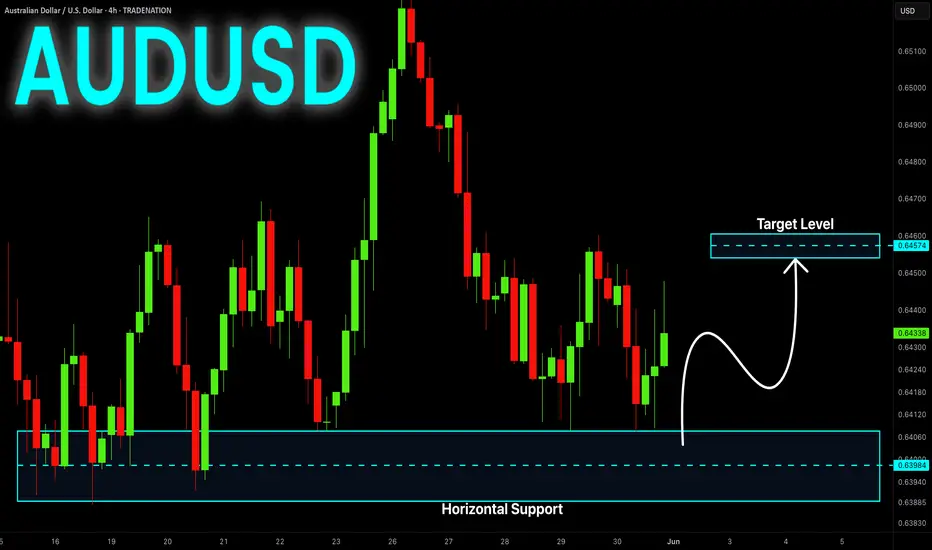
AUD-USD Rebound Ahead! Buy!
Hello,Traders!
AUD-USD made a retest
Of the horizontal demand
Area around 0.6394 and
We are already seeing a
Nice bullish reaction from
The level so we are locally
Bullish biased and we will
Be expecting a further
Local bullish move up
On Monday
Buy!
Comment and subscribe to help us grow!
Check out other forecasts below too!
Disclosure: I am part of Trade Nation's Influencer program and receive a monthly fee for using their TradingView charts in my analysis.
EUR_USD WILL FALL|SHORT|
✅EUR_USD is going up now
But a strong resistance level is ahead at 1.1425
Thus I am expecting a pullback
And a move down towards the target
Below at 1.1310on Monday!
SHORT🔥
✅Like and subscribe to never miss a new idea!✅
Disclosure: I am part of Trade Nation's Influencer program and receive a monthly fee for using their TradingView charts in my analysis.

GBP_JPY RISING SUPPORT|LONG|
✅GBP_JPY is trading along the rising support
And as the pair will soon retest it
I am expecting the price to go up
To retest the supply levels above at 194.500
LONG🚀
✅Like and subscribe to never miss a new idea!✅
Disclosure: I am part of Trade Nation's Influencer program and receive a monthly fee for using their TradingView charts in my analysis.

AUD_NZD BEARISH BREAKOUT|SHORT|
✅AUD_NZD made a bearish
Breakout of the key horizontal
Level of 1.0783 and the breakout
Is confirmed so we are locally
Bearish biased and we will be
Expecting a further bearish
Move down
SHORT🔥
✅Like and subscribe to never miss a new idea!✅
Disclosure: I am part of Trade Nation's Influencer program and receive a monthly fee for using their TradingView charts in my analysis.

USD_CHF WILL GROW|LONG|
✅USD_CHF is falling down
And will soon retest
A horizontal demand level of 0.8190
So I think that we will see a rebound
And a move up from the level
Towards the target above at 0.8253
LONG🚀
✅Like and subscribe to never miss a new idea!✅
Disclosure: I am part of Trade Nation's Influencer program and receive a monthly fee for using their TradingView charts in my analysis.

CAD_JPY LONG FROM SUPPORT|
✅CAD_JPY has been falling recently
And the pair seems locally oversold
So as the pair is approaching
A horizontal support of 104.200
Price growth is to be expected
LONG🚀
✅Like and subscribe to never miss a new idea!✅
Disclosure: I am part of Trade Nation's Influencer program and receive a monthly fee for using their TradingView charts in my analysis.

GBP-USD Swing Long! Buy!
Hello,Traders!
GBP-USD is trading in an
Uptrend and the pair made
A retest of the horizontal
Support of 1.3419 from where
We are already seeing a
Bullish rebound so we will be
Expecting a further
Bullish move up
Buy!
Comment and subscribe to help us grow!
Check out other forecasts below too!
Disclosure: I am part of Trade Nation's Influencer program and receive a monthly fee for using their TradingView charts in my analysis.

GOLD Bearish Breakout! Sell!
Hello,Traders!
GOLD made a bearish
Breakout of the key horizontal
Level of 3285$ which also
Seems to have been a neckline
Of the small H&S pattern so
We are locally bearish biased
And we will be expecting a
Further bearish move down
Sell!
Comment and subscribe to help us grow!
Check out other forecasts below too!
Disclosure: I am part of Trade Nation's Influencer program and receive a monthly fee for using their TradingView charts in my analysis.

EUR-USD Free Signal! Buy!
Hello,Traders!
EUR-USD is going down
And the pair will soon hit
A horizontal support level
Around 1.1270 from where
We will be able to go long
With the Take Profit of 1.1328
And the Stop Loss of 1.1254
Buy!
Comment and subscribe to help us grow!
Check out other forecasts below too!
Disclosure: I am part of Trade Nation's Influencer program and receive a monthly fee for using their TradingView charts in my analysis.

EUR_AUD WILL GO DOWN|SHORT|
✅EUR_AUD price grew again
To retest the resistance of 1.7640
But it is a strong key level
So I think that there is a high chance
That we will see a bearish move down
SHORT🔥
✅Like and subscribe to never miss a new idea!✅
Disclosure: I am part of Trade Nation's Influencer program and receive a monthly fee for using their TradingView charts in my analysis.

Dow Jones Index Local Short! Sell!
Hello,Traders!
US30 index keeps going up
But the price will soon hit
A strong horizontal resistance
Level around 42,876 from where
We will be expecting a local
Pullback and a move down
Sell!
Comment and subscribe to help us grow!
Check out other forecasts below too!
Disclosure: I am part of Trade Nation's Influencer program and receive a monthly fee for using their TradingView charts in my analysis.

AUD_NZD SUPPORT AHEAD|LONG|
✅AUD_NZD is going down now
But a strong support level is ahead at 1.0780
Thus I am expecting a rebound
And a move up towards the target at 1.0827
LONG🚀
✅Like and subscribe to never miss a new idea!✅
Disclosure: I am part of Trade Nation's Influencer program and receive a monthly fee for using their TradingView charts in my analysis.

EUR_CAD RISKY LONG|
✅EUR_CAD is going down to retest
A horizontal support of 1.5570
Which makes me locally bullish biased
And I think that we will see a rebound
And a move up from the level
Towards the target above at 1.5630
LONG🚀
✅Like and subscribe to never miss a new idea!✅
Disclosure: I am part of Trade Nation's Influencer program and receive a monthly fee for using their TradingView charts in my analysis.

USD-CHF Free Signal! Buy!
Hello,Traders!
USD-CHF is once again
Retesting a horizontal support
Level around 0.8189 and the
Pair seems to have formed
A H&S pattern, so we are bearish
Biased, however, a local bullish
Rebound from the support
Is possible so while risky
A long trade still makes sense
With the Take Profit of 0.8238
And the Stop Loss of 0.8184
Buy!
Comment and subscribe to help us grow!
Check out other forecasts below too!
Disclosure: I am part of Trade Nation's Influencer program and receive a monthly fee for using their TradingView charts in my analysis.

USD-JPY Free Signal For Monday! Buy!
Hello,Traders!
USD-JPY is about to retest
A horizontal support level
Around 142.000 and after
The retest on Monday we
Will be able to go long on
The pair with the Take
Profit of 143.331 and the
Stop Loss of 141.939
Buy!
Comment and subscribe to help us grow!
Check out other forecasts below too!
Disclosure: I am part of Trade Nation's Influencer program and receive a monthly fee for using their TradingView charts in my analysis.

DAX WILL KEEP GROWING|LONG|
✅DAX made a retest of
The horizontal support level
Of 23,371 and the index is already
Making a bullish rebound so we
Are bullish biased and we will
Be expecting further growth on Monday
LONG🚀
✅Like and subscribe to never miss a new idea!✅
Disclosure: I am part of Trade Nation's Influencer program and receive a monthly fee for using their TradingView charts in my analysis.

GBP_USD SWING BREAKOUT|LONG|
✅GBP_USD made an absolutely
EPIC breakout of the key horizontal
Level of 1.3426 and the breakout is
Confirmed even on a DAILY timeframe
Which combined with the strong uptrend
Makes us extremely bullish biased on
The pair and we will be expecting
Further growth in the coming weeks
After a potential local pullback
LONG🚀
✅Like and subscribe to never miss a new idea!✅
Disclosure: I am part of Trade Nation's Influencer program and receive a monthly fee for using their TradingView charts in my analysis.

AUD_USD SHORT FROM RESISTANCE|
✅AUD_USD has been growing recently
And the pair seems locally overbought
So as the pair is approaching a horizontal resistance of 0.6515
Price decline is to be expected on Monday
SHORT🔥
✅Like and subscribe to never miss a new idea!✅
Disclosure: I am part of Trade Nation's Influencer program and receive a monthly fee for using their TradingView charts in my analysis.

GBP_CAD RISING SUPPORT AHEAD|LONG|
✅GBP_CAD is trading along the rising support
And as the pair will soon retest it
I am expecting the price to go up
To retest the supply levels above at 1.8605
LONG🚀
✅Like and subscribe to never miss a new idea!✅
Disclosure: I am part of Trade Nation's Influencer program and receive a monthly fee for using their TradingView charts in my analysis.

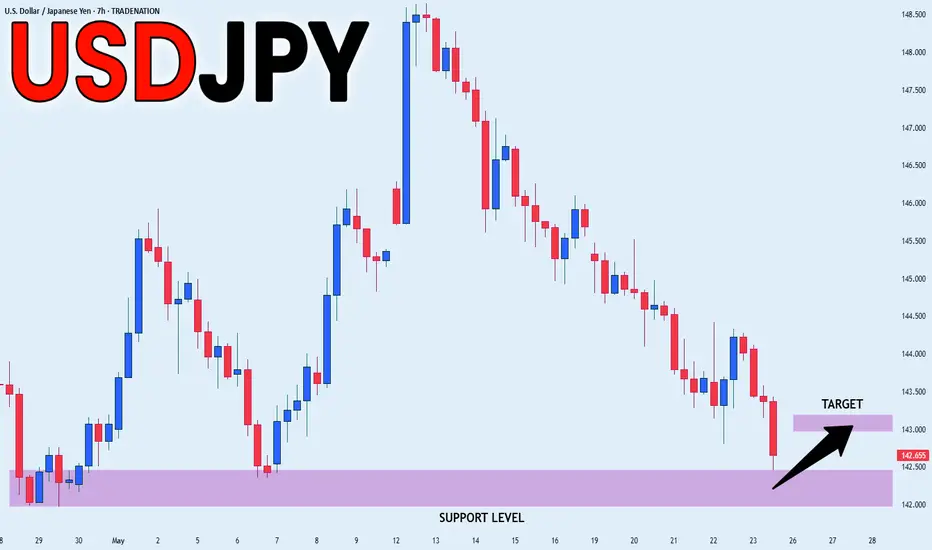
USD_JPY SUPPORT AHEAD|LONG|
✅USD_JPY is going down now
But a strong support level is ahead at 142.000
Thus I am expecting a rebound
And a move up towards the target of 143.000
LONG🚀
✅Like and subscribe to never miss a new idea!✅
Disclosure: I am part of Trade Nation's Influencer program and receive a monthly fee for using their TradingView charts in my analysis.