BTC macro by @SeemsLegitnext few months are going to be a blood bath. no bottom short term bottom until July when the fed pauses and by then BTC will have reached 11-8k
SMC-ICT

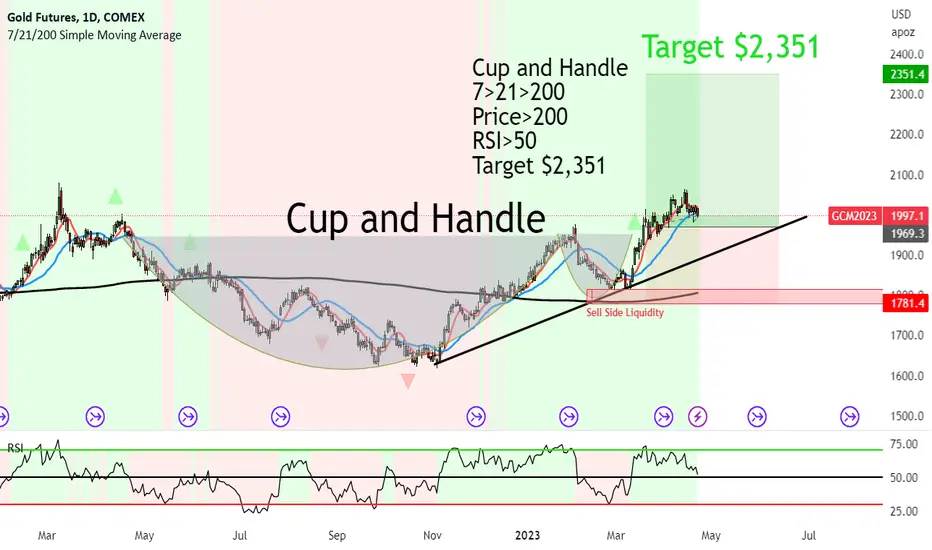
Gold still setting itself for upside to $2,351 with SMC ExplainCup and Handle formed on Gold recently.
We had a break above the brim level.
Now we are having some kind of retracement, for Smart Money to pick up orders before heading on up.
7>21>200
Price>200
RSI>50
Target HKEX:2 ,351
SMC:
Sell Side Liquidity order block is just below the handle of the C&H.
This is also where the powerful 200MA is.
When the price came down, Smart Money swept the liquidity of selling (bought into them) and hence the price shot up.
I am still very much bullish with Gold - Until further notice.
EURUSD - Longing opportunity intraday Lovely move down into the hourly imbalance today on EU.
This provided perfect conditions to enter longs on the 3 min chart, targeting the liquidity resting above the equal highs as shown on the chart.
Messy charts are not always a bad thing! Assess the noise, take what you can from the market and exit at a logical area where we are likely to see a reversal in the other direction.
Best wishes,
Jake

DXY Potential Forecast | Unemployment Claims | 20th April 2023Fundamental Backdrop
1. Unemployment Claims comes out at 245k compared to a 240k forecasted.
2. This highlights a worsening labour market and a potential sign that of recession in the US.
3. This is bearish on the USD and we could see potential bearish continuations in the market.
Technical Confluences
1. Near-term resistance at 102.09.
2. Price rejected this H4 resistance level and we could potentially see price head further down to break the structural low at 100.79.
Idea
Looking for price to continue heading bearish to the level at 100.79.
NOT FINANCIAL ADVICE DISCLAIMER
The trading related ideas posted by OlympusLabs are for educational and informational purposes only and should not be considered as financial advice. Trading in financial markets involves a high degree of risk, and individuals should carefully consider their investment objectives, financial situation, and risk tolerance before making any trading decisions based on our ideas.
We are not a licensed financial advisor or professional, and the information we are providing is based on our personal experience and research. We make no guarantees or promises regarding the accuracy, completeness, or reliability of the information provided, and users should do their own research and analysis before making any trades.
Users should be aware that trading involves significant risk, and there is no guarantee of profit. Any trading strategy may result in losses, and individuals should be prepared to accept those risks.
OlympusLabs and its affiliates are not responsible for any losses or damages that may result from the use of our trading related ideas or the information provided on our platform. Users should seek the advice of a licensed financial advisor or professional if they have any doubts or concerns about their investment strategies.

4/18 Watchlist + Notes SPY - I think today was like a 50% win 50% loss from our prediction yesterday. I wanted to head lower than Friday, which we did not get, and we closed green, but my prediction also said that I saw today being a pullback day or consolidation day, which it was. Tomorrow I am thinking we head higher and that is purely due to the fact that we had such a strong close. Textbook bullish candle. With today being an inside day, anything can happen, but we are definitely leaning bullish. If we break today's high then we target 415.13 and 417 if buying strength is there
Watchlist:
All inside setups on the scanner on my chart per usual
Challenge account watchlist: (Current account value is $50.00. No trades today on it)
AA - 3-1 Daily
ARKK - 3-1-1-2 Daily - 50% rule/Potential Compound 3 Bar
U - 2-1 Daily
Main Watch:
ARKK: Looking for a break of 39.08 to target 39.84. With this reversal pattern, it is important to note that today price passed the 50% retracement of yesterday's range after breaking the low. This is what starts the creation of compound engulfing candles. Reversals with this setup usually bank hard. If my bullish bias on SPY plays out well I can easily see this one being a solid play
Previous Main Watch:
TSLA - Played out solid for anyone who scalped at open
RBLX - dropped 12.5% premarket off of news. Completely invalidated. What a shame.
Watchlist Stats
1/1 on Spy Predictions
1/2 Main Watch Plays
Personal Stats:
1/1 on the week
Overall Green
- scalped puts today on SPY for a nice 30% win

NAS 100 | NASDAQ | DECRYPTERS Hi welcome to Decrypters
The Setup is Clear we are expecting over All Nasdaq to go up Before Collapsing to the Down side
we\ll play the chart what ever comes first ( I prefer long from down side )
we are attaching last post link As referal post

NAS100 | RECESSION |DECRYPTERSHi Welcome to Team Decrypters
The Chart Aligns completely with "FAMOUS Wall street cheat sheet"
What Features coincides with charts ??
1-It give a proper DIP
2-A HUGE MULTI Y ear Rally
3 -Covid Crash Dip
4-Top Blow
5- Creating low and than Lower LOW
6-Multi months consolidations ( with in a continuation Pattern)
Lastly , Using Pure Technical niche we get Target :- "HEIGHT of Flag" = "Target of Flag"
Surprisingly That Target is Exactly on the top of COVID PEAK
Which further Aligns with FED PRINTING OF MONEY , So FED need to Fill that GAP
For example:- if you input 100kW of Energy and The out put will be Same 100KW ( in Other form)
The printed Money should Be Reversed in Same Way
Fundamental Reason :- We think if Recession comes which will make $$$$ TO RALLY ABOUT 8% -12 %
Fed Agree with recession Also they need Strong $$ to crush economy , making consumer confidence Down and thus making consumer spending Down as well
"CAUSING STOCK MARKET CRASH "
NOTE :- THIS MULTI MONTHS PLAN ONLY USED BE USED AS A "QUARTERLY BIAS"

XAUUSD Potential Forecast | 10th April 2023
Technical Confluences
1. GOLD is reached the 2k regions.
2. Important psychological level/ all time highs at 2067.
3. Bullish trend on GOLD with HH and HL forming.
4. Price has rejected the H4 support at 1989 and is currently showing bullish PA.
Idea
We are looking for price continue heading bullish to tap into the nearest swing high at 2032.
NOT FINANCIAL ADVICE DISCLAIMER
The trading related ideas posted by OlympusLabs are for educational and informational purposes only and should not be considered as financial advice. Trading in financial markets involves a high degree of risk, and individuals should carefully consider their investment objectives, financial situation, and risk tolerance before making any trading decisions based on our ideas.
We are not a licensed financial advisor or professional, and the information we are providing is based on our personal experience and research. We make no guarantees or promises regarding the accuracy, completeness, or reliability of the information provided, and users should do their own research and analysis before making any trades.
Users should be aware that trading involves significant risk, and there is no guarantee of profit. Any trading strategy may result in losses, and individuals should be prepared to accept those risks.
OlympusLabs and its affiliates are not responsible for any losses or damages that may result from the use of our trading related ideas or the information provided on our platform. Users should seek the advice of a licensed financial advisor or professional if they have any doubts or concerns about their investment strategies.

DXY Potential Forecast | Pre NFP | 3rd April 2023Fundamental Backdrop
1. Plenty of USD news happening along the week.
2. All eyes will be on NFP.
3. At Olympus, we are forecasting payrolls to print <250k compared to 311k previous.
4. There has been multiple economic data release on the USD, highlighting the slow down of its economy and inflation.
5. ISM manufacturing PMI releasing later on in the day and forecasted 47.4 compared to 47.7 previous.
6. Anticipating USD to have more softer prints which will incentive Fed to take on a more dovish approach.
Technical Confluences
1. H4 support at 101.67.
2. Price could potentially come lower to the support at 101.67.
3. Price currently hovering at the H4 resistance at 1102.899 and is rejecting it.
4. Anticipating further downside momentum on DXY.
Idea
Anticipating bearish price action on DXY for the week and for price to potentially break the H4 support at 101.6.
NOT FINANCIAL ADVICE DISCLAIMER
The trading related ideas posted by OlympusLabs are for educational and informational purposes only and should not be considered as financial advice. Trading in financial markets involves a high degree of risk, and individuals should carefully consider their investment objectives, financial situation, and risk tolerance before making any trading decisions based on our ideas.
We are not a licensed financial advisor or professional, and the information we are providing is based on our personal experience and research. We make no guarantees or promises regarding the accuracy, completeness, or reliability of the information provided, and users should do their own research and analysis before making any trades.
Users should be aware that trading involves significant risk, and there is no guarantee of profit. Any trading strategy may result in losses, and individuals should be prepared to accept those risks.
OlympusLabs and its affiliates are not responsible for any losses or damages that may result from the use of our trading related ideas or the information provided on our platform. Users should seek the advice of a licensed financial advisor or professional if they have any doubts or concerns about their investment strategies.

USDCHF Potential Forecast | 3rd April 2023Fundamental Backdrop
1. CHF CPI m/m increased by 0.2%, much lower than the forecast 0.4% and previous 0.7% m/m.
2. The softer print of CPI shows that inflation has been slowing down at a much faster rate which could signify a dovish landing on the SNB.
3. Market Open on Dollar has been very bullish, however, with NFP lurking this week, expect plenty of volatility in the market.
4. USD ISM Manufacturing PMI releasing later on in the day and market has been pricing in a 47.5 compared to 47.7 previous.
Technical Confluences
1. H4 resistance level at 0.921.
2. H4 support level at 0.9085.
3. Price could potentially retest the resistance level at 0.921.
Idea
Given the weak CPI reading on CHF, there is a weak bullish outlook on USDCHF as upcoming ISM news on USD is also slated to be a softer print.
NOT FINANCIAL ADVICE DISCLAIMER
The trading related ideas posted by OlympusLabs are for educational and informational purposes only and should not be considered as financial advice. Trading in financial markets involves a high degree of risk, and individuals should carefully consider their investment objectives, financial situation, and risk tolerance before making any trading decisions based on our ideas.
We are not a licensed financial advisor or professional, and the information we are providing is based on our personal experience and research. We make no guarantees or promises regarding the accuracy, completeness, or reliability of the information provided, and users should do their own research and analysis before making any trades.
Users should be aware that trading involves significant risk, and there is no guarantee of profit. Any trading strategy may result in losses, and individuals should be prepared to accept those risks.
OlympusLabs and its affiliates are not responsible for any losses or damages that may result from the use of our trading related ideas or the information provided on our platform. Users should seek the advice of a licensed financial advisor or professional if they have any doubts or concerns about their investment strategies.

S&P 500| SHORT INCOMING | DECRYPTERS Hi people welcome to Team Decrypters
POTENTIAL SHORT SETUP
We Expecting short term Retracement At least ( orange path)
Long term Target ( yellow path could be followed )
FED has cleared they will Keep Rate hikes ELEVATED for long time , Markets are pricing in Future Rate cuts
i don't think there will be ANY RATE CUTS ,probably 1 more Rate hike and than pause and than keep the RATE HIKES Stay There.
People will Start to spend Less
This will Surely cause RECESSIONARY ENVIOREMENT
Which will cause Earnings to DROPS , Meaning Companies EVALUATION will DROP
Markets Can even CRASH IN MY OPINION ( circumstances can change later but for not it SEEMS)
NOTE :- NASDAQ PREVIOUS CHART linked so in short Nasdaq will Follow S&P 500 Same things Apply for NASDAQ

BNB distro/harmonicsBNB still higher for now BTC is in a sub wave 4 currently but macro wave 5 when that's completed BNB cypher should be too

Mc Donalds showing strong upside with a Falling Wedge - SMCFalling Wedge has formed on Mc Ds
The price broke up showing strong upside.
7>21>200 - Bullish
RSI >50 = Bullish - Higher lows
Target $289.50
SMC:
Sell Side Liquidity was swept at the very strong support. Once this happened, Smart Money bought into the orders pushing it up.
Now it's clearly showing strong upside to come.

EURUSD Potential Forecast | 30th March 2023Fundamental Backdrop
1. EURUSD has been bullish
2. Tonight's final GDP q/q for the US could give us an insight on the US economy
3. Market has been pricing in a bullish economy for the US which could potentially lead to short term downside potential in EURUSD
Technical Confluences
1. Price is nearing the resistance level at 1.0881 and could see rejection off this area
2. Any short positions or ideas would be an intraday perspective, especially given the uncertainty in the market currently.
Idea
With a medium bearish bias for the EURUSD today, price could potentially tap into the H4 support at 1.0755.
NOT FINANCIAL ADVICE DISCLAIMER
The trading related ideas posted by OlympusLabs are for educational and informational purposes only and should not be considered as financial advice. Trading in financial markets involves a high degree of risk, and individuals should carefully consider their investment objectives, financial situation, and risk tolerance before making any trading decisions based on our ideas.
We are not a licensed financial advisor or professional, and the information we are providing is based on our personal experience and research. We make no guarantees or promises regarding the accuracy, completeness, or reliability of the information provided, and users should do their own research and analysis before making any trades.
Users should be aware that trading involves significant risk, and there is no guarantee of profit. Any trading strategy may result in losses, and individuals should be prepared to accept those risks.
OlympusLabs and its affiliates are not responsible for any losses or damages that may result from the use of our trading related ideas or the information provided on our platform. Users should seek the advice of a licensed financial advisor or professional if they have any doubts or concerns about their investment strategies.

BTC three peaks domed housethree peaks domed house playing out nicely as well as the fractal below. still looking for 24k area before we work our way back up for the bull trap

USDJPY Potential Forecast | 28th March 2023Fundamental Backdrop
1. Plenty of uncertainty surrounding the banking and financial system/ USD.
2. JPY continues to be the more stable currency.
Technical Confluences
1. Price in a strong bearish trend with price under the Ichimoku cloud
2. Lower lows and lower highs are being formed
3. Price can potentially retest the support level at 129.82.
Idea
Looking for bearish trend continuation and for price to tap into the key support level at 129.82.
NOT FINANCIAL ADVICE DISCLAIMER
The trading related ideas posted by OlympusLabs are for educational and informational purposes only and should not be considered as financial advice. Trading in financial markets involves a high degree of risk, and individuals should carefully consider their investment objectives, financial situation, and risk tolerance before making any trading decisions based on our ideas.
We are not a licensed financial advisor or professional, and the information we are providing is based on our personal experience and research. We make no guarantees or promises regarding the accuracy, completeness, or reliability of the information provided, and users should do their own research and analysis before making any trades.
Users should be aware that trading involves significant risk, and there is no guarantee of profit. Any trading strategy may result in losses, and individuals should be prepared to accept those risks.
OlympusLabs and its affiliates are not responsible for any losses or damages that may result from the use of our trading related ideas or the information provided on our platform. Users should seek the advice of a licensed financial advisor or professional if they have any doubts or concerns about their investment strategies.


XAUUSD | GOLD | DECRYPTERS | Hi welcome To Team Decrypters
Detailed Analysis On GOLD :-
--Expecting Retracement on DXY & BONDS -
--Bearish Harmonic Setups-
--Divergence -
--Retracement is DUE ( 50% - 60% ) -
-- Premium zone / IMB / V- Liquidity -
-- Pith fork Top-
-- Double top / Triple Top-
-- Daily Tweezer Top -
--Reminder We have Cup & Handle and Bull Flag on MONTHLY chart of Gold
( I Seriously Think We will see ALL TIME HIGH In GOL this year)
NOTE :- We May still see A move to the Upside for next 1-2 Weeks ( 5-12 April )
Personal Opinion :- ( I still Think we should see a wick to the upside before proper downward in Movement )

GBPUSD | EURUSD | DECRYPTERSHi Welcome to Decrypters
Our BIAS for this week is Bearish GBPUSD & EURUSD
-We are in Premium Zone
-Expecting Bonds and Dxy RE- Trace
-Volume & Liquidity Gaps
-Old high + Double Top ( euro )
Note :- Euro CPI News Should be Traded Carefully

DXY | TBONDS | ZB1 |DECRYPTERS HI people Welcome to Team DECRYPTERS
BRIEF Views with connecting DOTS:-
--We are Expecting a DUE Retracement on DXY This week At least to TARGET 1 -
--TARGET 2 will Still be on Cards -
-- ZB1! ( T BONDS YEILD )We are Also EXPECTING them to Rise up as manipulation Move ( 2nd Quarter ).
-- We Also EXPECT LONG TERMS Bonds will Also face INFLOW of MONEY.
--Also peak in rates is probably to be in , so Bonds can Rally .


Weekly analysis USDJPY.For this week I like to share about USDJPY ideas. We clearly can see the structure still move like a normal market. Lower High, Lower Low. I expect the price will do Lower High at level that I'll markup. But, we must be neutral in the market. Don't blindly entry without any PRICE ACTION. Don't take this analysis as signal.
