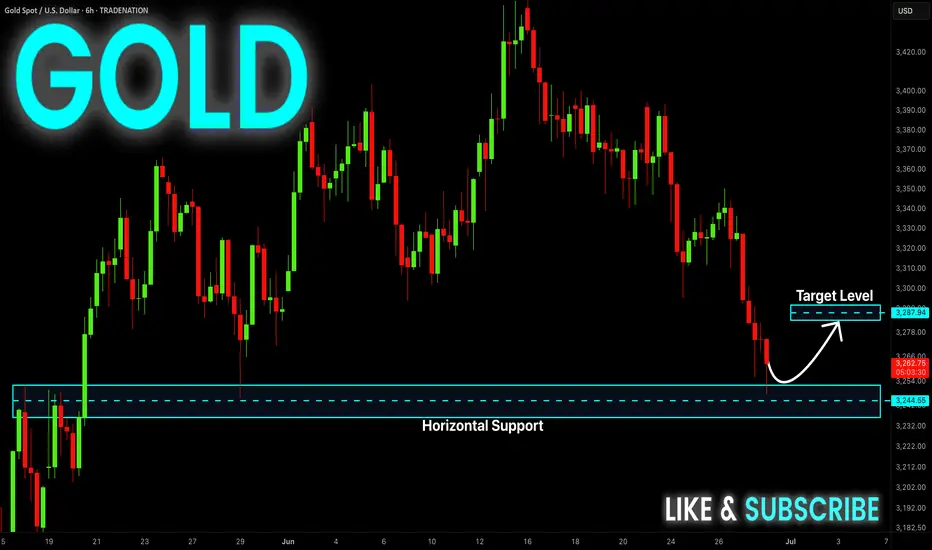
GOLD WILL FALL|SHORT|
✅GOLD is trading in a
Downtrend and the price is
Making a typical rebound but
After the horizontal resistance
Level above around 3,300$ is
Retested we will be expecting
A further bearish move down
SHORT🔥
✅Like and subscribe to never miss a new idea!✅
Disclosure: I am part of Trade Nation's Influencer program and receive a monthly fee for using their TradingView charts in my analysis.
SMC

GBP-CHF Bearish Breakout! Sell!
Hello,Traders!
GBP-CHF formed a H&S
Pattern and now we are
Seeing a strong bearish
Breakout of the neckline
Key level around 1.0933
Area and as the breakout
Is confirmed we will be
Expecting a further bearish
Move down towards the
Target below around 1.0867
Sell!
Comment and subscribe to help us grow!
Check out other forecasts below too!
Disclosure: I am part of Trade Nation's Influencer program and receive a monthly fee for using their TradingView charts in my analysis.

Internal and external liquidity Here's another mechanical lesson for you.
In my last post I covered a mechanical technique to identify swing ranges. Rule-based, simple and repeatable.
In this post, I want to share another little technique, again part of the mechanical series. But this time I want to talk about liquidity.
Most traders talk about liquidity, they might even have a grasp of what it is. But most do not know how liquidity forms the sentiment and how that creates a type of algo for the market.
You might have heard of Elliott wave theory. There is a saying along the lines of "you ask 10 Elliott traders for their count and you get 11 answers".
But the point is here, when you simplify the concept, it's clear to see that sentiment caused by liquidity swings is what causes a repeatable pattern in the market.
Let's take the idea of the ranges from my last post.
Now after a fair amount of accumulation, this level becomes "defended" - the price will gradually move up until old short stop losses are tagged and new long entries are entered into.
This allows the institutional players to open up their orders without setting off the alarm bells.
Price then comes back from external liquidity to find internal liquidity (more on this in a later post).
But then it looks for the next fresh highs.
As the highs are put in, we can use the range technique to move our range to the new area as seen in the image above.
Next we will be looking for an internal move, not just internal to the range, but a fractal move on the smaller timeframe that drives the pullback down. See this in blue.
The logic here is simple; on the smaller timeframes we have witnessed an accumulation at the 2 region and as we spike up for 3; we will witness a distribution on the smaller timeframes.
Wyckoff called this the accumulation, followed by a mark-up and then the distribution and a mark-down.
It is this pattern, over and over again that leads to this type of structure.
This will then be re-branded by various analysts who will call it things like a head and shoulders, smart money will see a change of character and a retest before breaking the structure.
This is all the same thing - just a different naming convention.
Again, I hope this helps some of you out there!
Disclaimer
This idea does not constitute as financial advice. It is for educational purposes only, our principal trader has over 25 years' experience in stocks, ETF's, and Forex. Hence each trade setup might have different hold times, entry or exit conditions, and will vary from the post/idea shared here. You can use the information from this post to make your own trading plan for the instrument discussed. Trading carries a risk; a high percentage of retail traders lose money. Please keep this in mind when entering any trade. Stay safe.

EURUSD BUY SETUP 1:5HELLO HOW ARE YOU ?
What i think about market ?
I Think the market will take liquidity
and will reach imbalance , then touch the supply area
and last will go up boooom

DXY: Local Bullish Bias! Long!
My dear friends,
Today we will analyse DXY together☺️
The market is at an inflection zone and price has now reached an area around 96.706 where previous reversals or breakouts have occurred.And a price reaction that we are seeing on multiple timeframes here could signal the next move up so we can enter on confirmation, and target the next key level of 96.819.Stop-loss is recommended beyond the inflection zone.
❤️Sending you lots of Love and Hugs❤️

BTCUSDT in a sell zone Let's keep it simple.
The IOF is bearish on the H4 timeframe.
Price has retraced to a premium zone.
Technically, once we see a lower timeframe confirmation from these zones, we take a sell.
While I'm eyeing the liquidity at 109050, any break below 106415 will usher us into a sell towards 99000.
Use your proper entry confirmation and risk management.

SILVER: Strong Growth Ahead! Long!
My dear friends,
Today we will analyse SILVER together☺️
The price is near a wide key level
and the pair is approaching a significant decision level of 36.170 Therefore, a strong bullish reaction here could determine the next move up.We will watch for a confirmation candle, and then target the next key level of 36.429.Recommend Stop-loss is beyond the current level.
❤️Sending you lots of Love and Hugs❤️

EURUSD: Will Go Down! Short!
My dear friends,
Today we will analyse EURUSD together☺️
The recent price action suggests a shift in mid-term momentum. A break below the current local range around 1.17225 will confirm the new direction downwards with the target being the next key level of 1.17114.and a reconvened placement of a stop-loss beyond the range.
❤️Sending you lots of Love and Hugs❤️

GOLD: The Market Is Looking Down! Short!
My dear friends,
Today we will analyse GOLD together☺️
The in-trend continuation seems likely as the current long-term trend appears to be strong, and price is holding below a key level of 3,295.36 So a bearish continuation seems plausible, targeting the next low. We should enter on confirmation, and place a stop-loss beyond the recent swing level.
❤️Sending you lots of Love and Hugs❤️

ETHEREUM WILL GROW|LONG|
✅ETHEREUM consolidated
Above the horizontal support
Around 2400$ and now we are
Finally seeing a bullish rebound
So we are bullish biased and
We will be expecting a
Further move up
LONG🚀
✅Like and subscribe to never miss a new idea!✅
Disclosure: I am part of Trade Nation's Influencer program and receive a monthly fee for using their TradingView charts in my analysis.

GOLD Support Ahead! Buy!
Hello,Traders!
GOLD keeps falling just
As I predicted but the price
Will soon hit a horizontal support
Around 3235$ from where we
Will be expecting a local
Bullish rebound
Buy!
Comment and subscribe to help us grow!
Check out other forecasts below too!
Disclosure: I am part of Trade Nation's Influencer program and receive a monthly fee for using their TradingView charts in my analysis.
EUR_AUD LOCAL SHORT|
✅EUR_AUD is going up now
But a strong resistance level is ahead at 1.8018
Thus I am expecting a pullback
And a move down towards the target of 1.7900
SHORT🔥
✅Like and subscribe to never miss a new idea!✅
Disclosure: I am part of Trade Nation's Influencer program and receive a monthly fee for using their TradingView charts in my analysis.

GBPJPY ForecastLooking long up to 200.00 levels then seeking bearish PA to test the June lows. This is only validated on bearish PA on H4 or Daily.

ETHUSD: Strong Bearish Sentiment! Short!
My dear friends,
Today we will analyse ETHUSD together☺️
The market is at an inflection zone and price has now reached an area around 2,437.2 where previous reversals or breakouts have occurred.And a price reaction that we are seeing on multiple timeframes here could signal the next move down so we can enter on confirmation, and target the next key level of 2,426.5..Stop-loss is recommended beyond the inflection zone.
❤️Sending you lots of Love and Hugs❤️

BTCUSD: Bulls Are Winning! Long!
My dear friends,
Today we will analyse BTCUSD together☺️
The price is near a wide key level
and the pair is approaching a significant decision level of 107,630.73 Therefore, a strong bullish reaction here could determine the next move up.We will watch for a confirmation candle, and then target the next key level of 108,207.06.Recommend Stop-loss is beyond the current level.
❤️Sending you lots of Love and Hugs❤️

H4 Outlook | XAUUSD Monday • June 30 • 2025Hey fam,
Fresh week on gold — clean structure, clean levels, clean execution ahead. Forget the noise. We trade price, we trust precision.
🔍 Market Flow & Bias
Gold remains bearish on the H4 timeframe.
Lower highs, lower lows, clean rejection from supply, and all EMAs (21/50/200) aligned down. RSI hovers near 30, showing heavy momentum — not exhaustion yet.
Price is coiled, not crushed. If structure holds, we follow the short flow into deeper zones.
📌 Bias: Bearish below 3325. Pullbacks into supply = opportunity.
—
🧱 Zones of Interest (Clean & Confluent)
🔺 Zone 1 – 3380–3405 | Extreme Supply
Top OB zone with resting liquidity above. If price sweeps this level and fails, expect a sharp reversal. Only valid with reaction (CHoCH or bearish engulfing).
🔺 Zone 2 – 3325–3350 | Main Supply
Strong H4 breaker block. Origin of the last major selloff. Already defended once — if it holds again, look for sniper shorts from within.
🔺 Zone 3 – 3285–3305 | Frontline Supply
First inducement zone. Clean micro-OB that could give early fade trades. If bulls break through, Zone 2 becomes magnet.
⚖️ Zone 4 – 3260–3240 | Flip Shelf
Range base. If price holds, bulls might step in short-term. But a clean break below shifts momentum fully toward lower demand.
🟢 Zone 5 – 3215–3195 | Main Demand
Unmitigated OB with imbalance. If gold drops here with momentum and forms rejection wicks or CHoCH on LTF → long opportunity for bounce.
🟢 Zone 6 – 3150–3120 | Extreme Demand
Macro swing demand. Deepest discount level on the chart. Valid only if market flushes — this is the “last stand” for buyers.
—
🎯 Key Levels Zone Cheat-Sheet
Above
• 3380–3405 → Extreme Supply (trap zone)
• 3325–3350 → Main Supply block
• 3285–3305 → Micro OB inducement
Below
• 3260–3240 → Flip shelf (structural pivot)
• 3215–3195 → Main buy zone
• 3150–3120 → Deep macro demand
—
⚔️ Execution Plan
We sell from reaction zones, not assumptions.
We buy from confluence, not hope.
Every zone above comes with condition: no confirmation, no entry.
—
📣 Found this useful?
Drop a ⚔️ in the comments, tag your bias, 🚀and follow GoldFxMinds for sniper-level execution.
This isn’t guessing. This is structure. This is clarity.

Daily Outlook | XAUUSD June 30, 2025Hey traders,
Fresh week, clean structure. Let’s lock in the key levels and let price do the talking.
🌐 Macro Context
It’s a heavy week for USD – all major data drops before Friday:
Tuesday: ISM Manufacturing + Powell speaks
Wednesday: ADP Employment
Thursday: NFP, Unemployment Rate, ISM Services
Friday: US holiday – markets closed
📌 This means liquidity will build into Thursday, then fade. Expect gold to stay range-bound early in the week, unless momentum shifts hard today. Volatility should peak around NFP.
🧭 Daily Structure & Bias
Gold opened weak under 3287, still below 21EMA and 50EMA. The structure shows lower highs, bearish control, and no signs of strength reclaiming ground. RSI is at 42 — momentum down, but not oversold yet. Unless price breaks back above 3340, sellers stay in control.
✅ D1 Bias: Bearish while under 3340
📌 Key D1 Zones to Watch
🔺 D1 Breaker Block – 3340–3355
Former support, now clean resistance. Includes 50EMA and last failed closes. If price rejects again here, bearish continuation likely. A daily close above 3355 flips short bias.
🔺 D1 Supply + FVG – 3385–3405
Unmitigated imbalance from early June. If price pushes through 3355, this is the next upside magnet. Good spot for first reaction.
⚖️ D1 Decision Zone – 3287–3265
Current price zone. Multiple past reactions. A daily close below 3265 confirms breakdown. Holding above = more choppy range.
🟢 D1 Reaction Shelf – 3210–3180
Minor support zone from April candle bodies. Can slow price, but not strong enough for reversal on its own.
🟢 D1 Demand Block – 3155–3120
First major HTF demand. Includes 200EMA, strong structure, and previous breakout base. If price sells into it fast, watch for rejection — but only with confirmation.
🟢 D1 Macro Demand – 3090–3055
Final line of macro defense. Clean imbalance + demand from February. Valid only if sentiment breaks post-NFP.
✅ Final Summary
• Below 3265 = structure breaks → opens 3180
• 3155–3120 = real support zone
• Below 3120 = macro shift risk
• Reclaiming 3340 = short bias invalid
• Break above 3385 = continuation possible
📌 Today is all about the close. No confirmation = no trade. Thursday is the real trigger — be positioned, not exposed.
—
📣 If this gave you clarity and structure, drop a 🔥, share your bias, and follow GoldFxMinds for sniper plans with zero fluff — only clean, confirmed price action.

Weekly Outlook | XAUUSD June 30 – July 4, 2025Welcome to a new trading week. Let’s break down the gold chart from a clean, high-timeframe perspective. No setups, no noise – just structure, momentum, and zones that matter.
🌐 Macro Overview
This week concentrates all key USD events into one tight window:
Tuesday: ISM Manufacturing + Fed Chair Powell speech
Wednesday: ADP Employment
Thursday: NFP, Unemployment Rate, ISM Services PMI
Friday: US holiday – markets closed
📌 This means liquidity and momentum will peak by Thursday, then fade into the weekend.
Expect gold to stay in range until macro data breaks direction.
🧠 Weekly Structure & Momentum
Gold remains in a bullish macro structure, but price is hesitating below 3300.
Last two weekly candles printed long upper wicks with no body follow-through – clear sign of distribution, not continuation.
We’re still trading above the 21EMA Weekly, which maintains the uptrend’s integrity.
RSI (14): sitting at ~59 → no real momentum breakout, just consolidation.
📌 The chart is not reversing, but it’s also not trending anymore. We’re in a decision zone.
📍 Key Weekly Areas of Interest
3430 – 3500 → W1 Imbalance + March High Sweep
This is a wide weekly imbalance left unfilled since March, paired with the prior 2024 swing high. 3500 is also a psychological round number. If price pushes into this area, it becomes a liquidity target, not an entry – unless a clear rejection forms.
3330 – 3230 → Weekly Decision Block
This is the current consolidation range. It includes multiple W1 candle bodies, wick highs/lows, and volume cluster.
– Weekly close above 3330 = likely bullish continuation toward 3430+
– Weekly close below 3230 = confirms weakness and opens path to the next major support
3080 – 2970 → Weekly Demand + Fib 38%
Clean block of accumulation from April–May, aligned with the 38.2% retracement of the 2024 rally. This is where we’d expect institutional buying interest on a deeper pullback.
A weekly candle with a long wick into this zone + strong close would reset bullish structure.
2850 – 2720 → Last Macro Demand Zone
This zone includes the 50EMA weekly, a weekly FVG from late 2023, and unmitigated demand before the full 2024 breakout. If price ever gets here, we’re no longer in a healthy uptrend – we’re correcting structurally. But this zone will matter if that happens.
🧭 Summary & Expectations
Gold is still inside a large weekly range.
Until we break above 3330 or below 3230, it’s just consolidation on the HTF.
Thursday’s data will decide the candle.
Don’t predict direction — let the W1 close speak.
📌 Final Notes:
Above 3330 = room toward 3430–3500
Below 3230 = risk opens toward 3080–2970
Inside = no directional edge — stay reactive, not biased
🔥 If you enjoy this clean breakdown: hit that 🚀, follow & drop your thoughts below!
Stay sharp traders — we execute with precision.
— GoldFxMinds

NZD-JPY Potential Short! Sell!
Hello,Traders!
NZD-JPY is slowly approaching
A horizontal resistance level
Around 87.994 so despite
The strong uptrend
We will be expecting a
Local bearish pullback on Monday
Sell!
Comment and subscribe to help us grow!
Check out other forecasts below too!
Disclosure: I am part of Trade Nation's Influencer program and receive a monthly fee for using their TradingView charts in my analysis.
DXY Swing Short! Sell!
Hello,Traders!
DXY keeps falling down
And the index broke the
Key wide horizontal level
Around 97.800 which is now
A resistance and the breakout
Is confirmed so we are very
Bearish biased and we will
Be expecting a bearish
Continuation on Monday
Sell!
Comment and subscribe to help us grow!
Check out other forecasts below too!
Disclosure: I am part of Trade Nation's Influencer program and receive a monthly fee for using their TradingView charts in my analysis.

GBP_CHF RISKY LONG|
✅GBP_CHF fell down sharply
But a strong support level was hit at 1.0932
Thus as a rebound is already happening
A move up towards the target of 1.0970 shall follow
LONG🚀
✅Like and subscribe to never miss a new idea!✅
Disclosure: I am part of Trade Nation's Influencer program and receive a monthly fee for using their TradingView charts in my analysis.

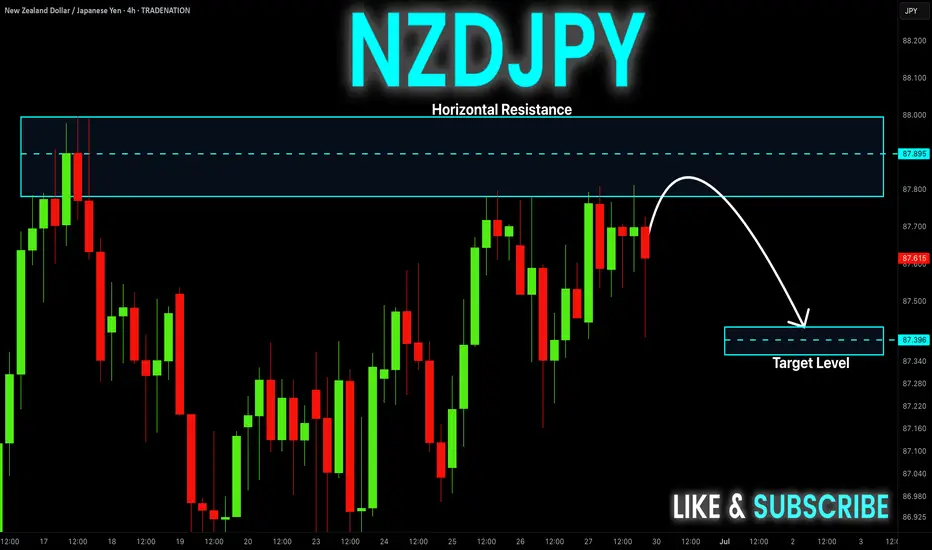
NZD_JPY SHORT FROM RESISTANCE|
✅NZD_JPY is set to retest a
Strong resistance level above at 88.000
After trading in a local uptrend for some time
Which makes a bearish pullback a likely scenario
With the target being a local support below at 87.341
SHORT🔥
✅Like and subscribe to never miss a new idea!✅
Disclosure: I am part of Trade Nation's Influencer program and receive a monthly fee for using their TradingView charts in my analysis.

CHF-JPY Local Long! Buy!
Hello,Traders!
CHF-JPY is trading in a strong
Uptrend and the pair made a
Bullish breakout from the bullish
Triangle pattern and is now seems
To be consolidating above the
Support cluster around 180.740
So we are bullish biased and
We will be expecting a further
Bullish move up on Monday
Buy!
Comment and subscribe to help us grow!
Check out other forecasts below too!
Disclosure: I am part of Trade Nation's Influencer program and receive a monthly fee for using their TradingView charts in my analysis.
