UJ: Could we see a bearish leg looking at the 4h?USD/JPY is currently trading at a key price level of 147.5. We've got a 4h order block about 75 pips to the downside at 146.75.
If we see some lower time frame confirmations, we could potentially see a bearish leg towards this 4h OB today.
- Aman
SMC

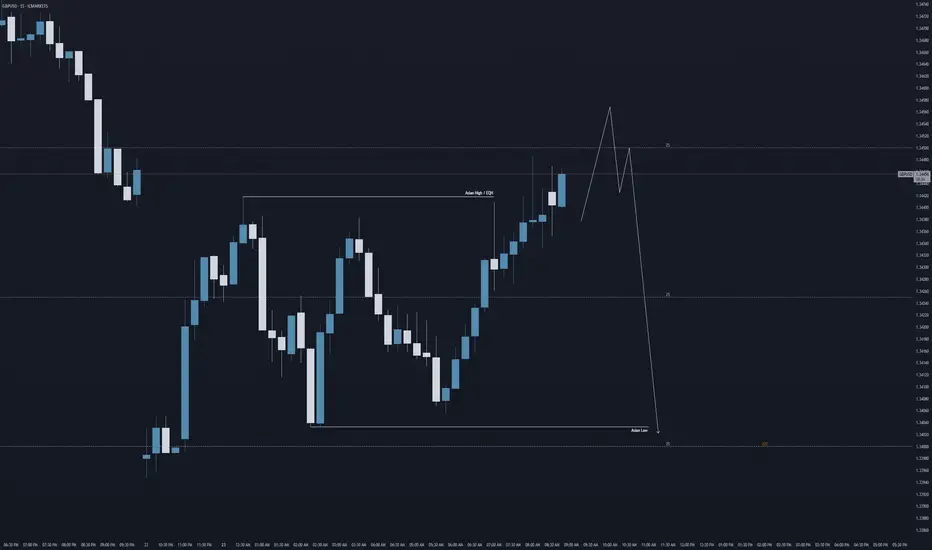
GU: Trading back towards 1.34 today?Hi everyone, hope you've all had a nice weekend.
Looking at GBP/USD this morning, keeping the forecast and analysis simple, but looking at a further bearish run today if we get the right lower time frame price action to confirm...
Looking at a sweep into 1.345 before trading lower, potentially towards 1.34.
Aman
Supply Trap Revisit Before Final Drop? | Smart Money Outlook
📉 Price has recently reacted from a strong FVG + Demand + Liquidity Start Zone (4hr) around 1.1450, confirming bullish intent temporarily.
📈 However, a corrective move is now heading into a 4hr Fair Value Gap (FVG) zone near 1.1520–1.1550, which aligns with a potential lower high setup.
Key Zones:
Supply Zone @ 1.1550 (Caution): Watch for rejection signs here—high confluence with previous imbalance.
Bearish Expectation: After liquidity grab or mitigation in FVG, expect a strong sell-off targeting the 1.1410 level (measured move and 1.618 fib extension).
⚠️ Be cautious of price pushing slightly above 1.1550 to sweep liquidity before reversing.

NZD-CHF Rebound Ahead! Buy!
Hello,Traders!
NZD-CHF made a retest
Of the horizontal support
Level of 0.4847 from where
We are already seeing a
Bullish rebound so we are
Locally bullish biased and
We will be expecting a
Further bullish move up
Buy!
Comment and subscribe to help us grow!
Check out other forecasts below too!
Disclosure: I am part of Trade Nation's Influencer program and receive a monthly fee for using their TradingView charts in my analysis.

EUR_USD RISING SUPPORT AHEAD|LONG|
✅EUR_USD is trading along the rising support
And as the pair will soon retest it
I am expecting the price to go up
To retest the supply levels above at 1.1511
LONG🚀
✅Like and subscribe to never miss a new idea!✅
Disclosure: I am part of Trade Nation's Influencer program and receive a monthly fee for using their TradingView charts in my analysis.

EUR-JPY Bullish Breakout! Buy!
Hello,Traders!
EUR-JPY is trading in an
Uptrend and the pair made
A strong bullish breakout
Of the key horizontal level
Of 168.000 and the breakout
Is confirmed so we will be
Expecting a further bullish
Move up on Monday
Buy!
Comment and subscribe to help us grow!
Check out other forecasts below too!
Disclosure: I am part of Trade Nation's Influencer program and receive a monthly fee for using their TradingView charts in my analysis.

EUR_NZD WILL KEEP GROWING|LONG|
✅EUR_NZD is going up
Now and the pair made a bullish
Breakout of the key horizontal
Level of 1.9250 and the breakout
Is confirmed so we are bullish
Biased and we will be expecting
A further bullish move up on Monday
LONG🚀
✅Like and subscribe to never miss a new idea!✅
Disclosure: I am part of Trade Nation's Influencer program and receive a monthly fee for using their TradingView charts in my analysis.

ETHUSD: Will Go Up! Long!
My dear friends,
Today we will analyse ETHUSD together☺️
The price is near a wide key level
and the pair is approaching a significant decision level of 2,270.9 Therefore, a strong bullish reaction here could determine the next move up.We will watch for a confirmation candle, and then target the next key level of 2,290.8.Recommend Stop-loss is beyond the current level.
❤️Sending you lots of Love and Hugs❤️

BTCUSD: The Market Is Looking Down! Short!
My dear friends,
Today we will analyse BTCUSD together☺️
The recent price action suggests a shift in mid-term momentum. A break below the current local range around 102,641.61 will confirm the new direction downwards with the target being the next key level of 102,364.09.and a reconvened placement of a stop-loss beyond the range.
❤️Sending you lots of Love and Hugs❤️

EUR-GBP Growth Ahead! Buy!
Hello,Traders!
EUR-GBP keeps growing
And the pair is already
Making a bullish rebound
From the horizontal support
Level of 0.8540 so we are
Bullish biased and we will
Be expecting a further
Bullish continuation
Buy!
Comment and subscribe to help us grow!
Check out other forecasts below too!
Disclosure: I am part of Trade Nation's Influencer program and receive a monthly fee for using their TradingView charts in my analysis.

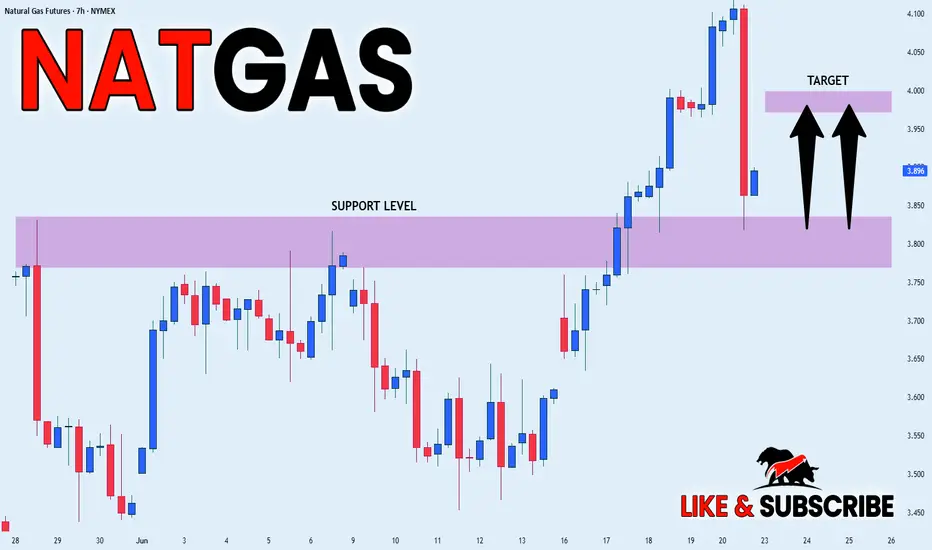
NATGAS REBOUND AHEAD|LONG|
✅NATGAS went down to retest
A horizontal support of 3.820$
Which makes me locally bullish biased
And I think that a move up
From the level is to be expected
Towards the target above at 3.984$
LONG🚀
✅Like and subscribe to never miss a new idea!✅
Disclosure: I am part of Trade Nation's Influencer program and receive a monthly fee for using their TradingView charts in my analysis.
BITCOIN Free Signal! Buy!
Hello,Traders!
BITCOIN is retesting a
Horizontal support level
Around 101,288$ from
Where we will be expecting
A local rebound so we can
Go long with the Take Profit
Of 104,324$ and the Stop
Loss of 100,300$
Buy!
Comment and subscribe to help us grow!
Check out other forecasts below too!
Disclosure: I am part of Trade Nation's Influencer program and receive a monthly fee for using their TradingView charts in my analysis.

USOIL: Strong Bearish Sentiment! Short!
My dear friends,
Today we will analyse USOIL together☺️
The in-trend continuation seems likely as the current long-term trend appears to be strong, and price is holding below a key level of 73.969 So a bearish continuation seems plausible, targeting the next low. We should enter on confirmation, and place a stop-loss beyond the recent swing level.
❤️Sending you lots of Love and Hugs❤️

NG1!: Bulls Are Winning! Long!
My dear friends,
Today we will analyse NG1! together☺️
The market is at an inflection zone and price has now reached an area around 3.894 where previous reversals or breakouts have occurred.And a price reaction that we are seeing on multiple timeframes here could signal the next move up so we can enter on confirmation, and target the next key level of 3.993.Stop-loss is recommended beyond the inflection zone.
❤️Sending you lots of Love and Hugs❤️

NI225: Next Move Is Up! Long!
My dear friends,
Today we will analyse NI225 together☺️
The price is near a wide key level
and the pair is approaching a significant decision level of 38,501.82 Therefore, a strong bullish reaction here could determine the next move up.We will watch for a confirmation candle, and then target the next key level of 38,689.93.Recommend Stop-loss is beyond the current level.
❤️Sending you lots of Love and Hugs❤️

EUR_CHF CORRECTION AHEAD|SHORT|
✅EUR_CHF is set to retest a
Strong resistance level above at 0.9446
After trading in a local uptrend for some time
Which makes a bearish pullback a likely scenario
With the target being a local support below at 0.9410
SHORT🔥
✅Like and subscribe to never miss a new idea!✅
Disclosure: I am part of Trade Nation's Influencer program and receive a monthly fee for using their TradingView charts in my analysis.

NZD_USD WILL GO DOWN|SHORT|
✅NZD_USD is going down currently
As the pair broke the key structure level of 0.6030
Which is now a resistance, and has made a pullback
And the retest, so I think the price will keep going down on Monday
SHORT🔥
✅Like and subscribe to never miss a new idea!✅
Disclosure: I am part of Trade Nation's Influencer program and receive a monthly fee for using their TradingView charts in my analysis.

NASDAQ Bullish Play into Liquidity Before Potential ReversalForecast:
NOTE: At this moment, this is a forecast and trades will be taken dependent on live PA.
Price has reacted strongly off the 21,410–21,430 Daily Order Block, suggesting bullish intent. If bullish structure holds, I expect a move into the 22,060–22,130 liquidity zone, where sell-side setups could form.
This is a classic Buy to Sell model:
Buy from OB at ~21,420
Target liquidity above recent highs (~22,100+)
Look for shorts after sweep into 22,130–22,220 range
Invalidation: Break and close below 21,410 suggests the OB failed — potential deeper drop toward 20,700.

NASDAQ READY TO CONTINUE THE LONG-TERM WEEKLY BULLISH RUN
FX:NAS100
I just entered this buy trade on Nasdaq on the daily time frame.
The trade setup is a Swing trade following the monthly and weekly orderflow.
The Monthly is bullish, the weekly is also bullish, so I entered on the daily time frame retracement.
My overall take profit is a risk reward of 1:4.

AMD IS READY FOR A STRONG BULLISH MOVENASDAQ:AMD Right now, am extremely bullish on AMD.
I expect AMD to give a good bullish run to trail NVIDIA.
Technically, AMD is supper bullish right now, having had a multiple bullish break of structure on the daily time frame.
I took a long entry on the bullish break of structure on daily time frame. Stop loss is below the recent structure swing low.
What do you see on your chart?

H4 Outlook – Between Flip and Trap👋 Hey Gold minds, welcome to another sniper-level breakdown. We're mid-range between major sweep zones and watching carefully how price reacts around the current compression under key EMAs and FVG. Let’s break it down:
🔸 MACRO + FUNDAMENTAL CONTEXT
USD drivers this week:
🔹 Monday–Tuesday: Multiple FOMC Members speaking
🔹 Wednesday: Powell Testimony
🔹 Thursday: Final GDP + Unemployment Claims
🔹 Friday: Core PCE and UoM Inflation Expectations
Macro sentiment:
FOMC speakers remain hawkish while inflation is sticky. Gold reacts defensively as markets price in Powell’s tone. Liquidity traps on both sides still active. Gold consolidates below key liquidity at 3405, potentially setting up for either expansion or sweep rejection.
🔸 H4 STRUCTURE + BIAS
Market structure:
Price formed a Lower High (3452) and confirmed bearish intent with a break of structure to the downside (CHoCH & BOS).
Currently compressing under H4 Fair Value Gap and retesting an internal OB + EQ zone around 3360–3370, showing signs of rejection.
EMA Cluster:
Price is compressing between EMA 21 / 50 / 100, failing to reclaim EMA100.
EMA5 is crossing under EMA21 – short-term bearish bias holds.
Bias: 🔻 Bearish to neutral
As long as price stays under 3380, supply remains in control. Only a break and close above 3405–3415 would flip bias bullish short term.
🧭 Sniper Zones – H4 Precision Map
🔷 Type 📍 Price Zone 📌 Justification
🔵 Buy Zone #1 3315 – 3340 Valid OB , previous HL structure, FVG reaction support
🔵 Buy Zone #2 3280 – 3302 Deeper demand pocket, untapped imbalance
🟠 Flip Zone 3360 – 3380 FVG + internal OB + EMA compression = key battle zone
🔴 Sell Zone #1 3405 – 3415 Internal OB + unmitigated premium zone under LH
🔴 Sell Trap Zone 3440 – 3460 Extreme rejection zone — 3452 HH sweep logic + OB
🔸 Price Action Expectations (PA)
If price rejects 3360–3380, expect a clean push back to 3320, with possible deeper draw to 3300–3285.
A clean break and close above 3380 (not just a wick) may open the door for a sweep of 3405, where sellers are expected.
Only an aggressive news-driven breakout above 3415 would unlock the final trap zone toward 3450+ – lower probability unless Powell surprises.
✅ Conclusion & Execution Plan
🎯 Watch how price behaves around the Flip Zone — this is the decision point.
📉 Main bearish confirmation = strong rejection at Flip Zone or 3405.
📈 Bullish continuation only above 3415 with volume and closing strength.
💎 Best RR zones:
Sell 3405–3420 → targeting 3360 / 3340
Buy 3315–3340 → targeting 3360 / 3380
🔥 If this breakdown helped sharpen your edge, drop a 🚀 in the comments and like the post!
🔔 Follow GoldFxMinds for more real-time, structure-based sniper plans.
🧠 Precision isn't optional. It's the edge.
🔹 Disclosure: As part of Trade Nation’s Influencer Program, we receive monthly compensation for using their charts.
GoldFxMinds

XAUUSD Daily Outlook | June 23, 2025👋 Hello Gold traders!
We’re entering a new week with structure sharpening around key zones. Price is now hovering just below the decision shelf at 3385, and all eyes are on whether bulls defend structure — or bears trigger the first real trap. Let’s zoom in with pure Daily focus and zero noise.
🔸 DAILY STRUCTURE OUTLOOK
Gold remains in a clear bullish trend on the Daily timeframe, with the last confirmed Higher High at 3452. However, current price is in a retracement phase, testing the area just below the BOS and reacting to recent liquidity sweeps.
Despite rising USD pressure, the bullish structure remains intact unless a daily close breaks below 3315.
📌 Daily Bias: Bullish (retracement phase active)
🧭 Macro Context:
Heavy Fed week: Powell testifies Tue & Wed, Core PCE and Consumer Sentiment hit Fri.
USD may remain supported short-term, but gold still benefits from long-term inflation hedge + geopolitical risk flows.
🔹 STRUCTURAL KEY ZONES (D1)
Type Zone Confluences
🟢 Buy Zone #1 3320 – 3340 Daily OB, FVG base, EMA50 , structure HL defense
🔵 Buy Zone #2 3265 – 3285 Untapped OB + imbalance, deeper fib retrace
🟠 Flip Zone 3363 – 3385 Former BOS, FVG retest, minor liquidity shelf
🔴 Sell Zone #1 3405 – 3425 First sweep of equal highs, premium OB, FVG pocket
🔴 Sell Zone #2 3440 – 3460 Extreme bull trap: clean OB top, imbalance cluster
🎯 EXECUTION PLAN
🔍 Flip Zone is your battlefield — if bulls reclaim this zone cleanly, we may revisit 3405.
📉 3405–3425 offers the first sniper short opportunity: liquidity sweep + OB + FVG = prime short trigger.
📈 3320–3340 is the cleanest high-RR long zone — only enter if price reacts with strength and forms a rejection candle or bullish engulfing.
🧊 If 3320 fails, standby at 3265–3285 for a deeper correction entry backed by clean OB/FVG logic.
✅ SUMMARY & ACTION PLAN
Wait for confirmation at the Flip Zone — do not force direction.
Most precise sniper trades expected:
🔻 Sell from 3405–3425 → target Flip Zone
🔺 Buy from 3320–3340 → target 3385–3400
Only engage with clear OB reactions and strong PA confirmation — no bounce chasing.
💬 If this outlook gave you clarity, drop a 🚀 and a like to support the work — it helps more traders find it.
💡 Got feedback or want to ask something? Comment below — we read everything.
📌 Follow GoldFxMinds for high-precision sniper plans, every single day.
📌 Disclaimer: I'm part of Trade Nation's Influencer Program and receive compensation for using their charts on TradingView. This content is for educational purposes only.
— GoldFxMinds

XAUUSD Weekly Outlook | June 23–27, 2025👋 Hey gold traders! As we close out the FOMC week and head into the final stretch of June, gold continues to hold bullish structure — but this week's candle is entering a very sensitive premium area. Let's break it all down in full top-down clarity:
🔍 Weekly Structure Update
✅ Weekly BOS confirmed since November 2023
✅ Price holding above EMA 5/21/50 — bullish lock intact
🔼 Current HH printed at 3452
📍Price is now entering a weekly FVG + supply trap zone around 3440–3460
🟣 RSI divergence starting to appear — caution in premium
🗺 Key Weekly Zones
Type Price Range Context
🔵 Demand Zone 3150 – 3190 Weekly OB + EMA50 confluence
🟣 FVG Support 3284 – 3320 Fresh imbalance post BOS
🟠 Flip Zone 3363 – 3385 Retest of BOS + FVG bottom
🔴 Sell Trap Zone 3440 – 3460 Weekly OB + liquidity sweep area
🧠 Bias This Week
📌 Bullish, but extended.
We expect a reaction from 3440–3460, not blind continuation.
The next healthy buy opportunity is only valid on a retrace toward 3320–3280, aligned with imbalance + structure.
🧭 GoldFxMinds Game Plan
Above 3440–3460 = overextension — wait for trap/sweep confirmation 🧨
Below 3363 = bearish flip zone — risk of revisiting 3280
Ideal buy = 3284–3320 → only on bullish PA or reversal confirmation
📰 Upcoming Economic Events (June 23–27)
🗣 FOMC Speakers flood the week (Waller, Powell, Williams, Goolsbee, Hammack, etc.)
🏠 Existing & New Home Sales, Consumer Confidence, Pending Home Sales
🛢 Crude Oil & Natural Gas Inventory reports
📊 Final GDP q/q, Core PCE, Personal Spending/Income
📉 Durable Goods, Unemployment Claims
🧪 Bank Stress Test Results (Friday)
⚠️ This is a dense news week — stay alert for surprise volatility, especially around Powell’s testimonies (Tue & Wed).
⚠️ Summary:
We are no longer in discount — we are inside the premium trap. Gold remains bullish, but 3440–3460 is a red flag zone. If this becomes the top, watch the flip at 3363–3385. Only re-enter long if structure confirms.
💬 If you found this helpful, drop a comment, give it a like, and make sure to follow GoldFxMinds for more sniper-level updates every week!
📣 This post was made using the Trade Nation chart feed. As a partner in their influencer program, I receive compensation for using and sharing their tools.
