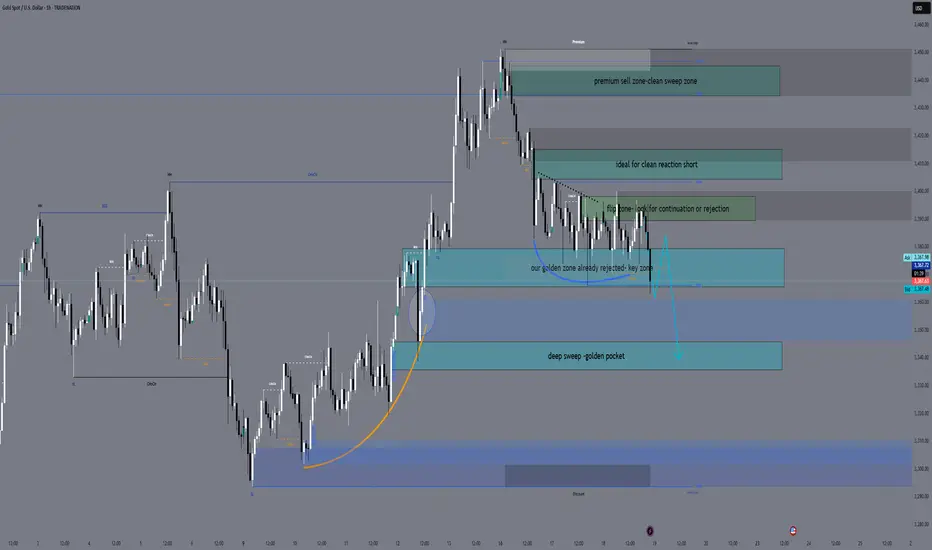
June 19 XAUUSD Setup — FOMC Aftershock or Bull Trap? Hey traders 👋
After yesterday’s FOMC fireworks and a weak reaction to initial retail sales data, gold broke structure into 3363 and is now floating below key resistance. Price is compressing under the previous H1 lower high, and liquidity continues to build on both sides — perfect conditions for engineered spikes.
Let’s break it down clearly.
🌍 Macro & Sentiment
Yesterday’s FOMC left rates unchanged, but Fed tone leaned hawkish.
Retail Sales and Unemployment Claims disappointed — slight downside pressure on the dollar.
Geopolitical front remains tense: no ceasefire in Gaza, Iran-Israel rhetoric escalates, and Russia-Ukraine conflict is ongoing.
Liquidity is king — and gold is being boxed for the next big move.
📉 Bias & Structure
Daily: Compression after FOMC, lower high remains in control.
H4: Bearish break below 3380, EMA21 hovering above price.
H1: Trendline structure broken, EMA5/21 forming bearish cross, RSI below 50.
Fibo: H1 drawn from 3452 to 3363 — key golden zone at 3405–3415.
🎯 Bias: Tactical Bearish under 3415 — looking for short-term bounces or premium traps to sell.
🧠 Sniper Zones
🔻 Sell Zones
1️⃣ 3405 – 3415
→ Key golden zone + EMA21 + FVG
→ Monitor M15/M5 rejection for continuation sells
2️⃣ 3435 – 3445
→ Premium OB trap zone
→ If price spikes irrationally, this becomes the extreme reversal area
🔺 Buy Zones
1️⃣ 3365 – 3380
→ Golden buy zone — real fib confluence
→ Already tapped today, but any clean retest may offer reactive bounce trades
2️⃣ 3335 – 3345
→ Extreme flush zone — only valid if deep dump occurs
→ Watch for exhaustion and M15 reversal confirmation
🔻 Emergency Buy Zone:
3305 – 3292
🧠 Why this zone?
✅ H4 untested Order Block + FVG (June 11 candle).
✅ 78.6% Fibonacci retracement (H1 swing from 3452 → 3363).
✅ RSI likely to print oversold.
✅ Deep discount structure — potential final inducement for reversal.
🔔 Important:
This is a backup zone, not for blind entries.
It only becomes active if 3335 breaks with conviction (full candle body close + volume).
Look for M15/M5 confirmation (divergence + price action signal) before engaging.
🔄 Flip Zone
3390 – 3398
→ Volume zone from FOMC + OB test
→ If reclaimed cleanly, may flip intraday bias short-term
📌 Battle Notes
Gold tapped 3363 today, reacting mildly.
If price retraces toward 3405–3415, I’ll watch for shorts — but no early entries.
Below 3365, watch for another bounce or setup around 3345.
Flip zone remains indecisive until confirmed with volume.
🧭 Plan Recap
→ Bearish under 3415
→ Pullback into 3405–3415 = short setup
→ Retest 3365–3380 = bounce watch
→ Flush into 3335 = reversal zone
→ 3435+ = irrational spike trap
🧠 Stay sniper. Wait for price to come to your zones — and execute only on confirmed reactions.
—
🚀 If this helped bring clarity, tap that 🚀, leave your bias in the comments, and hit FOLLOW for real structure-based trading.
🟨 Disclosure: I am part of TradeNation's Influencer program and receive a monthly fee for using their TradingView charts in my analyses and educational articles.
— GoldFxMinds 🧠✨
SMC
DXY: Bulls Are Winning! Long!
My dear friends,
Today we will analyse DXY together☺️
The recent price action suggests a shift in mid-term momentum. A break above the current local range around 98. 059 will confirm the new direction upwards with the target being the next key level of 98.148 and a reconvened placement of a stop-loss beyond the range.
❤️Sending you lots of Love and Hugs❤️

GOLD: Next Move Is Up! Long!
My dear friends,
Today we will analyse GOLD together☺️
The in-trend continuation seems likely as the current long-term trend appears to be strong, and price is holding above a key level of 3,382.62 So a bullish continuation seems plausible, targeting the next high. We should enter on confirmation, and place a stop-loss beyond the recent swing level.
❤️Sending you lots of Love and Hugs❤️

SILVER: Target Is Down! Short!
My dear friends,
Today we will analyse SILVER together☺️
The market is at an inflection zone and price has now reached an area around 36.878 where previous reversals or breakouts have occurred.And a price reaction that we are seeing on multiple timeframes here could signal the next move down so we can enter on confirmation, and target the next key level of 36.687..Stop-loss is recommended beyond the inflection zone.
❤️Sending you lots of Love and Hugs❤️

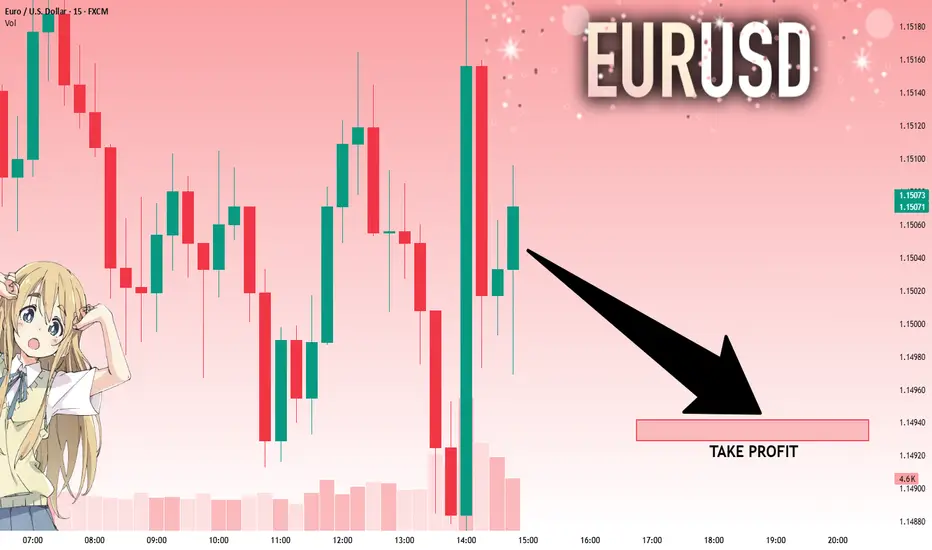
EURUSD: Move Down Expected! Short!
My dear friends,
Today we will analyse EURUSD together☺️
The price is near a wide key level
and the pair is approaching a significant decision level of 1.15043 Therefore, a strong bearish reaction here could determine the next move down.We will watch for a confirmation candle, and then target the next key level of 1.14942..Recommend Stop-loss is beyond the current level.
❤️Sending you lots of Love and Hugs❤️
Bitcoin - Trend Shift Confirmed, Eyes on $102.8K LiquidityMarket Context
Bitcoin showed signs of exhaustion after a strong short-term rally within a clean upward channel on the 1H chart. Price action had been respecting the trend structure until a key deviation occurred near $108,500, where we saw an internal liquidity sweep that hinted at potential distribution.
Fake-Out Confirmation and Shift in Momentum
After taking out local highs around $108.5K, price failed to continue higher and instead reversed sharply, confirming the sweep as a classic fake-out. This kind of internal liquidity grab is typically used to trap breakout buyers before reversing and targeting previous lows.
Break of Structure and Channel Retest
The rising channel was broken convincingly, and price has now retested the underside of the channel, aligning with the 50% equilibrium of the entire high-to-low range. This reinforces the bearish bias and suggests the market has likely shifted from accumulation to distribution.
Downside Targets and Key Levels
Immediate support sits around $104.6K, which served as a consolidation base during the earlier run-up. If this level fails to hold, the next key target would be a sweep of the previous significant low at $102.8K. This area is marked as a point of interest and could offer a reaction or reversal.
Price Expectations and Trade Outlook
As long as price remains below the broken channel and under $107K, the bearish scenario remains in play. I’m watching for bearish continuation into $104.6K first, and a potential full sweep toward $102.8K if that support fails.
Conclusion
The internal sweep followed by impulsive rejection, combined with a clear channel breakdown and retest, shifts the bias to bearish. A move into the $104.6K region seems probable, with a lower liquidity target at $102.8K in sight if downside pressure accelerates.
Disclosure: I am part of Trade Nation's Influencer program and receive a monthly fee for using their TradingView charts in my analysis.
___________________________________
Thanks for your support!
If you found this idea helpful or learned something new, drop a like 👍 and leave a comment, I’d love to hear your thoughts! 🚀

USD_CHF SHORT SIGNAL|
✅USD_CHF made a nice
Rebound from the support
Below just as we predicted in
Our previous analysis but is now
About to retest the horizontal
Resistance of 0.8200 from where
We can go short with the TP
Of 0.8124 and the SL of 0.8207
SHORT🔥
✅Like and subscribe to never miss a new idea!✅
Disclosure: I am part of Trade Nation's Influencer program and receive a monthly fee for using their TradingView charts in my analysis.

EUR-JPY Bullish Continuation! Buy!
Hello,Traders!
EUR-JPY is trading in an
Uptrend and the pair made
A bullish breakout of the key
Horizontal level of 166.162
And the breakout is confirmed
So after the retest of the
New support we will be
Expecting a bullish continuation
Buy!
Comment and subscribe to help us grow!
Check out other forecasts below too!
Disclosure: I am part of Trade Nation's Influencer program and receive a monthly fee for using their TradingView charts in my analysis.

GOLD SUPPORT AHEAD|LONG|
✅GOLD is trading in an uptrend
With the price set to retest
The rising support line
From where I think the growth will continue
LONG🚀
✅Like and subscribe to never miss a new idea!✅
Disclosure: I am part of Trade Nation's Influencer program and receive a monthly fee for using their TradingView charts in my analysis.

USDCAD SHORT IDEA- USDCAD Is EXTREMELY WEAK AND READY FOR SELLOANDA:USDCAD USDCAD Is extremely weak I expect price to drop hard from here.
TRADE BREAKDOWN
Weekly Trend is Bearish.
Daily Trend is Bearish.
4H Trend is also Bearish.
This is 100% a trend following strategy trade.
The entry is taken on 4H time frame targeting the recent weekly swing low.
This is a 4RR Trade.

GBP_JPY RISING SUPPORT|LONG|
✅GBP_JPY is trading along the rising support
And as the pair will soon retest it
I am expecting the price to go up
To retest the supply levels above at 195.733
LONG🚀
✅Like and subscribe to never miss a new idea!✅
Disclosure: I am part of Trade Nation's Influencer program and receive a monthly fee for using their TradingView charts in my analysis.

GBP-CHF Support Ahead! Buy!
Hello,Traders!
GBP-CHF keeps falling but
A strong horizontal support
Level is ahead at 1.0921
From where we will be
Expecting a rebound
And a local bullish move up
Buy!
Comment and subscribe to help us grow!
Check out other forecasts below too!
Disclosure: I am part of Trade Nation's Influencer program and receive a monthly fee for using their TradingView charts in my analysis.

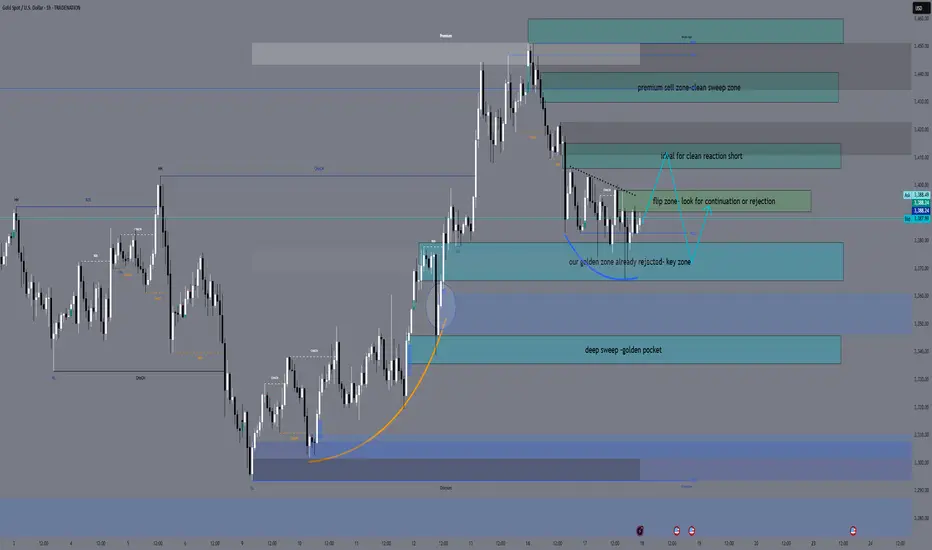
XAUUSD Sniper Plan – June 18, 2025Hey GoldMinds! 💛
After a messy reaction to today's Retail Sales miss, Gold continues to coil inside a premium range. With FOMC projections, rate statement, Powell’s press conference, and Unemployment Claims lined up next — volatility is far from over. Here’s our refined tactical plan 👇
🌍 Macro & Geopolitical Context
• US Retail Sales disappointed — signaling cracks in consumer demand, potentially weighing on the USD.
• Unemployment Claims up next — job market weakness could add pressure on USD if claims increase.
• FOMC day: Expect massive liquidity sweeps during economic projections, rate decision, and Powell’s press conference.
• Geopolitical tensions persist — no ceasefire in Middle East conflicts (Israel–Iran), and Russia–Ukraine remains unstable. Safe haven bids may still support gold on dips.
🧭 Bias: Tactical Neutral → Bearish
• Price remains capped under 3415–3445 supply
• EMAs are showing indecision: H1 trapped between EMA 5–21, H4 leaning weakly bullish
• RSI on most TFs is neutral → market waiting for event catalyst
• Structure suggests bull trap risk if 3415 holds
🔑 Key Sniper Zones
🔻 Sell Zones
1️⃣ 3405 – 3415
→ H1-H4 OB + FVG + sweep confluence
→ Premium liquidity pocket — ideal trap for reactive sellers
→ Watch M15 for rejection confirmation
2️⃣ 3430 – 3445
→ Upper inducement + clean OB + imbalance
→ Only valid if price spikes irrationally post-FOMC
→ Stronger reversal setup likely here
🟡 Pullback Monitor Zone
3390 – 3398
→ No trade zone — watch for signs of rejection or continuation
→ Could act as short-term resistance before deeper moves
🟢 Buy Zones
1️⃣ 3365 – 3380
→ Bounce zone with clean confluence: FVG, OB, previous HL
→ Best used for reactive entries after wick flushes
→ Key pivot zone with HL structure
→ OB + FVG combo, ideal for tactical long bounces with M15/M30 confirmation
2️⃣ 3335 – 3345
→ Deeper structure retracement zone
→ Contains H4 OB, imbalance + golden Fibo pocket
→ Most reactive buy zone post-event volatility
🧠 Battle Plan Recap
• If price fails to break 3415, we prepare for further bearish continuation
• Bounces expected at 3365–3380 — confirmation needed
• Final long setup lives at 3335–3345 — cleanest buy zone if FOMC triggers selloff
• 3390–3398 is not for entries — only reaction monitoring
• FOMC + Claims = high risk day → trade only sniper zones
✨ Final Notes
Volatility creates traps. Structure gives clarity.
We don’t predict — we react to the third move.
👇 Found this valuable? Hit the 🚀, follow for more sniper plans, and comment your bias!
Let’s trade like pros, not guessers — GoldFxMinds 🧠✨
GOLD - Selling opportunity on the horizonLooking at gold.
We have a nice bearish continuation orderflow on the 15min TF.
We have a nice potential inducement level of liquidity that we are more than likely to take before moving lower.
This is a reduced risk entry due to where we are on the higher TF as we are pulling into a potential demand zone on the higher timeframe.
ITS REALLY IMPORTANT to remember where we are in terms of structure and as we well know Gold doesn't tend to fall for to long as it remains bullish the majority of the time. so in regards to the HTF like I mentioned above we are still bullish so we are expecting a reversal for the longer term at some point in the near future so this could be a case of get what we can from the market and then look for our LTF orderflow to switch Bullish before then looking for them long entries

SMC 1-10Let's see if this trade goes well.
Testing the Luxalgo SMC indicator.
We now have the highest and lowest CHoCH for buys.
2 ob for buys.

GBPUSD - Next point of interestAfternoon All,
So our GBPUSD trade from earlier didn't quite go to plan however I knew full well that we were building liquidity to the left on the higher timeframe.
This will be my next point of interest for a potential long.
Lets see how price plays out when we get down there.
DAX: Local Bearish Bias! Short!
My dear friends,
Today we will analyse DAX together☺️
The recent price action suggests a shift in mid-term momentum. A break below the current local range around 23,509.95 will confirm the new direction downwards with the target being the next key level of 23,389.15.and a reconvened placement of a stop-loss beyond the range.
❤️Sending you lots of Love and Hugs❤️

GOLD: Absolute Price Collapse Ahead! Short!
My dear friends,
Today we will analyse GOLD together☺️
The in-trend continuation seems likely as the current long-term trend appears to be strong, and price is holding below a key level of 3,394.60 So a bearish continuation seems plausible, targeting the next low. We should enter on confirmation, and place a stop-loss beyond the recent swing level.
❤️Sending you lots of Love and Hugs❤️

EURUSD: Will Go Up! Long!
My dear friends,
Today we will analyse EURUSD together☺️
The market is at an inflection zone and price has now reached an area around 1.15524 where previous reversals or breakouts have occurred.And a price reaction that we are seeing on multiple timeframes here could signal the next move up so we can enter on confirmation, and target the next key level of 1.15663.Stop-loss is recommended beyond the inflection zone.
❤️Sending you lots of Love and Hugs❤️

SILVER: The Market Is Looking Up! Long!
My dear friends,
Today we will analyse SILVER together☺️
The price is near a wide key level
and the pair is approaching a significant decision level of 36.903 Therefore, a strong bullish reaction here could determine the next move up.We will watch for a confirmation candle, and then target the next key level of 37.240 .Recommend Stop-loss is beyond the current level.
❤️Sending you lots of Love and Hugs❤️

GBPUSD - LongUnfortunately I can't post the idea on the 5min to give you a better idea of where we are at in terms of the entry for this.
However I am looking to be tagged into this trade and have a limit order where I have set it.
Hoping to be tagged in. If we aren't we move on. and if we lose we move on.
If im able to help with any questions you may have do send them my way

GBPUSD - LONG Looking at GBPUSD
We have a great set up occurring on the 5min timeframe for a potential long.
We will see how it plays out and will do an update video on this later.

GBP_CAD RISKY LONG|
✅GBP_CAD is set to retest a
Strong support level below at 1.8380
After trading in a local downtrend for some time
Which makes a bullish rebound a likely scenario
With the target being a local resistance above at 1.8426
LONG🚀
✅Like and subscribe to never miss a new idea!✅
Disclosure: I am part of Trade Nation's Influencer program and receive a monthly fee for using their TradingView charts in my analysis.
