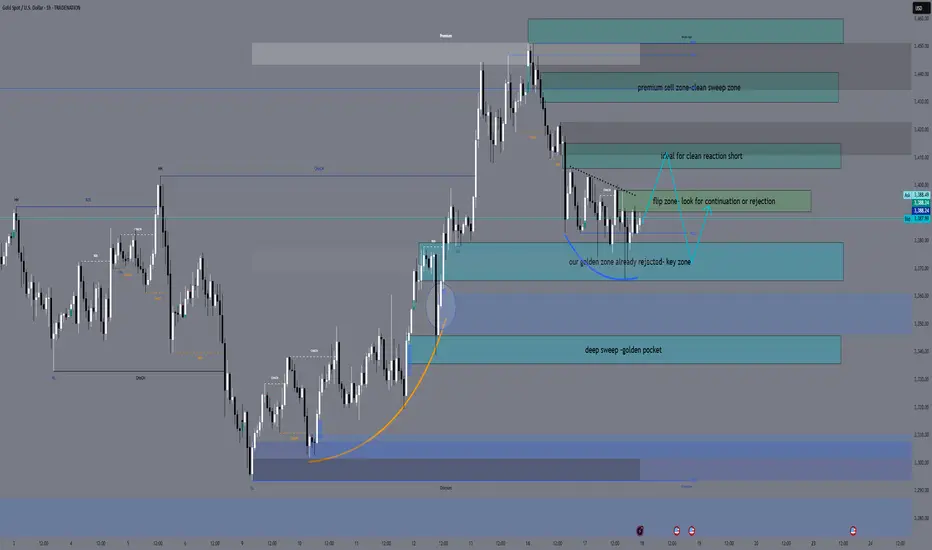
XAUUSD Sniper Plan – June 18, 2025Hey GoldMinds! 💛
After a messy reaction to today's Retail Sales miss, Gold continues to coil inside a premium range. With FOMC projections, rate statement, Powell’s press conference, and Unemployment Claims lined up next — volatility is far from over. Here’s our refined tactical plan 👇
🌍 Macro & Geopolitical Context
• US Retail Sales disappointed — signaling cracks in consumer demand, potentially weighing on the USD.
• Unemployment Claims up next — job market weakness could add pressure on USD if claims increase.
• FOMC day: Expect massive liquidity sweeps during economic projections, rate decision, and Powell’s press conference.
• Geopolitical tensions persist — no ceasefire in Middle East conflicts (Israel–Iran), and Russia–Ukraine remains unstable. Safe haven bids may still support gold on dips.
🧭 Bias: Tactical Neutral → Bearish
• Price remains capped under 3415–3445 supply
• EMAs are showing indecision: H1 trapped between EMA 5–21, H4 leaning weakly bullish
• RSI on most TFs is neutral → market waiting for event catalyst
• Structure suggests bull trap risk if 3415 holds
🔑 Key Sniper Zones
🔻 Sell Zones
1️⃣ 3405 – 3415
→ H1-H4 OB + FVG + sweep confluence
→ Premium liquidity pocket — ideal trap for reactive sellers
→ Watch M15 for rejection confirmation
2️⃣ 3430 – 3445
→ Upper inducement + clean OB + imbalance
→ Only valid if price spikes irrationally post-FOMC
→ Stronger reversal setup likely here
🟡 Pullback Monitor Zone
3390 – 3398
→ No trade zone — watch for signs of rejection or continuation
→ Could act as short-term resistance before deeper moves
🟢 Buy Zones
1️⃣ 3365 – 3380
→ Bounce zone with clean confluence: FVG, OB, previous HL
→ Best used for reactive entries after wick flushes
→ Key pivot zone with HL structure
→ OB + FVG combo, ideal for tactical long bounces with M15/M30 confirmation
2️⃣ 3335 – 3345
→ Deeper structure retracement zone
→ Contains H4 OB, imbalance + golden Fibo pocket
→ Most reactive buy zone post-event volatility
🧠 Battle Plan Recap
• If price fails to break 3415, we prepare for further bearish continuation
• Bounces expected at 3365–3380 — confirmation needed
• Final long setup lives at 3335–3345 — cleanest buy zone if FOMC triggers selloff
• 3390–3398 is not for entries — only reaction monitoring
• FOMC + Claims = high risk day → trade only sniper zones
✨ Final Notes
Volatility creates traps. Structure gives clarity.
We don’t predict — we react to the third move.
👇 Found this valuable? Hit the 🚀, follow for more sniper plans, and comment your bias!
Let’s trade like pros, not guessers — GoldFxMinds 🧠✨
SMC
GOLD - Selling opportunity on the horizonLooking at gold.
We have a nice bearish continuation orderflow on the 15min TF.
We have a nice potential inducement level of liquidity that we are more than likely to take before moving lower.
This is a reduced risk entry due to where we are on the higher TF as we are pulling into a potential demand zone on the higher timeframe.
ITS REALLY IMPORTANT to remember where we are in terms of structure and as we well know Gold doesn't tend to fall for to long as it remains bullish the majority of the time. so in regards to the HTF like I mentioned above we are still bullish so we are expecting a reversal for the longer term at some point in the near future so this could be a case of get what we can from the market and then look for our LTF orderflow to switch Bullish before then looking for them long entries

SMC 1-10Let's see if this trade goes well.
Testing the Luxalgo SMC indicator.
We now have the highest and lowest CHoCH for buys.
2 ob for buys.

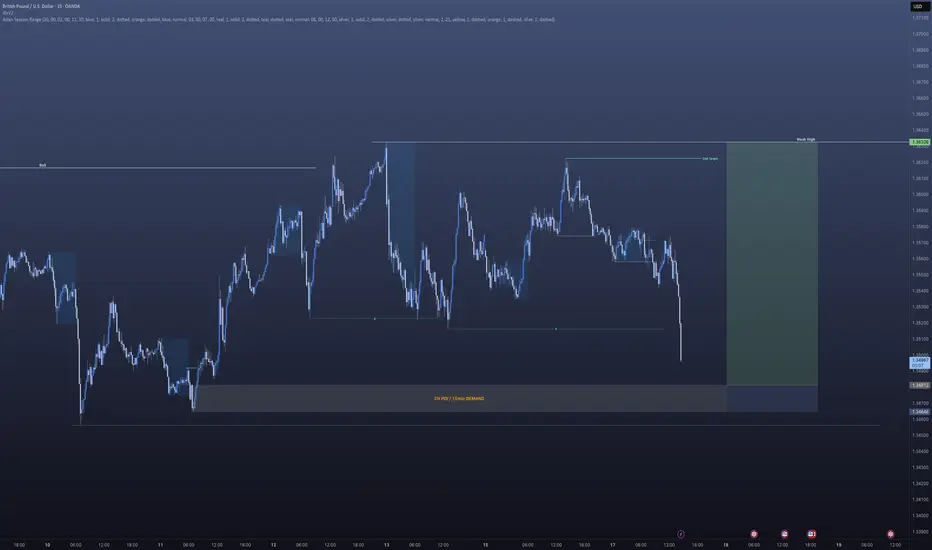
GBPUSD - Next point of interestAfternoon All,
So our GBPUSD trade from earlier didn't quite go to plan however I knew full well that we were building liquidity to the left on the higher timeframe.
This will be my next point of interest for a potential long.
Lets see how price plays out when we get down there.
DAX: Local Bearish Bias! Short!
My dear friends,
Today we will analyse DAX together☺️
The recent price action suggests a shift in mid-term momentum. A break below the current local range around 23,509.95 will confirm the new direction downwards with the target being the next key level of 23,389.15.and a reconvened placement of a stop-loss beyond the range.
❤️Sending you lots of Love and Hugs❤️

GOLD: Absolute Price Collapse Ahead! Short!
My dear friends,
Today we will analyse GOLD together☺️
The in-trend continuation seems likely as the current long-term trend appears to be strong, and price is holding below a key level of 3,394.60 So a bearish continuation seems plausible, targeting the next low. We should enter on confirmation, and place a stop-loss beyond the recent swing level.
❤️Sending you lots of Love and Hugs❤️

EURUSD: Will Go Up! Long!
My dear friends,
Today we will analyse EURUSD together☺️
The market is at an inflection zone and price has now reached an area around 1.15524 where previous reversals or breakouts have occurred.And a price reaction that we are seeing on multiple timeframes here could signal the next move up so we can enter on confirmation, and target the next key level of 1.15663.Stop-loss is recommended beyond the inflection zone.
❤️Sending you lots of Love and Hugs❤️

SILVER: The Market Is Looking Up! Long!
My dear friends,
Today we will analyse SILVER together☺️
The price is near a wide key level
and the pair is approaching a significant decision level of 36.903 Therefore, a strong bullish reaction here could determine the next move up.We will watch for a confirmation candle, and then target the next key level of 37.240 .Recommend Stop-loss is beyond the current level.
❤️Sending you lots of Love and Hugs❤️

GBPUSD - LongUnfortunately I can't post the idea on the 5min to give you a better idea of where we are at in terms of the entry for this.
However I am looking to be tagged into this trade and have a limit order where I have set it.
Hoping to be tagged in. If we aren't we move on. and if we lose we move on.
If im able to help with any questions you may have do send them my way

GBPUSD - LONG Looking at GBPUSD
We have a great set up occurring on the 5min timeframe for a potential long.
We will see how it plays out and will do an update video on this later.

GBP_CAD RISKY LONG|
✅GBP_CAD is set to retest a
Strong support level below at 1.8380
After trading in a local downtrend for some time
Which makes a bullish rebound a likely scenario
With the target being a local resistance above at 1.8426
LONG🚀
✅Like and subscribe to never miss a new idea!✅
Disclosure: I am part of Trade Nation's Influencer program and receive a monthly fee for using their TradingView charts in my analysis.

GBP-NZD Rising Support Ahead! Buy!
Hello,Traders!
GBP-NZD keeps falling
Down but a rising support
Line is ahead and as the
Pair is locally oversold we
Will be expecting a rebound
And a move up after the
Retest of the support below
Sell!
Comment and subscribe to help us grow!
Check out other forecasts below too!
Disclosure: I am part of Trade Nation's Influencer program and receive a monthly fee for using their TradingView charts in my analysis.

USD-CHF Bearish Bias! Sell!
Hello,Traders!
USD-CHF is trading in a
Downtrend and the pair
Is making a local bullish
Pullback but will soon
Hit a horizontal resistance
Level around 0.8185
So we are bearish biased
And we will be expecting
A further bearish move down
Sell!
Comment and subscribe to help us grow!
Check out other forecasts below too!
Disclosure: I am part of Trade Nation's Influencer program and receive a monthly fee for using their TradingView charts in my analysis.

NZDUSD - Trade Re-cap Take a look at the NZDUSD trade re-cap.
Here I explain exactly what I was looking for in getting this 1:10RR trade from start to finish.
Hope this helps

EUR-CHF Resistance Ahead! Sell!
Hello,Traders!
EUR-CHF keeps growing
But a strong horizontal
Resistance of 0.9445
Is ahead so after the
Retest we will be expecting
A local bearish move down
Sell!
Comment and subscribe to help us grow!
Check out other forecasts below too!
Disclosure: I am part of Trade Nation's Influencer program and receive a monthly fee for using their TradingView charts in my analysis.

US30: Strong Growth Ahead! Long!
My dear friends,
Today we will analyse US30 together☺️
The recent price action suggests a shift in mid-term momentum. A break above the current local range around 42,682.9 will confirm the new direction upwards with the target being the next key level of 42,855.1 and a reconvened placement of a stop-loss beyond the range.
❤️Sending you lots of Love and Hugs❤️

SILVER: Will Go Down! Short!
My dear friends,
Today we will analyse SILVER together☺️
The in-trend continuation seems likely as the current long-term trend appears to be strong, and price is holding below a key level of 36.344 So a bearish continuation seems plausible, targeting the next low. We should enter on confirmation, and place a stop-loss beyond the recent swing level.
❤️Sending you lots of Love and Hugs❤️

EURUSD: The Market Is Looking Down! Short!
My dear friends,
Today we will analyse EURUSD together☺️
The market is at an inflection zone and price has now reached an area around 1.16075 where previous reversals or breakouts have occurred.And a price reaction that we are seeing on multiple timeframes here could signal the next move down so we can enter on confirmation, and target the next key level of 1.15775..Stop-loss is recommended beyond the inflection zone.
❤️Sending you lots of Love and Hugs❤️

GOLD: Strong Bullish Sentiment! Long!
My dear friends,
Today we will analyse GOLD together☺️
The price is near a wide key level
and the pair is approaching a significant decision level of 3,393.80 Therefore, a strong bullish reaction here could determine the next move up.We will watch for a confirmation candle, and then target the next key level of 3,414.38.Recommend Stop-loss is beyond the current level.
❤️Sending you lots of Love and Hugs❤️

Positive market: OIL rises sharply - Important area to watch forThe recent escalation of tensions in the Middle East has had a strong ripple effect across all commodities market. Just as we observed with Gold, it’s no surprise we’ve seen oil prices climb as well, given this uncertainty.
If you’ve seen my latest Gold analysis, you’ll understand how market sentiment has turned uneasy, and in times like these are what people trust when everything else feels risky. And naturally, with everything going on, Gold is seeing stronger demand again, and I expect the price to steadily climb and reach new highs because the momentum is unmistakable.
On Friday the 13th, oil prices spiked abruptly before pulling back slightly, showing just how sensitive the market is to potential supply disruptions. What’s fueling this rally is obvious, and it’s the fear around supply from such an important oil-producing area. This creates a great opportunity to take a position.
As you can see in my analysis, the price has recently broken above a key resistance zone and may come back for a retest. If this level holds as support, it would really confirm the bullish bias and make the move towards my anticipated target of 77,50 high probability, towards the next resistance zone level at 77,50 and 79,50.
If the price remains over this support zone, my bullish outlook stays the same. But, if it doesn’t hold above this level we could see a slight pullback before another definitve move up.
In such times, it’s important to watch price action closely especially near key technical levels, and let the market show your next move.

EurUsd Daily Profile and expectation for New YorkMy Monday Protocol normally is to sit on my hands and see how Monday prints and trade from Tuesday onwards. With FOMC coming Wednesday, I'm allowed to deviate from this because Monday can be trending to "get somewhere in a hurry", trap Traders and go the other way during FOMC.
When I now look at the Market I see that London kept Asia Lows in tact and expanded higher leaving Failure Swings. Now consolidating which is normally a continuation signature... But then it should first sweep the consolidation Low and make a Reversal Signature. When we sweep or run the Consolidation High first, then the Long idea is not valid anymore.
Im watching the FVG below and see how we trade there and then decide if a Long is in play... I don't want to lose the Equilibruim Level of London Session otherwise the Failure Swings below the Market are the target.
Bottom Line, no hard Bias because its Monday. Favoring the Bullish side with FOMC on the Agenda this week, but not in a hurry to trade.
Hope you appreciate my content 👍
Happy Hunting, Stay Safe!
Warm Regards,
Mariinus

Bearish Gold ideaThe idea is somehow risky due to geopolitical tensions in the middle east conflict, but it could still play out for short first then bullish to a new all time high.

CAD-CHF Potential Short! Sell!
Hello,Traders!
CAD-CHF made a retest
Of the horizontal resistance
Of 0.5990 and pullback is
Already happening so we are
Locally bearish biased and
We will be expecting a
Further bearish move down
Sell!
Comment and subscribe to help us grow!
Check out other forecasts below too!
Disclosure: I am part of Trade Nation's Influencer program and receive a monthly fee for using their TradingView charts in my analysis.
