EurUsd Daily Profile and expectation for New YorkMy Monday Protocol normally is to sit on my hands and see how Monday prints and trade from Tuesday onwards. With FOMC coming Wednesday, I'm allowed to deviate from this because Monday can be trending to "get somewhere in a hurry", trap Traders and go the other way during FOMC.
When I now look at the Market I see that London kept Asia Lows in tact and expanded higher leaving Failure Swings. Now consolidating which is normally a continuation signature... But then it should first sweep the consolidation Low and make a Reversal Signature. When we sweep or run the Consolidation High first, then the Long idea is not valid anymore.
Im watching the FVG below and see how we trade there and then decide if a Long is in play... I don't want to lose the Equilibruim Level of London Session otherwise the Failure Swings below the Market are the target.
Bottom Line, no hard Bias because its Monday. Favoring the Bullish side with FOMC on the Agenda this week, but not in a hurry to trade.
Hope you appreciate my content 👍
Happy Hunting, Stay Safe!
Warm Regards,
Mariinus
SMC

Bearish Gold ideaThe idea is somehow risky due to geopolitical tensions in the middle east conflict, but it could still play out for short first then bullish to a new all time high.

CAD-CHF Potential Short! Sell!
Hello,Traders!
CAD-CHF made a retest
Of the horizontal resistance
Of 0.5990 and pullback is
Already happening so we are
Locally bearish biased and
We will be expecting a
Further bearish move down
Sell!
Comment and subscribe to help us grow!
Check out other forecasts below too!
Disclosure: I am part of Trade Nation's Influencer program and receive a monthly fee for using their TradingView charts in my analysis.

AUD_JPY MOVE DOWN AHEAD|SHORT|
✅AUD_JPY made a retest of
The strong horizontal resistance of 93.900
Level of 106.083 and as you
Can see the pair is already
Making a local pullback from
The level which sends a clear
Bearish signal to us therefore
We will be expecting a
Further bearish correction
SHORT🔥
✅Like and subscribe to never miss a new idea!✅
Disclosure: I am part of Trade Nation's Influencer program and receive a monthly fee for using their TradingView charts in my analysis.

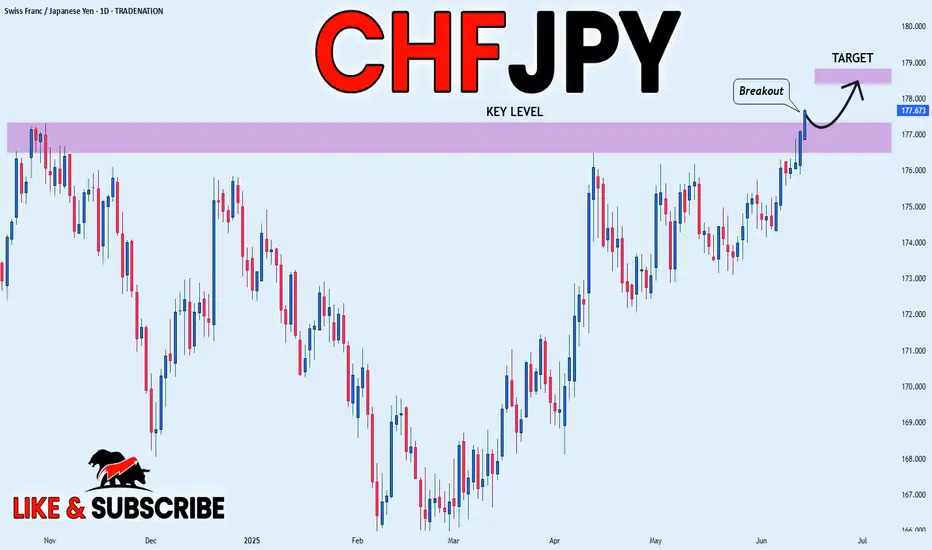
CHF-JPY Will Keep Growing! Buy!
Hello,Traders!
CHF-JPY made a bullish
Breakout of the key horizontal
Level of 177.327 and the
Breakout is confirmed so
We are bullish biased
And we will be expecting
A further bullish continuation
Buy!
Comment and subscribe to help us grow!
Check out other forecasts below too!
Disclosure: I am part of Trade Nation's Influencer program and receive a monthly fee for using their TradingView charts in my analysis.

NZDUSD - LongWhen the market opens and the spreads die down. Will definitely be entering this trade to the upside.
We are still in a HTF bullish orderflow.
This is a great buy set up as we are at a very discounted price.
Lets see how It plays out

Week of 6/15/25: EU AnalysisEU continues to have clean market structure and has all time frames aligned for bullish movement. Looking for price to retrace to the prime 1h POI for an A+ setup.
Major News:
FOMC - Wednesday

Week of 6/15/25: AU AnalysisLast week took the prior week's high and showed large rejection. Expecting this week to take the weak low and liquidity from all the lows to at least the extreme of the daily swing.
Major news:
FOMC - Wednesday

AUD-CHF Pullback Ahead! Sell!
Hello,Traders!
AUD-CHF made a retest
Of the strong wide horizontal
Resistance around 0.5289
And we are already seeing a
Local pullback so we are
Locally bearish biased and
We will be expecting a
Further bearish move down
On Monday
Sell!
Comment and subscribe to help us grow!
Check out other forecasts below too!
Disclosure: I am part of Trade Nation's Influencer program and receive a monthly fee for using their TradingView charts in my analysis.

NZD_CAD REBOUND AHEAD|LONG|
✅NZD_CAD is set to retest a
Strong support level below at 0.8160
After trading in a local downtrend for some time
Which makes a bullish rebound a likely scenario
With the target being a local resistance above at 0.8182
LONG🚀
✅Like and subscribe to never miss a new idea!✅
Disclosure: I am part of Trade Nation's Influencer program and receive a monthly fee for using their TradingView charts in my analysis.

BTCUSD: Bulls Are Winning! Long!
My dear friends,
Today we will analyse BTCUSD together☺️
The recent price action suggests a shift in mid-term momentum. A break above the current local range around 105,670.43 will confirm the new direction upwards with the target being the next key level of 106,057.41 and a reconvened placement of a stop-loss beyond the range.
❤️Sending you lots of Love and Hugs❤️

ETHUSD: Next Move Is Down! Short!
My dear friends,
Today we will analyse ETHUSD together☺️
The market is at an inflection zone and price has now reached an area around 2,545.9 where previous reversals or breakouts have occurred.And a price reaction that we are seeing on multiple timeframes here could signal the next move down so we can enter on confirmation, and target the next key level of 2,529.4..Stop-loss is recommended beyond the inflection zone.
❤️Sending you lots of Love and Hugs❤️

NATGAS Growth Ahead! Buy!
Hello,Traders!
NATGAS made a retest of
The horizontal support level
Of 3.450$ then established
A double bottom pattern
And a we are already
Seeing some rebound so
We are locally bullish biased
And we will be expecting a
Further bullish move up
On Monday
Buy!
Comment and subscribe to help us grow!
Check out other forecasts below too!
Disclosure: I am part of Trade Nation's Influencer program and receive a monthly fee for using their TradingView charts in my analysis.

Bitcoin - Bears vs Bulls: $100k next?Price recently tapped into a well-defined 4H and daily resistance zone and was met with an immediate rejection. That rejection wasn’t just a reaction, it led to a confirmed market structure shift as price broke the previous low. This transition from higher highs to a lower low signals the first sign of bearish control, flipping the short-term bias and setting the tone for a move lower.
Retest of MSS and Inversion Fair Value Gap
After the break in structure, price retraced directly into the origin of the move, retesting the same zone where the shift occurred. A previously bullish 4H gap has now flipped into resistance, rejecting price perfectly. This inversion, where a bullish imbalance turns into a bearish reaction zone, confirms the change in direction and strengthens the downside narrative.
New FVG as Entry Opportunity
The latest bearish impulse created a clean new fair value gap just above current price. A retest of this gap would offer a high-probability continuation setup, as it aligns with both recent structure and order flow. This zone becomes the critical level for bears to defend, and unless price reclaims it, the expectation remains for continuation toward lower liquidity.
Liquidity Outlook and Bearish Target
Below current price, a large pool of liquidity is sitting just above a major psychological round number. That level hasn’t been swept yet and is a likely downside magnet. With no meaningful support between the current FVG and that draw on liquidity, price is likely to reach for it next. This fits the typical sequence following a market structure shift: rejection, shift, retest, continuation, and liquidity sweep.
Momentum and Contextual Confluence
Zooming out slightly, the current move fits within broader bearish momentum that has been developing across timeframes. There’s no sign of strong bullish absorption, and each push higher has been met with efficient selling. This isn’t a chaotic breakdown, but a controlled sequence of lower highs and lower lows, supported by clean structural shifts and consistent rejection zones.
Conclusion
The chart tells a clear story. A clean rejection from a key resistance zone led to a confirmed bearish structure shift, followed by a textbook retest and fresh fair value gap. As long as price remains below that gap, the setup favors continuation lower, with the nearest liquidity pool being the most likely draw. This remains a high-probability bearish scenario until proven otherwise by a shift back above invalidation levels.
___________________________________
Thanks for your support!
If you found this idea helpful or learned something new, drop a like 👍 and leave a comment, I’d love to hear your thoughts! 🚀

TESLA WILL GO DOWN|SHORT|
✅TESLA is going up now
But a strong resistance level is ahead at 336$
Thus I am expecting a pullback
And a move down towards the target of 320$
SHORT🔥
✅Like and subscribe to never miss a new idea!✅
Disclosure: I am part of Trade Nation's Influencer program and receive a monthly fee for using their TradingView charts in my analysis.

CAD_CHF SHORT FROM RESISTANCE|
✅CAD_CHF has retested a key resistance level of 0.5990
And as the pair is already making a bearish pullback
A move down to retest the demand level below at 0.5960 is likely
SHORT🔥
✅Like and subscribe to never miss a new idea!✅
Disclosure: I am part of Trade Nation's Influencer program and receive a monthly fee for using their TradingView charts in my analysis.

NZD-CAD Free Signal! Buy!
Hello,Traders!
NZD-CAD is about to retest
A horizontal support level
Of 0.8161 from where we
Will be expecting a local
Bullish rebound so we can
Enter a long trade with the
Take Profit of 0.8191 and
The Stop Loss of 0.8153
Buy!
Comment and subscribe to help us grow!
Check out other forecasts below too!
Disclosure: I am part of Trade Nation's Influencer program and receive a monthly fee for using their TradingView charts in my analysis.

NG1!: Target Is Down! Short!
My dear friends,
Today we will analyse NG1! together☺️
The price is near a wide key level
and the pair is approaching a significant decision level of 3.602 Therefore, a strong bearish reaction here could determine the next move down.We will watch for a confirmation candle, and then target the next key level of 3.569..Recommend Stop-loss is beyond the current level.
❤️Sending you lots of Love and Hugs❤️

XAUUSD: +1500 TO +2200 PIPS Major Swing Move in Making, Two AreaThe first day of the trading week has seen Gold skyrocket, clearly indicating a bullish price direction. Our recent analyses had clearly shown this, and the volume confirms further bullish momentum. Additionally, the NFP news this Friday will be a trend changer, regardless of its positive or negative impact on the USD.
There are two potential take-profit targets. Before taking entry, please conduct your own analysis.
Good luck and trade safely,
Team Setupsfx_

USOIL: Absolute Price Collapse Ahead! Short!
My dear friends,
Today we will analyse USOIL together☺️
The recent price action suggests a shift in mid-term momentum. A break below the current local range around 73.387 will confirm the new direction downwards with the target being the next key level of 72.481.and a reconvened placement of a stop-loss beyond the range.
❤️Sending you lots of Love and Hugs❤️

NI225: Will Go Up! Long!
My dear friends,
Today we will analyse NI225 together☺️
The in-trend continuation seems likely as the current long-term trend appears to be strong, and price is holding above a key level of 37,817.93 So a bullish continuation seems plausible, targeting the next high. We should enter on confirmation, and place a stop-loss beyond the recent swing level.
❤️Sending you lots of Love and Hugs❤️

AUD_CHF LOCAL SHORT|
✅AUD_CHF has retested a resistance level of 0.5290
And we are seeing a bearish reaction
With the price going down but we need
To wait for a confirmation
Before entering the trade, so that we
Get a higher success probability of the trade
SHORT🔥
✅Like and subscribe to never miss a new idea!✅
Disclosure: I am part of Trade Nation's Influencer program and receive a monthly fee for using their TradingView charts in my analysis.

CHF_JPY BULLISH BREAKOUT|LONG|
✅CHF_JPY is going up
Now and the pair made a bullish
Breakout of the key horizontal
Level of 177.000 and the breakout
Is confirmed so we are bullish
Biased and we will be expecting
A further bullish move up
On Monday
LONG🚀
✅Like and subscribe to never miss a new idea!✅
Disclosure: I am part of Trade Nation's Influencer program and receive a monthly fee for using their TradingView charts in my analysis.