EURUSD: Will Go Up! Long!
My dear friends,
Today we will analyse EURUSD together☺️
The recent price action suggests a shift in mid-term momentum. A break above the current local range around 1.15537 will confirm the new direction upwards with the target being the next key level of 1.15800 and a reconvened placement of a stop-loss beyond the range.
❤️Sending you lots of Love and Hugs❤️
SMC

SILVER: The Market Is Looking Down! Short!
My dear friends,
Today we will analyse SILVER together☺️
The in-trend continuation seems likely as the current long-term trend appears to be strong, and price is holding below a key level of 36.303 So a bearish continuation seems plausible, targeting the next low. We should enter on confirmation, and place a stop-loss beyond the recent swing level.
❤️Sending you lots of Love and Hugs❤️

GBP_JPY LOCAL SHORT|
✅GBP_JPY has been growing recently
And the pair seems locally overbought
So as the pair is approaching a horizontal resistance of 196.400
Price decline is to be expected
SHORT🔥
✅Like and subscribe to never miss a new idea!✅
Disclosure: I am part of Trade Nation's Influencer program and receive a monthly fee for using their TradingView charts in my analysis.

GBP_CHF RESISTANCE AHEAD|SHORT|
✅GBP_CHF is going up now
But a strong resistance level is ahead at 1.1070
Thus I am expecting a pullback
And a move down towards the target of 1.1013
SHORT🔥
✅Like and subscribe to never miss a new idea!✅
Disclosure: I am part of Trade Nation's Influencer program and receive a monthly fee for using their TradingView charts in my analysis.

EUR-CAD An Interesting Setup! Buy!
Hello,Traders!
EUR-CAD is trading in an
Uptrend along the rising
Support which now
Confluences with the falling
Support line as well so as the
Pair was making a bearish
Correction we will be expecting
A bullish rebound from the
Confluence area and a further
Bullish move up
Sell!
Comment and subscribe to help us grow!
Check out other forecasts below too!
Disclosure: I am part of Trade Nation's Influencer program and receive a monthly fee for using their TradingView charts in my analysis.

EUR-NZD Potential Short! Sell!
Hello,Traders!
EUR-NZD is going up
Just as we predicted but
The pair will soon hit a
Horizontal resistance
Of 1.9287 from where
We will be expecting a
Local pullback and a
Move down
Sell!
Comment and subscribe to help us grow!
Check out other forecasts below too!
Disclosure: I am part of Trade Nation's Influencer program and receive a monthly fee for using their TradingView charts in my analysis.

EURUSD - Long from hereDue to having internal Breaks of Structure to the upside here I have entered a long position as it is a reasonable area to potentially get long as it is a strong area of demand.
I'm aware that there isn't much liquidity built up in and around this area before hitting the demand but its a risk im willing to take as price may just be filling the FVG from all the buying pressure that was in the market yesterday
Any questions please message

EURUSD - Current long positionVideo analysis of EURUSD
Hopefully we will get some bullish momentum however its not looking great

EUR/USD - Daily highs taken, now what?Introduction
The EUR/USD made a strong move higher today, establishing a clear uptrend on the 4-hour chart. With this latest push, it swept the daily liquidity above the previous high. The question now is whether the EUR/USD will continue moving higher or if there are opportunities for long entries at lower levels.
Liquidity Sweep
EUR/USD has taken out liquidity above the daily highs, where many stop losses are typically positioned. These stops have now been removed from the market. This area could potentially act as a support and resistance flip. However, if we see a 4-hour candle close below the previous daily high, further downside becomes likely.
Where Can We Look for Buys?
During the recent 4-hour move higher, significant progress was made. This upward movement created a daily Fair Value Gap (FVG) between $1.149 and $1.145. This FVG aligns perfectly with the golden pocket Fibonacci level, drawn from the swing low to the swing high. As a result, this zone forms a strong area of confluence for potential buy positions to target a retest of the highs.
Conclusion
Although we are currently breaking above the previous high, this move has yet to be confirmed as sustainable. Holding above this level is crucial. If a 4-hour candle closes below the previous high, it becomes likely that we will revisit the daily FVG and golden pocket Fibonacci zone.
Disclosure: I am part of Trade Nation's Influencer program and receive a monthly fee for using their TradingView charts in my analysis.
Thanks for your support.
- Make sure to follow me so you don't miss out on the next analysis!
- Drop a like and leave a comment!

TESLA Will Fall! Sell!
Hello,Traders!
TESLA went up from the
Horizontal support but has
Hit a horizontal resistance
Of 335$ and we are already
Seeing a bearish pullback
So we will be expecting
A further local move down today
Sell!
Comment and subscribe to help us grow!
Check out other forecasts below too!
Disclosure: I am part of Trade Nation's Influencer program and receive a monthly fee for using their TradingView charts in my analysis.

CAD_CHF STRONG SUPPORT AHEAD|LONG|
✅CAD_CHF will be retesting a support
Level soon around 0.5920
From where I am expecting a bullish reaction
With the price going up but we need
To wait for a reversal pattern to form
Before entering the trade, so that we
Get a higher success probability of the trade
LONG🚀
✅Like and subscribe to never miss a new idea!✅
Disclosure: I am part of Trade Nation's Influencer program and receive a monthly fee for using their TradingView charts in my analysis.

EURUSD, GBPUSD & EURGBP analysisHere's my outlook on the 3 pairs mentioned in the title. Looking for more upside momentum after we have some sort of pullback into the premium discount prices.
Once we get some15min bearish internal orderflow on the lower Time Frames I will look to enter short term sell positions before looking to take longer term buys on the way back up.
Again, if I can be of any assistance please do let me know and I will be happy to help where I can.

AUD-CHF Free Signal! Buy!
Hello,Traders!
AUD-CHF fell down sharply
But the pair will soon hit a
Horizontal support level
Of 0.5281 from where we
Can go long with the
Take Profit of 0.5312
And the Stop Loss of 0.5273
Buy!
Comment and subscribe to help us grow!
Check out other forecasts below too!
Disclosure: I am part of Trade Nation's Influencer program and receive a monthly fee for using their TradingView charts in my analysis.

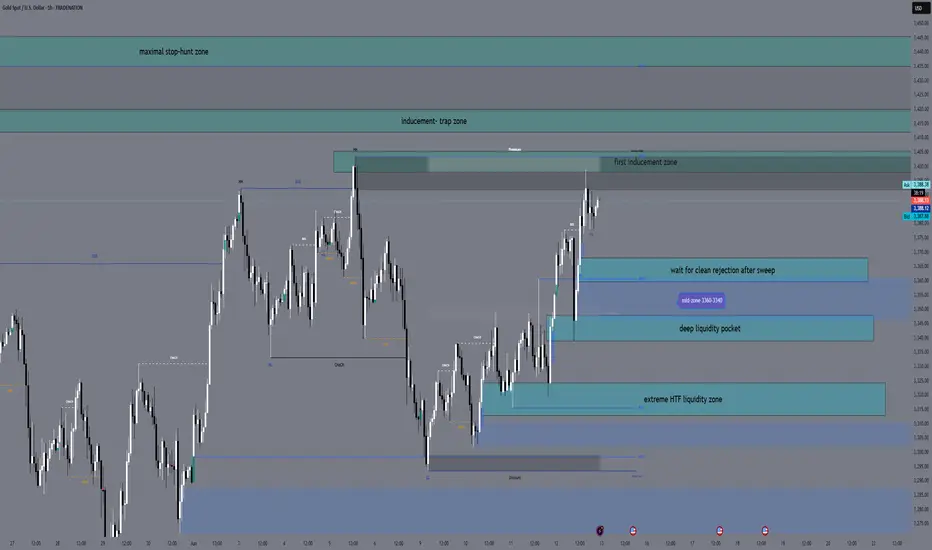
XAUUSD Daily Plan — June 13, 2025 By GoldFxMinds👋 Hello traders, and welcome to your full preparation for tomorrow’s gold session.
Gold continues to respect its structural map while liquidity traps remain active on both sides of the range. We’ve seen clean sweeps and fast reactions this week, but tomorrow brings a new catalyst: key U.S. data combined with fresh geopolitical tensions that may fuel additional volatility before the weekly close.
🌐 MACRO & GEOPOLITICAL OUTLOOK:
📊 Prelim UoM Consumer Sentiment & Inflation Expectations are scheduled tomorrow:
Consumer Sentiment ➔ 52.2
Inflation Expectations ➔ 6.6%
These data points often trigger sharp USD moves and liquidity grabs.
🌍 Geopolitical tension has increased as President Trump authorized the evacuation of U.S. personnel from several Middle East locations due to rising threats in the region, particularly concerning the Iran nuclear situation.
This development triggered sharp moves across commodities, with oil rallying strongly.
Gold remains well-supported in this environment as global risk sentiment deteriorates.
Traders should expect elevated intraday volatility and potential liquidity sweeps on both sides as markets digest these developments.
🔎 The combination of macro data and geopolitical risk creates highly reactive conditions where liquidity hunts may precede any clear directional moves.
🔎 STRUCTURE OVERVIEW:
Price remains inside premium territory after recent bullish expansions.
Liquidity has already been taken above and below earlier this week, but additional traps may unfold before Friday’s close.
Larger structure remains bullish while short-term supply zones may attract quick inducements.
Tomorrow's flow will likely begin with manipulation during or after news, before real momentum develops.
🎯 BIAS
Main bias: Controlled bullish, but highly reactive inside premium.
As long as price holds above 3340, bulls remain in control on higher timeframe.
However, premium zones above 3395 may act as liquidity traps, inviting fast selloffs after inducements.
Best opportunities likely to come from either:
Controlled retracement into buy zones for continuation higher.
Fast spikes into premium traps for short-term sell opportunities.
Patience will be critical as both news and geopolitical headlines may trigger manipulations before real trend unfolds.
🔑 KEY ZONES TO WATCH:
BUY ZONES
🔵 3368 - 3360
Intraday pullback zone.
Look for minor liquidity dips followed by bullish rejection.
Targets: 3390 → 3405.
🔵 3348 - 3340
Deeper liquidity pocket into H4 imbalance and OB.
Engage only after strong downside sweep with sharp bullish reaction.
Targets: 3380 → 3396.
🔵 3325 - 3312
Extreme HTF liquidity zone.
Valid only if aggressive liquidation occurs into deeper discount.
Targets: 3360 → 3380.
SELL ZONES
🔴 3398 - 3405
First premium inducement area.
Look for fast spikes with M15 bearish rejection candles.
Targets: 3370 → 3348.
🔴 3412 - 3420
Secondary premium trap zone.
Valid only after upside wick rejection.
Targets: 3385 → 3355.
🔴 3435 - 3445
Maximum stop-hunt exhaustion zone.
Only valid if price aggressively squeezes into final liquidity.
Targets: 3390 → 3360.
⚠ TRADING REMINDER:
Friday’s session will likely be driven by both news and geopolitical headlines. Let liquidity play out inside the zones, wait for clear rejection signals, and execute with full confirmation. No chasing — sniper discipline only. 🎯
💎 Hit that 🚀 if you found this plan helpful.
👉 Feel free to follow for daily gold plans and share your thoughts in the comments.
We remain disciplined. We trade structure.
🌙 Rest well tonight — tomorrow we execute with precision and control.
— GoldFxMinds
NZD_JPY WILL KEEP GROWING|LONG|
✅NZD_JPY is trading along
The rising support line
And as the pair is going up now
After the retest of the line
I am expecting the price to keep growing
To retest the supply levels above at 87.429
LONG🚀
✅Like and subscribe to never miss a new idea!✅
Disclosure: I am part of Trade Nation's Influencer program and receive a monthly fee for using their TradingView charts in my analysis.

US100 - Riding the Ascending Channel Towards $22800NASDAQ is showing a very clear and well-respected ascending channel, with price moving steadily within its bounds. Each pullback has been relatively shallow, and buyers continue to step in near the midline or lower boundary of the channel. This is classic trending behavior, with bullish structure intact and momentum favoring continuation higher.
Break and Flip of Resistance into Support
A key resistance level has just been broken, and more importantly, it has now flipped into support. Price retested this zone cleanly after the breakout, confirming the shift in order flow and adding confidence to the current leg up. This kind of structure shift is significant, especially when paired with a strong trending environment like this one.
Daily Resistance Ahead
Looking ahead, there’s a major daily resistance level just above. This area has acted as a reaction zone in the past and will likely bring some short-term volatility or hesitation. However, in the context of the current trend, that resistance could be used as fuel for the next breakout. If price manages to pierce through it with strength and hold above, it would open the path for a move toward the upper boundary of the channel.
Plan and Expectation
The ideal scenario now is simple: I want to see a clean break above the daily resistance, followed by a retest and confirmation of support. That would set up a strong continuation move targeting the top of the channel. If the resistance holds, I’ll wait for signs of weakness or range formation, but as long as we remain inside this rising structure, the bias remains bullish.
Disclosure: I am part of Trade Nation's Influencer program and receive a monthly fee for using their TradingView charts in my analysis.
___________________________________
Thanks for your support!
If you found this idea helpful or learned something new, drop a like 👍 and leave a comment, I’d love to hear your thoughts! 🚀

GBPUSD - Long after a structural shiftBased off of yesterdays analysis.
We can see we are fast approaching a very nice POI.
Will post below my mark up chart from yesterday so you can see below. Will now be sending most of my day on the 15min TF waiting for our structural shift to the upside.
Let's see how price plays out today.
Don't just dive into the trade. Wait for your structural shift first.
If I can offer any help please do let me know

SPY SHORT FROM RESISTANCE|
✅SPY went up to retest
A horizontal resistance of 610$
Which is also an All-Time-High
So its a very strong level
Which makes me locally bearish biased
And I think that we will see a pullback
And a move down from the level
Towards the target below at 596.43$
SHORT🔥
✅Like and subscribe to never miss a new idea!✅
Disclosure: I am part of Trade Nation's Influencer program and receive a monthly fee for using their TradingView charts in my analysis.

GBP-NZD Resistance Ahead! Sell!
Hello,Traders!
GBP-NZD keeps growing
But the pair will soon hit
A horizontal resistance
Level above at 2.2540
So after the retest we
Will be expecting a
Local bearish pullback
Sell!
Comment and subscribe to help us grow!
Check out other forecasts below too!
Disclosure: I am part of Trade Nation's Influencer program and receive a monthly fee for using their TradingView charts in my analysis.

GBPUSD - Long at some pointVery similar with what we are looking for in relation to EURUSD
Will wait for a mitigation of the demand at lower price. Will wait for an internal structure break before looking to get long.
Will have a nice sleep now and will re-evaluate in the morning.
Caught 2 lovely trades on this today and hopefully I may be able to catch 1 or 2 more before the week is out.
Again, if you have any questions don't be shy to get in touch

EURUSD - Mark up for the rest of the weekAfter the CPI data was released today we had a lovely upside move. The move has caused us to trade into the previous weak higher timeframe high which I am hoping we can break and close above before the day is out.
I am now focusing on what kind of pullback we may get into out POI's. Because there is no buy side liquidity on the first POI I will need to see a structural shift on the 15min TF to confirm that internal structure swing to move back towards the upside.
If the 1st POI fails to hold I will be more aggressive with my secondary POI as that will be the premium discount price in order for us to move higher.
If that POI fails and we break the 4H structure swing then this could signal we are about to move lower.
If I can be of any assistance to anyone don't be shy to give me a message

EUR-JPY Pullback Ahead! Sell!
Hello,Traders!
EUR-JPY keeps growing
Just as I predicted in my
Previous analysis and the
Pair is locally overbought
So after the pair hits the
Horizontal resistance above
At 166.715 we will be
Expecting a local pullback
And a bearish correction
Sell!
Comment and subscribe to help us grow!
Check out other forecasts below too!
Disclosure: I am part of Trade Nation's Influencer program and receive a monthly fee for using their TradingView charts in my analysis.

DAX: Move Up Expected! Long!
My dear friends,
Today we will analyse DAX together☺️
The market is at an inflection zone and price has now reached an area around 23.976.69 where previous reversals or breakouts have occurred.And a price reaction that we are seeing on multiple timeframes here could signal the next move up so we can enter on confirmation, and target the next key level of 24.050.29. Stop-loss is recommended beyond the inflection zone.
❤️Sending you lots of Love and Hugs❤️
