EURUSD - Mark up for the rest of the weekAfter the CPI data was released today we had a lovely upside move. The move has caused us to trade into the previous weak higher timeframe high which I am hoping we can break and close above before the day is out.
I am now focusing on what kind of pullback we may get into out POI's. Because there is no buy side liquidity on the first POI I will need to see a structural shift on the 15min TF to confirm that internal structure swing to move back towards the upside.
If the 1st POI fails to hold I will be more aggressive with my secondary POI as that will be the premium discount price in order for us to move higher.
If that POI fails and we break the 4H structure swing then this could signal we are about to move lower.
If I can be of any assistance to anyone don't be shy to give me a message
SMC

EUR-JPY Pullback Ahead! Sell!
Hello,Traders!
EUR-JPY keeps growing
Just as I predicted in my
Previous analysis and the
Pair is locally overbought
So after the pair hits the
Horizontal resistance above
At 166.715 we will be
Expecting a local pullback
And a bearish correction
Sell!
Comment and subscribe to help us grow!
Check out other forecasts below too!
Disclosure: I am part of Trade Nation's Influencer program and receive a monthly fee for using their TradingView charts in my analysis.

DAX: Move Up Expected! Long!
My dear friends,
Today we will analyse DAX together☺️
The market is at an inflection zone and price has now reached an area around 23.976.69 where previous reversals or breakouts have occurred.And a price reaction that we are seeing on multiple timeframes here could signal the next move up so we can enter on confirmation, and target the next key level of 24.050.29. Stop-loss is recommended beyond the inflection zone.
❤️Sending you lots of Love and Hugs❤️

GOLD: Local Bearish Bias! Short!
My dear friends,
Today we will analyse GOLD together☺️
The price is near a wide key level
and the pair is approaching a significant decision level of 3,339.09 Therefore, a strong bearish reaction here could determine the next move down.We will watch for a confirmation candle, and then target the next key level of 3,331.49..Recommend Stop-loss is beyond the current level.
❤️Sending you lots of Love and Hugs❤️

SILVER: Absolute Price Collapse Ahead! Short!
My dear friends,
Today we will analyse SILVER together☺️
The recent price action suggests a shift in mid-term momentum. A break below the current local range around 36.310 will confirm the new direction downwards with the target being the next key level of 36.139.and a reconvened placement of a stop-loss beyond the range.
❤️Sending you lots of Love and Hugs❤️

EURUSD - Waiting for the Breakdown After 4H SweepEURUSD has just completed a sweep of the 4H highs, tagging liquidity resting above the consolidation range. That move looks like a classic inducement, with price now reacting lower and showing signs of weakness. This type of sweep, especially when it happens inside a range, often leads to a reversal back through the range, provided the internal low breaks cleanly. Right now, price is still hovering above that key point, but we can see signs of slowing momentum already.
Liquidity Context and Sweep Logic
This recent push above the highs fits well within ICT-style logic: a sweep of internal range liquidity that serves to fuel the opposite move. The chart shows a textbook example of a consolidation phase being manipulated to the upside first, where buy stops get triggered and liquidity is taken. The real move tends to unfold after that, once we get confirmation through structure breaks and displacement to the downside.
Structure Break and Bearish Confirmation
The internal low within the range is acting as a key trigger level. A clean break below that would serve as confirmation of a bearish market structure shift. That’s the point where the market goes from internal liquidity hunt to actual displacement. If that low gives way, the probability of continuation lower increases significantly, and that’s where I’ll be expecting price to seek the next pocket of liquidity.
Support and Key Area of Interest
There’s also a well-respected support level not too far below, one that price has bounced from several times. That area could either act as a temporary reaction zone or, if broken impulsively, could open the path toward deeper inefficiencies. Ideally, I want to see price break below both the internal low and this support area, then continue toward my next level of interest where I expect either a reaction or a higher probability setup to form.
Conclusion
For now, this setup is a waiting game. The liquidity has been swept on the upside, and now it’s all about whether the structure confirms to the downside. I’m not interested in chasing the first move. What I want to see is displacement below the internal low and support level, followed by continuation or a clean reaction from the next zone of interest.
Disclosure: I am part of Trade Nation's Influencer program and receive a monthly fee for using their TradingView charts in my analysis.
___________________________________
Thanks for your support!
If you found this idea helpful or learned something new, drop a like 👍 and leave a comment, I’d love to hear your thoughts! 🚀

EURUSD: Will Go Up! Long!
My dear friends,
Today we will analyse EURUSD together☺️
The in-trend continuation seems likely as the current long-term trend appears to be strong, and price is holding above a key level of 1.14821 So a bullish continuation seems plausible, targeting the next high. We should enter on confirmation, and place a stop-loss beyond the recent swing level.
❤️Sending you lots of Love and Hugs❤️

DXY Monthly Analysis | Smart Money Concept + CHoCH BreakdownPair: US Dollar Index (DXY)
Timeframe: 1M (Monthly)
Strategy: Smart Money Concept (SMC) + Market Structure + Demand/Supply Zones
Bias: Bearish (Mid to Long-Term)
Breakdown:
Price reacted strongly from the monthly supply zone (110–104), showing signs of exhaustion.
Clear CHoCH (Change of Character) visible at the top structure, confirming loss of bullish intent.
Internal structure printed a liquidity sweep + FVG (Fair Value Gap) ➝ BOS ➝ lower low.
Current PA (price action) is targeting the first demand zone near 92–94, but major interest lies at the macro demand zone (85.100–84.900).
This level aligns with unmitigated historical demand and potential long-term accumulation range.
---
📅 Projection:
Expecting a continuation to the downside after retesting minor imbalance zones.
Potential multi-year bearish leg forming Wave 3 (macro view).
Ideal accumulation/buy zone: 85.100–84.900 – if structure supports.
---
📌 Key Levels to Watch:
Supply Zone: 110.800 – 104.600
CHoCH Level: ~102.300
Short-Term Demand: 92.000 – 94.000
Long-Term Demand (Institutional Interest): 85.100 – 84.900
---
💡 Conclusion: Smart Money has exited from premium pricing, and the macro structure aligns with a bearish transition. As long as price respects current lower highs, we may see a deeper correction or possible trend reversal near 85 levels.
---
🧠 #DXY #SmartMoney #CHoCH #ForexAnalysis #SupplyAndDemand #PriceAction #Forex #Month

GBPUSD - LongI missed the opportunity yesterday.
However, I've been lucky enough to get involved again as of this morning.
4H orderflow is still bullish so we will still look for the longs until the market tells us otherwise.
If I can help with anything do let me know

NZD_CHF BEARISH BIAS|SHORT|
✅NZD_CHF has retested a key resistance level of 0.5000
And as the pair is already making a bearish pullback
A move down to retest the demand level below at 0.4941 is likely
SHORT🔥
✅Like and subscribe to never miss a new idea!✅
Disclosure: I am part of Trade Nation's Influencer program and receive a monthly fee for using their TradingView charts in my analysis.

GBP-USD Bearish Breakout! Sell!
Hello,Traders!
GBP-USD made a bearish
Breakout of the rising support
Which is a resistance now and
The breakout is confirmed
So we are bearish biased
And we will be expecting
A further bearish move down
Sell!
Comment and subscribe to help us grow!
Check out other forecasts below too!
Disclosure: I am part of Trade Nation's Influencer program and receive a monthly fee for using their TradingView charts in my analysis.

US30: The Market Is Looking Down! Short!
My dear friends,
Today we will analyse US30 together☺️
The market is at an inflection zone and price has now reached an area around 42,877.4 where previous reversals or breakouts have occurred.And a price reaction that we are seeing on multiple timeframes here could signal the next move down so we can enter on confirmation, and target the next key level of 42,798.2..Stop-loss is recommended beyond the inflection zone.
❤️Sending you lots of Love and Hugs❤️

SILVER: Strong Bullish Sentiment! Long!
My dear friends,
Today we will analyse SILVER together☺️
The price is near a wide key level
and the pair is approaching a significant decision level of 36.496 Therefore, a strong bullish reaction here could determine the next move up.We will watch for a confirmation candle, and then target the next key level of 36.646.Recommend Stop-loss is beyond the current level.
❤️Sending you lots of Love and Hugs❤️

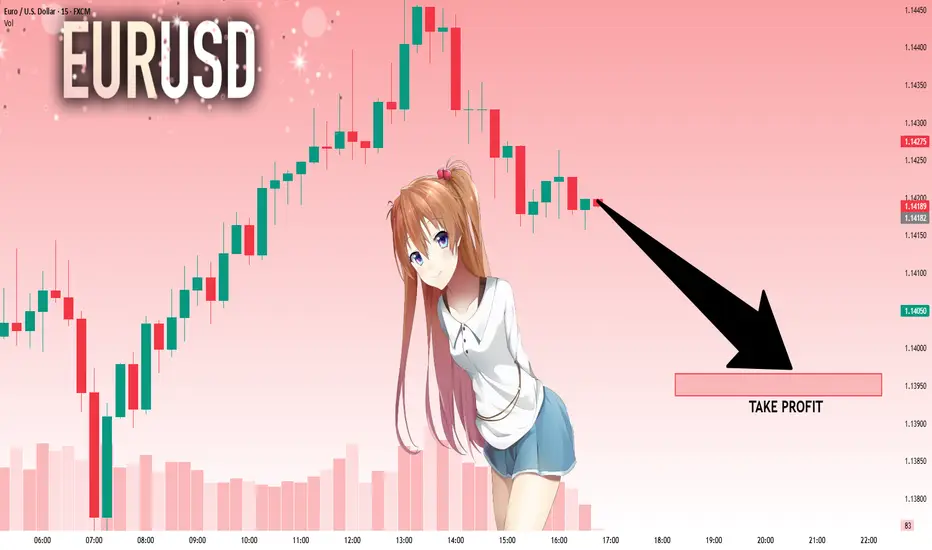
EURUSD: Bears Are Winning! Short!
My dear friends,
Today we will analyse EURUSD together☺️
The recent price action suggests a shift in mid-term momentum. A break below the current local range around 1.14198 will confirm the new direction downwards with the target being the next key level of 1.13966.and a reconvened placement of a stop-loss beyond the range.
❤️Sending you lots of Love and Hugs❤️
GOLD: Next Move Is Up! Long!
My dear friends,
Today we will analyse GOLD together☺️
The in-trend continuation seems likely as the current long-term trend appears to be strong, and price is holding above a key level of 3,322.70 So a bullish continuation seems plausible, targeting the next high. We should enter on confirmation, and place a stop-loss beyond the recent swing level.
❤️Sending you lots of Love and Hugs❤️

EUR-JPY Bullish Breakout! Buy!
Hello,Traders!
EUR-JPY is trading in an
Uptrend an the pair made a
Bullish breakout of the key
Horizontal level of 165.000
Which is confirmed so after
A a potential pullback we will
Be expecting a further
Bullish continuation
Buy!
Comment and subscribe to help us grow!
Check out other forecasts below too!
Disclosure: I am part of Trade Nation's Influencer program and receive a monthly fee for using their TradingView charts in my analysis.

Bitcoin - Bulls in Control: Aiming For $110kBitcoin has just confirmed a strong bullish breakout after consolidating beneath a prior fair value gap. The market not only broke out of that zone cleanly but did so with conviction, creating a new inversion fair value gap (IFVG) along the way. This type of structure often indicates a shift in sentiment, especially when paired with increasing volume and impulsive candles.
Fair Value Gap Break and Continuation Context
Following the breakout, price surged straight through another 4H FVG overhead, flipping it with strength and no hesitation. That kind of move shows clear intent. The market didn't pause or stall at resistance, which increases the probability that the same pattern could play out again, clean break, shallow pullback, and continuation. The breakout level now holds as short-term support.
Near-Term Expectations – FVG Fill Before Higher
With this latest 4H candle close, I’m now expecting a short pullback to fill the newly created 4H FVG below. This would provide the market with the fuel it needs to continue higher without leaving inefficient price action behind. The structure is setting up a classic breakout-fill-continue sequence, and the next key objective sits just below a clear resistance zone overhead.
Conclusion
Bitcoin broke out of a compression zone, formed an IFVG, and followed up with a strong push through the next fair value gap. I’m expecting a controlled retracement to fill the new 4H imbalance, after which price could continue pushing toward the major resistance area. The momentum is clean and structured—until that changes, continuation remains the more likely path.
___________________________________
Thanks for your support!
If you found this idea helpful or learned something new, drop a like 👍 and leave a comment, I’d love to hear your thoughts! 🚀

eurusd 1:35 short todayshorty entry today june10.
short swing trade
expect the entry above the noted highs

BITCOIN LOCALLY OVERBOUGHT|SHORT|
✅BITCOIN will soon retest a
Key resistance level of 112,000$
Which is an all-time-high
And the coin is locally overbought
So I think that the price will make a pullback
And go down to retest the demand level below at 109,000$
SHORT🔥
✅Like and subscribe to never miss a new idea!✅
Disclosure: I am part of Trade Nation's Influencer program and receive a monthly fee for using their TradingView charts in my analysis.

GBP-CHF Wait For Breakout! Buy!
Hello,Traders!
GBP-CHF formed a bullish
Triangle pattern so we are
Locally bullish biased and
IF we see a bullish breakout
Our bullish bias will be
Confirmed and we will be
Expecting a further
Bullish continuation
Buy!
Comment and subscribe to help us grow!
Check out other forecasts below too!
Disclosure: I am part of Trade Nation's Influencer program and receive a monthly fee for using their TradingView charts in my analysis.

GBPUSD - Long on fullfillment Looking at GBPUSD
The order flow on the 4HR and 15min are still bullish.
Looking for that upside momentum until we take out a 4HR level of demand.
So until the buyers have had enough and the sellers take over. Lets see what we get overnight.
Will leave a pending order on this until the London open and then re-assess in the morning
If you have any questions don't be shy

EUR-AUD Potential Long! Buy!
Hello,Traders!
EUR-AUD made a retest
Of the horizontal support
Around 1.7480 and we are
Already seeing a bullish rebound
So a further move up
Is to be expected
Buy!
Comment and subscribe to help us grow!
Check out other forecasts below too!
Disclosure: I am part of Trade Nation's Influencer program and receive a monthly fee for using their TradingView charts in my analysis.

EUR_NZD WILL GO UP|LONG|
✅EUR_NZD fell down sharply
But a strong support level was hit at 1.8820
Thus as a rebound is already happening
A move up towards the target of 1.8923 shall follow
LONG🚀
✅Like and subscribe to never miss a new idea!✅
Disclosure: I am part of Trade Nation's Influencer program and receive a monthly fee for using their TradingView charts in my analysis.
