NG1!: Bears Are Winning! Short!
My dear friends,
Today we will analyse NG1! together☺️
The in-trend continuation seems likely as the current long-term trend appears to be strong, and price is holding below a key level of 3.775 So a bearish continuation seems plausible, targeting the next low. We should enter on confirmation, and place a stop-loss beyond the recent swing level.
❤️Sending you lots of Love and Hugs❤️
SMC

NI225: Next Move Is Up! Long!
My dear friends,
Today we will analyse NI225 together☺️
The market is at an inflection zone and price has now reached an area around 37,698.86 where previous reversals or breakouts have occurred.And a price reaction that we are seeing on multiple timeframes here could signal the next move up so we can enter on confirmation, and target the next key level of 37,589.11.Stop-loss is recommended beyond the inflection zone.
❤️Sending you lots of Love and Hugs❤️

Building Liquidity: What It Really Means🔵 Building Liquidity: What it really means
Professional traders often need liquidity (buyers and sellers) to enter/exit large positions without moving the market too much.
This means manipulating the market within a pre-determined range, which serves as the operating center for everything that follows.
🔹 How is liquidity built
Price Ranging: Sideways consolidation before big moves attracts both buyers and sellers.
False Breakouts (Stop hunts): Price may briefly break support/resistance to trigger retail stop-losses and fill institutional orders.
News Timing: Pro traders often execute during or just before major news when volatility brings liquidity.
🔹 How can you spot a Liquidity-building zone
🔸 Volume
Unusual spikes in volume: Often indicate institutional activity.
Volume clusters at ranges or breakouts: Suggest accumulation/distribution zones.
Volume with price divergence: Price rises but volume falls = possible exhaustion. Volume rises and price consolidates = potential accumulation.
🔸 Price Action
Order Blocks / Imbalance zones: Sharp moves followed by consolidations are often pro trader footprints.
Break of Structure (BoS): Institutions often reverse trends by breaking previous highs/lows.
Liquidity sweeps: Price moves aggressively above resistance or below support then reverses = stop-loss hunting.
🔸 News Reaction
Watch pre-news volume spikes.
Look for contrarian moves after news — when price moves opposite to expected direction, it often reveals smart money traps.
Analyze price stability post-news — slow movement shows absorption by pros.
Wick traps and reversals around news events = stop hunting.
🔸 Narrative is Everything
Higher timeframe trends show intent.
Lower timeframes show execution zones.
Look for alignment between timeframes in a specific direction.
🔹 Why do whales move the market in an orderly manner
To fill large positions at optimal prices.
To create liquidity where there is none.
To trap retail on the wrong side of the move.
To trap other whales on the wrong side of this move.
To rebalance portfolios around economic cycles/news.
🔹 Professionals never forget what they've built
When you track price, volume, and news, you’ll find specific bars that form areas that are the foundation for the short-term direction.
This is pure VPA/VSA logic, the interplay of Price Analysis ,Volume Analysis and News, where each bar is not just a bar , but a clue in the story that professionals are writing.
When you monitor volume, price, and news together and perform multi-timeframe analysis, it becomes clear what the whales are doing, and why.
🔹 From the chart above
The market reached a weekly resistance level and then pulled back slightly after whales triggered the stop-losses of breakout traders.
Prior to the breakout, whales had accumulated positions by creating a series of liquidity-rich buying zones on the daily timeframe.
It's essential to understand the broader context before choosing to participate alongside them—whether you're planning to buy or sell.
🔴 Tips
Use volume and price analysis together, not separately.
Monitor any unusual volume bars before economic market news.
Monitor news and volatility spikes to detect traps and entries.
Combine this with liquidity zones (support/resistance clusters).
Build a "narrative" per week: What is smart money trying to do?
A smart trader understands the tactics whales use, and knows how to navigate around them.

Bitcoin - Reclaim or Reject? Key 4H FVG Levels in FocusAfter an extended move lower, Bitcoin has just swept the major 4H lows and immediately bounced back with strength. This aggressive reaction suggests the sweep was likely a liquidity grab rather than a continuation. Price is now trading back inside a large 4H fair value gap, which could serve as a short-term magnet while market participants reassess direction.
Key Price Reaction and Fair Value Gap Context
The current rebound into the 4H FVG is notable. This zone holds significance because it's the last inefficiency left unfilled before the final leg down. If buyers manage to push through and close above this imbalance, it would indicate a short-term reclaim and open the door to a bullish liquidity sweep higher. The clean highs just above are marked by the $$ label, which align with a key inducement zone and should attract price if bullish momentum sustains.
Upside Scenario – Targeting the Liquidity Sweep
If we do see a clean move and close above the fair value gap, I’ll be looking for price to extend toward the highs just above it. These highs are likely to be the next target for liquidity collection, especially if short-term traders begin chasing strength. However, I’m not expecting price to trade beyond that zone. There’s a protected high resting above, and unless a significant fundamental shift occurs, it’s unlikely we break that structure.
Downside Risk – Failure to Hold Could Lead to 99K
If the market fails to close above the FVG or quickly gets rejected on a wick into it, the bullish scenario becomes invalid. That would confirm the move back up was simply a retracement after the sweep, setting the stage for further downside continuation. In that case, I expect the market to break lower and move toward 99K, which remains my downside target under bearish conditions.
Conclusion
Bitcoin just swept key 4H lows and is now testing a large imbalance. A close above could trigger a run on the $$ liquidity, but I do not expect price to move beyond that due to the presence of protected highs. On the other hand, failure to break and hold above the FVG opens the door for a deeper flush toward 99K.
___________________________________
Thanks for your support!
If you found this idea helpful or learned something new, drop a like 👍 and leave a comment, I’d love to hear your thoughts! 🚀

TESLA RECOVERY AHEAD|LONG|
✅TESLA lost more than 25%
On the Elon VS Trump fallout
In less than a week which is
Seen by many as an excellent
Opportunity to add TESLA stocks
To their portfolios with a great
Discount which is why we are
Already seeing a nice rebound
From the wide strong horizontal
Support just above 270$ level
And as we are locally bullish
Biased we will be expecting
Further growth on Monday
LONG🚀
✅Like and subscribe to never miss a new idea!✅
Disclosure: I am part of Trade Nation's Influencer program and receive a monthly fee for using their TradingView charts in my analysis.

AMAZON Resistance Ahead! Sell!
Hello,Traders!
AMAZON keeps gaining
Bullish momentum so we
Are bullish biased mid-term
However it will soon hit a
Horizontal resistance of 219.00$
From where we will be expecting
A local bearish correction
Sell!
Comment and subscribe to help us grow!
Check out other forecasts below too!
Disclosure: I am part of Trade Nation's Influencer program and receive a monthly fee for using their TradingView charts in my analysis.

GBP-JPY Free Signal! Sell!
Hello,Traders!
GBP-JPY made a retest of
The strong horizontal resistance
Of 196.260 and the pair seems
To be locally overbought
So we will go short with
The Take Profit of 195.525
And the Stop Loss of 196.455
Sell!
Comment and subscribe to help us grow!
Check out other forecasts below too!
Disclosure: I am part of Trade Nation's Influencer program and receive a monthly fee for using their TradingView charts in my analysis.

GBP_USD SWING BREAKOUT|SHORT|
✅GBP_USD was trading in an
Uptrend along the rising support
But now this support is broken
And the breakout is confirmed
So we are bearish biased
And we will be expecting a
Further bearish move down
SHORT🔥
✅Like and subscribe to never miss a new idea!✅
Disclosure: I am part of Trade Nation's Influencer program and receive a monthly fee for using their TradingView charts in my analysis.

GBP_JPY WILL FALL|SHORT|
✅GBP_JPY went up sharply
But a strong resistance level was hit at 196.400
Thus I am expecting a pullback
And a move down towards the target of 195.671
SHORT🔥
✅Like and subscribe to never miss a new idea!✅
Disclosure: I am part of Trade Nation's Influencer program and receive a monthly fee for using their TradingView charts in my analysis.

GBP-USD Local Long! Buy!
Hello,Traders!
GBP-USD made a bearish
Breakout of the rising support
So we are bearish biased mid-term
But locally the pair will soon
Hit a horizontal support
So we will be expecting a
Rebound and a local move up
Buy!
Comment and subscribe to help us grow!
Check out other forecasts below too!
Disclosure: I am part of Trade Nation's Influencer program and receive a monthly fee for using their TradingView charts in my analysis.

EUR/USD - After taking the highs, are the lows next?The EUR/USD currency pair is moving between two important price levels. The top level is 1.1454 and the bottom level is 1.1357. This means the price is staying inside a range. Yesterday, the price of EUR/USD went above the top level of 1.1454. By doing this, it triggered many stop-loss orders from traders who were expecting the price to go down. These traders had placed their stop-losses just above this level, and the market moved up to take them out.
Current support of the 1H FVG
Now, the price is starting to go down again. It is getting closer to the lower level of the range, which is around 1.1357. There is a chance that the market will go below this level as well. If that happens, it may take out the stop-loss orders of traders who are expecting the price to go up. These traders often place their stop-losses just below the low point of the range. When the market goes below the low, it collects liquidity. In simple words, it grabs the orders that are waiting there.
Looking at the chart, we can see that EUR/USD has found some support at the 1-hour Fair Value Gap (1H FVG). This area is acting like a short-term floor for the price. If a full 1-hour candle closes below this support area, then the price will likely fall further. In that case, it may reach the bottom of the range and possibly move below it to take out more stop-losses.
Why below support?
But why would the market go below the low on purpose? The reason is that many retail traders, those are small traders who trade from home, often put their stop-losses just below the recent low. If the market moves there, it activates those stop-losses. These stop-losses are usually sell orders, and when they get triggered, it gives the market extra selling power. After collecting this liquidity, the market often uses the new buying interest (from other traders entering long positions) to push the price back up again.
Conclusion
So in summary, the EUR/USD is still inside a range. It has already moved above the top to take out stop-losses, and now it might go below the bottom to do the same. After that, there could be a strong move upward, powered by the new liquidity in the market.
Disclosure: I am part of Trade Nation's Influencer program and receive a monthly fee for using their TradingView charts in my analysis.
Thanks for your support.
- Make sure to follow me so you don't miss out on the next analysis!
- Drop a like and leave a comment!

XAUUSD Short idea for todayWe are now in an bearish imbalance in 4H TF and now looking for break of structure on m15 to validate the idea to short as per the chart, still waiting for confirmation in the form of break of structure or 15m imbalance.

EURUSDVery important area now for EURUSD
Will the unmitigated OB's on the 1H stand strong or, will we continue lower. due to the HTF area of value.
Took a nice short on the 5min TF for a 1:21 RR.
Now lets see how this plays out should be really interesting
GBPUSD - ShortLooking at a key supply area on the higher timeframe of GBPUSD
We now have a structural shift to the downside on the 1H TF that has left an unmitigated OB with a level of inducement.
Pending order will be set on this pair @ 1.35676
We will see how the market plays out around this area
Peace

US30: Target Is Up! Long!
My dear friends,
Today we will analyse US30 together☺️
The price is near a wide key level
and the pair is approaching a significant decision level of 42.596.9 Therefore, a strong bullish reaction here could determine the next move up.We will watch for a confirmation candle, and then target the next key level of 42.690.5. Recommend Stop-loss is beyond the current level.
❤️Sending you lots of Love and Hugs❤️

SILVER: Move Down Expected! Short!
My dear friends,
Today we will analyse SILVER together☺️
The recent price action suggests a shift in mid-term momentum. A break below the current local range around 36.190 will confirm the new direction downwards with the target being the next key level of 35.901.and a reconvened placement of a stop-loss beyond the range.
❤️Sending you lots of Love and Hugs❤️

GOLD: Strong Growth Ahead! Long!
My dear friends,
Today we will analyse GOLD together☺️
The in-trend continuation seems likely as the current long-term trend appears to be strong, and price is holding above a key level of 3,358.70 So a bullish continuation seems plausible, targeting the next high. We should enter on confirmation, and place a stop-loss beyond the recent swing level.
❤️Sending you lots of Love and Hugs❤️

EURUSD: Local Bearish Bias! Short!
My dear friends,
Today we will analyse EURUSD together☺️
The market is at an inflection zone and price has now reached an area around 1.14182 where previous reversals or breakouts have occurred.And a price reaction that we are seeing on multiple timeframes here could signal the next move down so we can enter on confirmation, and target the next key level of 1.14050..Stop-loss is recommended beyond the inflection zone.
❤️Sending you lots of Love and Hugs❤️

GOLD Long From Rising Support! Buy!
Hello,Traders!
GOLD is trading in an
Uptrend and the price is
Making a local pullback
But as we are bullish
Biased we will be expecting
A rebound from the rising
Support line and a move up
Buy!
Comment and subscribe to help us grow!
Check out other forecasts below too!
Disclosure: I am part of Trade Nation's Influencer program and receive a monthly fee for using their TradingView charts in my analysis.

GBPUSD reaches resistance zone: Watching for potential reversalOANDA:GBPJPY has reached a pretty significant resistance level, that has been an obvious turning point in the past, with several strong reversals from the area. So naturally, I’m watching to see how price reacts here again.
If we get confirmation of rejection (what I usually watch for: like a bearish engulfing candle, long upper wicks or signs of increased selling pressure), I’ll be looking for short setups from there.
🟥 My sell idea is based on the expectation that this resistance will hold. I would be targeting a move down toward the 192.000 level, which I feel is a realistic and clean target, especially if price respects this structure again.
But if price breaks above and starts holding strong above the zone, then I’ll back off the bearish bias and reassess, and I’d consider the bearish idea invalidated, with potential for further upside 🚀
Just sharing how I see the chart right now, not financial advice 💕✨

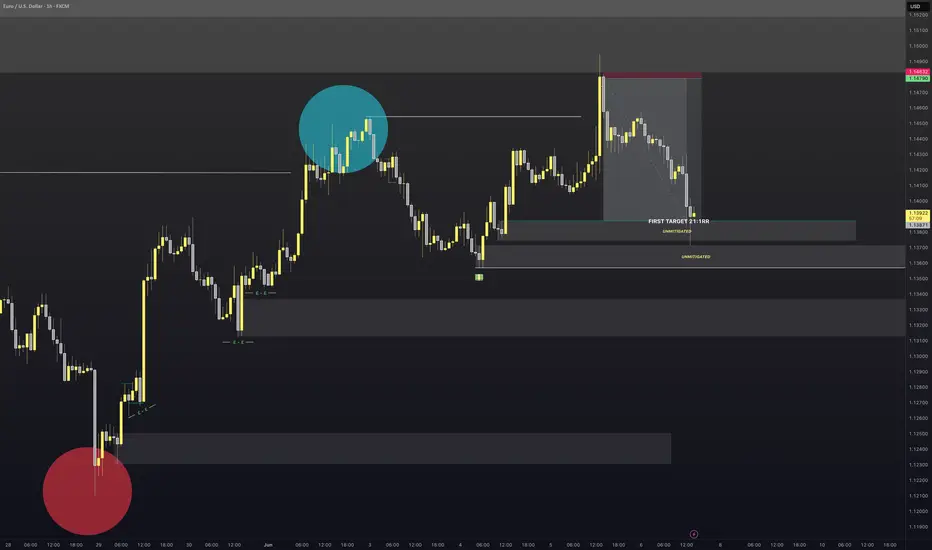
EURUSD - SellEntered this earlier on the 1min TF
Target will be the first Order Block which is 21:RR.
The reason I am targeting here is the 4H order flow is still bullish. So if we can hit the target I close 50% of the position and let the rest ride and manage accordingly to price.
Lets see how it plays out

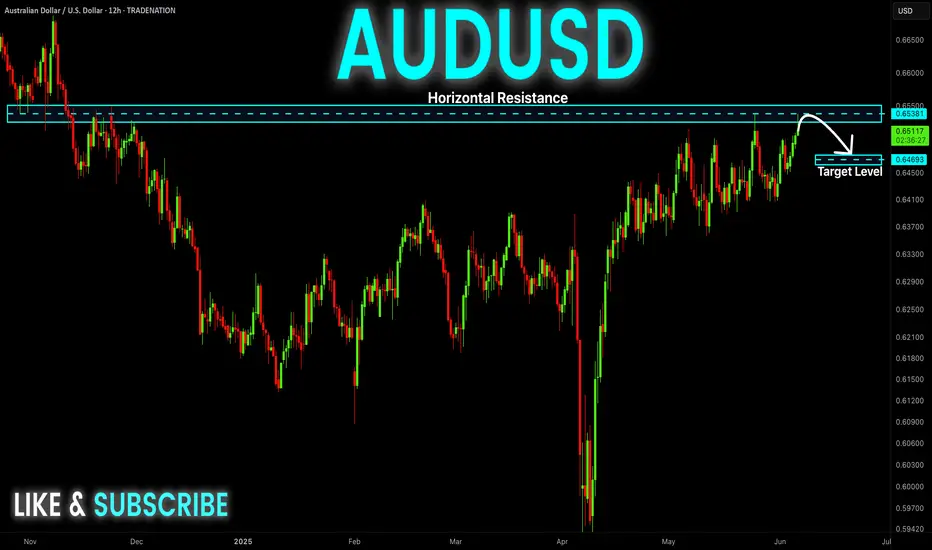
AUD-USD Short From Resistance! Sell!
Hello,Traders!
AUD-USD went up and hit
A horizontal resistance level
Of 0.6541 and as the level
Is strong we will be expecting
A local pullback and a
Bearish correction
Sell!
Comment and subscribe to help us grow!
Check out other forecasts below too!
Disclosure: I am part of Trade Nation's Influencer program and receive a monthly fee for using their TradingView charts in my analysis.
DXY: Local Bearish Bias! Short!
My dear friends,
Today we will analyse DXY together☺️
The market is at an inflection zone and price has now reached an area around 98.335 where previous reversals or breakouts have occurred.And a price reaction that we are seeing on multiple timeframes here could signal the next move down so we can enter on confirmation, and target the next key level of 98.090..Stop-loss is recommended beyond the inflection zone.
❤️Sending you lots of Love and Hugs❤️
