GBP_NZD WILL GROW|LONG|
✅GBP_NZD has retested a key support level of 2.2520
And as the pair is already making a bullish rebound
A move up to retest the supply level above at 2.2600 is likely
LONG🚀
✅Like and subscribe to never miss a new idea!✅
Disclosure: I am part of Trade Nation's Influencer program and receive a monthly fee for using their TradingView charts in my analysis.
SMC

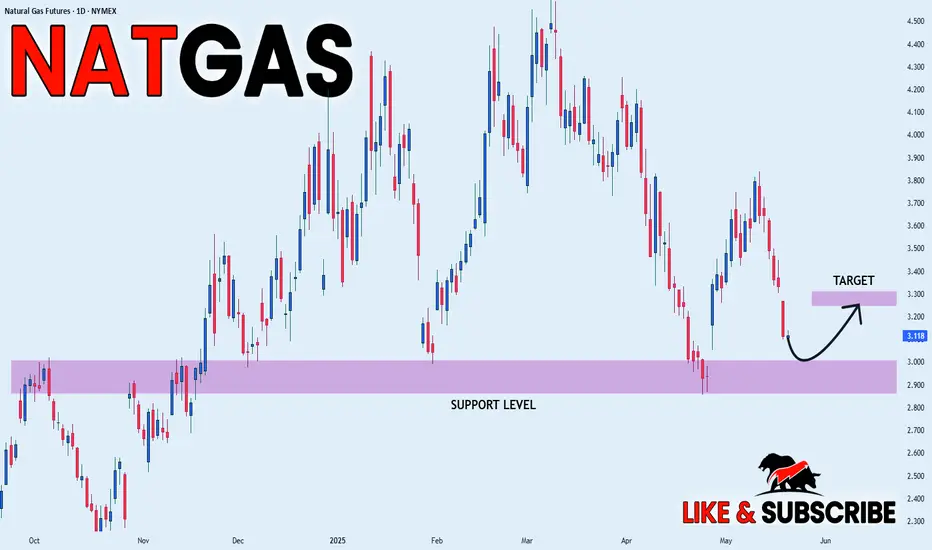
NATGAS SWING LONG|
✅NATGAS is set to retest a
Strong support level below at 2.90$
After trading in a local downtrend from some time
Which makes a bullish rebound a likely scenario
With the target being a local resistance above at 3.26$
LONG🚀
✅Like and subscribe to never miss a new idea!✅
Disclosure: I am part of Trade Nation's Influencer program and receive a monthly fee for using their TradingView charts in my analysis.
GBP-AUD Double Top Pattern! Sell!
Hello,Traders!
GBP-AUD made a retest
Of the horizontal resistance
Level of 2.0820, then
Established a double-top
Pattern and is now going
Down so we are locally
Bearish biased which
Means that we will be
Expecting a further
Bearish move down
Sell!
Comment and subscribe to help us grow!
Check out other forecasts below too!
Disclosure: I am part of Trade Nation's Influencer program and receive a monthly fee for using their TradingView charts in my analysis.

USD-CHF Will Grow! Buy!
Hello,Traders!
USD-CHF made a retest of
The horizontal support level
Of 0.8318 from where we
Are already seeing a bullish
Rebound so we are locally
Bullish biased and we will
Be expecting a further
Bullish move up
Buy!
Comment and subscribe to help us grow!
Check out other forecasts below too!
Disclosure: I am part of Trade Nation's Influencer program and receive a monthly fee for using their TradingView charts in my analysis.

EUR_USD WILL GO DOWN|SHORT|
✅EUR_USD has retested a
Resistance level of 1.1290
And we are seeing a bearish reaction
With the price going down so we are
Bearish biased now and we will be
Expecting the pair to go further down
SHORT🔥
✅Like and subscribe to never miss a new idea!✅
Disclosure: I am part of Trade Nation's Influencer program and receive a monthly fee for using their TradingView charts in my analysis.

DXY: Local Bullish Bias! Long!
My dear friends,
Today we will analyse DXY together☺️
The price is near a wide key level
and the pair is approaching a significant decision level of 99.946Therefore, a strong bullish reaction here could determine the next move up.We will watch for a confirmation candle, and then target the next key level of 100.223.Recommend Stop-loss is beyond the current level.
❤️Sending you lots of Love and Hugs❤️

GOLD: Absolute Price Collapse Ahead! Short!
My dear friends,
Today we will analyse GOLD together☺️
The recent price action suggests a shift in mid-term momentum. A break below the current local range around 3,233.07 will confirm the new direction downwards with the target being the next key level of 3,221.68 and a reconvened placement of a stop-loss beyond the range.
❤️Sending you lots of Love and Hugs❤️

SILVER: Will Go Down! Short!
My dear friends,
Today we will analyse SILVER together☺️
The in-trend continuation seems likely as the current long-term trend appears to be strong, and price is holding below a key level of 32.359 So a bearish continuation seems plausible, targeting the next low. We should enter on confirmation, and place a stop-loss beyond the recent swing level.
❤️Sending you lots of Love and Hugs❤️

EURUSD: The Market Is Looking Up! Long!
My dear friends,
Today we will analyse EURUSD together☺️
The market is at an inflection zone and price has now reached an area around 1.12314 where previous reversals or breakouts have occurred.And a price reaction that we are seeing on multiple timeframes here could signal the next move up so we can enter on confirmation, and target the next key level of 1.12646.Stop-loss is recommended beyond the inflection zone.
❤️Sending you lots of Love and Hugs❤️

Is NASDAQ ready to correct for a few days?We have a couple of doji candles on the daily chart forming out of a bearish imbalance range in the relative premium. This is the perfect place to test the lows for stops.
We are still bullish but I am going to go neutral for this forecast in anticipation of a slight correction.
Share this with someone who needs a complete top down analysis of where we are staring this week!

EURAUD READY FOR ANOTHER SWING RALLYI just entered this EURAUD Swing long trade.
Reason;
Monthly is extremely bullish.
Weekly is extremely bullish.
4H changed trend from downtrend to a bullish structure with confirmation through higher highs and higher lows.
The trade was entered on 4H time frame.
It's a 4RR trade setup.

Gold Urgent Update.Gold Urgent Update
Gold has recently touched its 4-hour bullish Fair Value Gap (FVG) and is now moving upward. Additionally, there is existing liquidity from previous days positioned above the current price level, which further increases the probability of a continued bullish move.
There is a high likelihood that the market could rise towards the price levels of 3250, 3260, and possibly even 3265. These levels should be closely monitored, as they represent potential short-term targets based on the current price action and market structure.
At this stage, it is advised to avoid entering any selling (short) positions unless a clear and confirmed bearish signal is observed. The market sentiment remains decisively bullish, and until any bearish reversal patterns are confirmed, the upward trend should be respected.
Please conduct your own research (DYOR) and practice proper risk management when trading towards the mentioned target levels.

BITCOIN CORRECTION AHEAD|SHORT|
✅BITCOIN keeps growing in a
Strong uptrend in a narrowing
Bearish wedge pattern and the
Coin has reached a horizontal
Resistance level of 108000$
So IF we see a breakout from
The wedge a local bearish
Correction is to be expected
SHORT🔥
✅Like and subscribe to never miss a new idea!✅
Disclosure: I am part of Trade Nation's Influencer program and receive a monthly fee for using their TradingView charts in my analysis.

NZD-JPY Bearish Breakout! Sell!
Hello,Traders!
NZD-JPY made a bearish
Breakout of the rising support
Line then made a retest of the
New resistance and is going
Down now so we are bearish
Biased and we will be expecting
A further bearish move down
Sell!
Comment and subscribe to help us grow!
Check out other forecasts below too!
Disclosure: I am part of Trade Nation's Influencer program and receive a monthly fee for using their TradingView charts in my analysis.

NZD_JPY FALLING SUPPORT AEHAD|LONG|
✅NZD_JPY has been falling recently
And the pair seems locally oversold
So as the pair is approaching
A falling support line
Price growth is to be expected
LONG🚀
✅Like and subscribe to never miss a new idea!✅
Disclosure: I am part of Trade Nation's Influencer program and receive a monthly fee for using their TradingView charts in my analysis.

USD-CAD Risky Short! Sell!
Hello,Traders!
USD-CAD is trading beneath
A wide strong horizontal
Resistance level around 1.4027
So after the retest we will
Be expecting a local
Bearish pullback and
A move down
Sell!
Comment and subscribe to help us grow!
Check out other forecasts below too!
Disclosure: I am part of Trade Nation's Influencer program and receive a monthly fee for using their TradingView charts in my analysis.

GBP_JPY GROWTH AHEAD|LONG|
✅GBP_JPY is going down now
But a strong support level is ahead
Thus I am expecting a rebound
And a move up towards the target above 194.000
LONG🚀
✅Like and subscribe to never miss a new idea!✅
Disclosure: I am part of Trade Nation's Influencer program and receive a monthly fee for using their TradingView charts in my analysis.

EUR-USD Bearish Bias! Sell!
Hello,Traders!
EUR-USD made a retest
Of the key horizontal level
Around 1.1255 and already
Made a pullback so we will
Be expecting a local
Bearish move down
Sell!
Comment and subscribe to help us grow!
Check out other forecasts below too!
Disclosure: I am part of Trade Nation's Influencer program and receive a monthly fee for using their TradingView charts in my analysis.

Week of 5/18/25: EURUSD AnalysisAll time frames are bearish on EU, looking for a setup at the 4h POI before looking for an entry short.
Major News:
Unemployment - Thursday

Week of 5/18/25: Audusd AnalysisAU is bearish in the short-term until 1h timeframe shifts back to bullish to align with 4h and daily structure. We're looking for shorts in the meantime until price reaches the extreme of the swing structure.
Major News:
Unemployment - Thursday

BTC Preparing for A Move Towards $110k Are You Ready?Bitcoin Market Update: BTC Preparing for a Move Towards 109,200 and 110,000 Levels
Bitcoin (BTC) appears to be gearing up for a potential upward move targeting the 109,200 to 110,000 price range. Over the past several days, Bitcoin has been consolidating within a tight range, indicating accumulation and market indecision. However, the latest price action has shown a strong bullish breakout, confirmed by a solid bullish candle, followed by a healthy retest of the breakout zone.
This retest suggests that Bitcoin may now be preparing for its next leg upward. The current price area presents a possible buying opportunity, especially as we approach the key black-marked zones on the chart. These levels are significant because they hold pending liquidity from previous days’ highs and also correspond to notable swing highs—areas where the market previously reversed.
Traders should remain alert and not miss this potential opportunity. It's crucial to monitor the market closely for any structural shifts or additional confirmation signals, such as bullish patterns, increased volume, or momentum indicators aligning with the upward trend.
As always, conduct your own research (DYOR) before making any trading decisions. Market conditions can change rapidly, and informed decisions backed by solid analysis are essential for successful trading.

ETHUSD: Strong Growth Ahead! Long!
My dear friends,
Today we will analyse ETHUSD together☺️
The price is near a wide key level
and the pair is approaching a significant decision level of 2,566.3 Therefore, a strong bullish reaction here could determine the next move up.We will watch for a confirmation candle, and then target the next key level of 2,601.4.Recommend Stop-loss is beyond the current level.
❤️Sending you lots of Love and Hugs❤️

BTCUSD: Will Go Down! Short!
My dear friends,
Today we will analyse BTCUSD together☺️
The recent price action suggests a shift in mid-term momentum. A break below the current local range around 105,444.37 will confirm the new direction downwards with the target being the next key level of 104,692.82 and a reconvened placement of a stop-loss beyond the range.
❤️Sending you lots of Love and Hugs❤️
