SILVER SUPPORT AHEAD|LONG|
✅SILVER has been falling recently
And Silver seems locally oversold
So as the pair is approaching
A horizontal support of 37.80$
Price growth is to be expected
LONG🚀
✅Like and subscribe to never miss a new idea!✅
Disclosure: I am part of Trade Nation's Influencer program and receive a monthly fee for using their TradingView charts in my analysis.
SMC

CAD-CHF Local Rebound Ahead! Buy!
Hello,Traders!
CAD-CHF made a retest
Of the horizontal support
At 0.5797 from where we
Are already seeing a bullish
Reaction so we will be
Expecting a further local
Bullish move up
Buy!
Comment and subscribe to help us grow!
Check out other forecasts below too!
Disclosure: I am part of Trade Nation's Influencer program and receive a monthly fee for using their TradingView charts in my analysis.

CAD_JPY WILL GO UP|LONG|
✅CAD_JPY will soon retest a key support level of 107.500
So I think that the pair will make a rebound
And go up to retest the supply level above at 108.100
LONG🚀
✅Like and subscribe to never miss a new idea!✅
Disclosure: I am part of Trade Nation's Influencer program and receive a monthly fee for using their TradingView charts in my analysis.

GBP-NZD Will Keep Falling! Sell!
Hello,Traders!
GBP-NZD keeps falling down
And the pair made a strong
Bearish breakout of the key
Horizontal key level of 2.2400
And the breakout is confirmed
So we are bearish biased and
We will be expecting a further
Bearish move down on Monday
Sell!
Comment and subscribe to help us grow!
Check out other forecasts below too!
Disclosure: I am part of Trade Nation's Influencer program and receive a monthly fee for using their TradingView charts in my analysis.

EUR_JPY WILL GROW|LONG|
✅EUR_JPY will keep growing
Because the pair is in the uptrend
And recently broke the key level of 173.200
So we will be expecting
Bullish continuation
LONG🚀
✅Like and subscribe to never miss a new idea!✅
Disclosure: I am part of Trade Nation's Influencer program and receive a monthly fee for using their TradingView charts in my analysis.

EUR-GBP Swing Short! Sell!
Hello,Traders!
EUR-GBP keeps growing in
A strong uptrend but the pair
Is locally overbought so after
The price hits a horizontal
Resistance level of 0.8764
We will be expecting a
Local bearish correction
Sell!
Comment and subscribe to help us grow!
Check out other forecasts below too!
Disclosure: I am part of Trade Nation's Influencer program and receive a monthly fee for using their TradingView charts in my analysis.

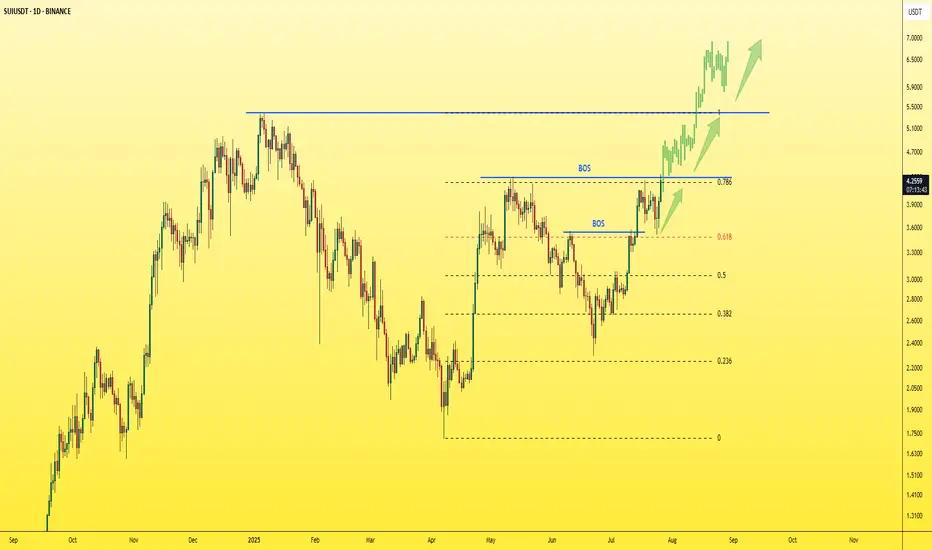
SUI - Just one step away from the explosion!The last candle on the daily chart just confirmed a BOS (Break of Structure) — a clear and strong sign of bullish continuation for the asset.
✅ This is a textbook entry for a long position.
🎯 Next target: $5 — and so far, no bearish signs in sight.
Best regards,
Ceciliones 🎯
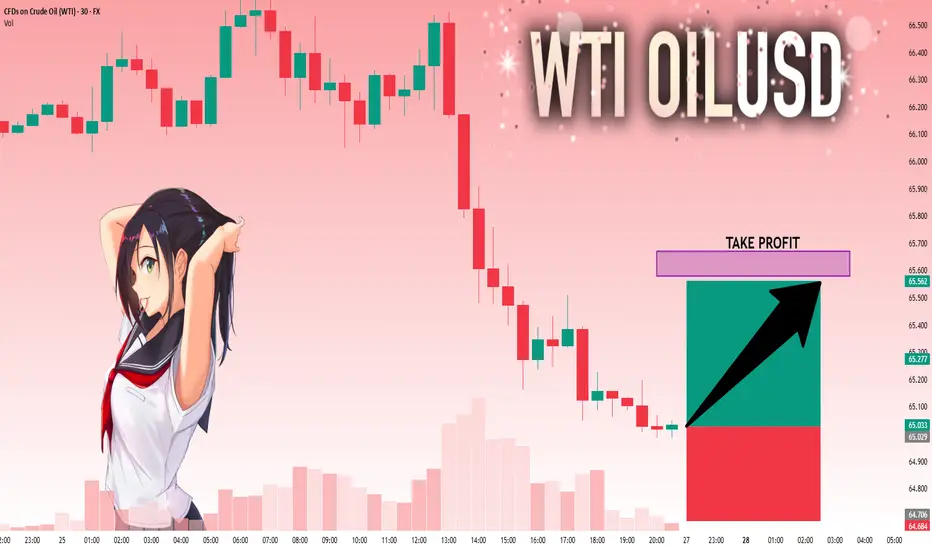
USOIL: Next Move Is Up! Long!
My dear friends,
Today we will analyse USOIL together☺️
The market is at an inflection zone and price has now reached an area around 65.029 where previous reversals or breakouts have occurred.And a price reaction that we are seeing on multiple timeframes here could signal the next move up so we can enter on confirmation, and target the next key level of 65.579.Stop-loss is recommended beyond the inflection zone.
❤️Sending you lots of Love and Hugs❤️
NG1!: Target Is Up! Long!
My dear friends,
Today we will analyse NG1! together☺️
The price is near a wide key level
and the pair is approaching a significant decision level of 3.087 Therefore, a strong bullish reaction here could determine the next move up.We will watch for a confirmation candle, and then target the next key level of 3.107.Recommend Stop-loss is beyond the current level.
❤️Sending you lots of Love and Hugs❤️

NI225: Move Down Expected! Short!
My dear friends,
Today we will analyse NI225 together☺️
The recent price action suggests a shift in mid-term momentum. A break below the current local range around 41,456.23 will confirm the new direction downwards with the target being the next key level of 40,954.70 and a reconvened placement of a stop-loss beyond the range.
❤️Sending you lots of Love and Hugs❤️

CAD-JPY Rebound Ahead! Buy!
Hello,Traders!
CAD-JPY made a retest
Of the horizontal support
Of 107.400 from where we
Are already seeing a bullish
Rebound and we will be
Expecting a further bullish
Move up
Buy!
Comment and subscribe to help us grow!
Check out other forecasts below too!
Disclosure: I am part of Trade Nation's Influencer program and receive a monthly fee for using their TradingView charts in my analysis.

EUR_CAD LOCAL SHORT|
✅EUR_CAD is going up to retest
A horizontal resistance of 1.6110
Which makes me locally bearish biased
And I think that we will see a pullback
And a move down from the level
Towards the target below at 1.6077
SHORT🔥
✅Like and subscribe to never miss a new idea!✅
Disclosure: I am part of Trade Nation's Influencer program and receive a monthly fee for using their TradingView charts in my analysis.

GBP_USD LONG FROM SUPPORT|
✅GBP_USD has been falling recently
And the pair seems locally oversold
So as the pair is approaching
A horizontal support of 1.3399
Price growth is to be expected
LONG🚀
✅Like and subscribe to never miss a new idea!✅
Disclosure: I am part of Trade Nation's Influencer program and receive a monthly fee for using their TradingView charts in my analysis.

EURUSD - Next Buy Zone? This one has some nice potential
We will see how it plays out if we get tagged in

EUR-CAD Risky Short! Sell!
Hello,Traders!
EUR-CAD is trading in a
Strong uptrend so we are
Bullish biased long-term
However a strong horizontal
Resistance is ahead at 1.6110
And the pair is overbought
So after the retest of the
Resistance we will be
Expecting a bearish correction
Sell!
Comment and subscribe to help us grow!
Check out other forecasts below too!
Disclosure: I am part of Trade Nation's Influencer program and receive a monthly fee for using their TradingView charts in my analysis.

GBP_NZD BEARISH BREAKOUT|SHORT|
✅GBP_NZD is going down currently
As the pair broke the key structure level of 2.2400
Which is now a resistance, and after the pullback
And retest, I think the price will go further down
SHORT🔥
✅Like and subscribe to never miss a new idea!✅
Disclosure: I am part of Trade Nation's Influencer program and receive a monthly fee for using their TradingView charts in my analysis.

GBP-USD Support Ahead! Buy!
Hello,Traders!
GBP-USD went down but
The pair will soon hit a
Horizontal support level
Of 1.3400 from where we
Will be expecting a local
Rebound and a move up
Buy!
Comment and subscribe to help us grow!
Check out other forecasts below too!
Disclosure: I am part of Trade Nation's Influencer program and receive a monthly fee for using their TradingView charts in my analysis.

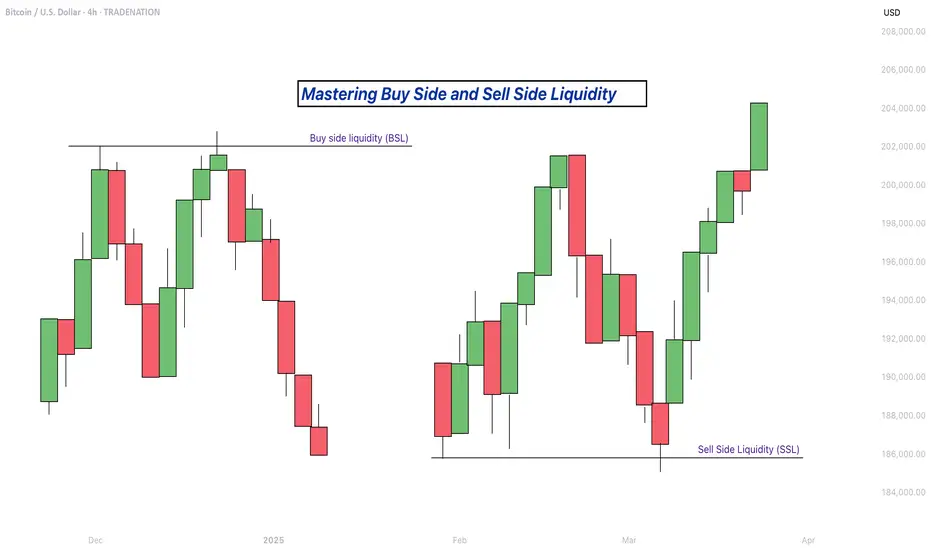
Mastering Buy Side and Sell Side Liquidity - How to trade it!In trading, understanding liquidity is one of the keys to predicting where the market might go next. The Inner Circle Trader (ICT) method teaches traders how to recognize where big players like banks and institutions are likely to enter or exit trades. Two important ideas in ICT trading are buy side liquidity and sell side liquidity. Once you understand what these terms mean and how to spot them on a chart, you can start using them to find better trading opportunities.
What will be discussed?
- What is Buy Side Liquidity?
- What is Sell Side Liquidity?
- How do you see Buy and Sell Side Liquidity?
- Examples
- How to trade BSL and SLL Liquidity?
What is Buy Side Liquidity
Buy side liquidity is found above market highs. It refers to all the stop loss orders from people who are holding short positions. When the market is going down, some traders sell (or go short) and place their stop losses above recent highs to protect themselves. These stop losses are actually buy orders because closing a short position requires buying. Big institutions know this, so they push price upward to trigger those stop losses and grab that liquidity. That’s why you’ll often see the market spike above a recent high before reversing. That spike is the market grabbing buy side liquidity.
What is Sell Side Liquidity
Sell side liquidity is the opposite. It’s found below recent lows. This is where traders who are buying (going long) place their stop losses. If someone buys a market, they’ll usually put a stop loss just below a previous low. That stop loss is a sell order. Smart money looks at these areas as pools of sell side liquidity. So when the market moves down quickly and breaks a recent low, it’s likely collecting those sell stop orders. After that, you’ll often see a reversal because the liquidity has been taken.
How do you see Buy and Sell Side Liquidity?
You can spot buy side and sell side liquidity by looking at the chart and identifying recent highs and lows where many traders might have placed stop losses. These are usually obvious swing highs and swing lows. If you look at a chart and see a clean high where price previously reversed, that’s likely where traders are placing stops. That makes it a target for buy side liquidity. Same for a recent low, if it’s a clean level where people might have bought in the past, that low probably holds sell side liquidity. The more obvious the level looks, the more likely it’s full of stops and therefore a liquidity target.
Examples
How to trade BSL and SLL Liquidity?
Trading liquidity means watching for the market to run above a recent high (to take buy side liquidity) or below a recent low (to take sell side liquidity), and then looking for signs of reversal. Once liquidity has been taken, the market often changes direction.
When you’re trading the ICT concept of liquidity, the key is not just spotting where liquidity lies, but also knowing when price is likely to reverse after that liquidity has been taken. Reversals don’t happen randomly, they leave clues on the chart. Here’s how you can recognize those signs in a simple way:
1. Market Structure Break
This is one of the clearest signs of a reversal. Let’s say the market grabs sell side liquidity by breaking below a recent low. If price then quickly starts moving up and breaks above the last lower high, that’s a break in structure. It shows that sellers are losing control and buyers are stepping in. It’s the first confirmation that the direction might be changing.
2. Rejection Wicks or Strong Candles
After price runs into liquidity (above a high or below a low), watch the candlesticks closely. If you see a long wick rejecting the level, or a strong candle in the opposite direction right after the liquidity grab, that’s a clue. It means price went there, collected the orders, and got rejected fast. That rejection shows the market might be reversing.
3. Fair Value Gaps (FVGs)
Fair value gaps are small “windows” left in price when it moves quickly in one direction. After liquidity is taken and price starts reversing, it often leaves an FVG behind. If price pulls back into that gap and holds, that can be a great entry point. FVGs act like magnets and support zones in ICT.
4. Displacement
Displacement is a strong, impulsive move that breaks structure. It usually happens right after liquidity is taken. If price moves very fast in the opposite direction after hitting a liquidity level, that’s a good sign smart money is behind the move and it’s not just random noise. That strong push is a hint that a new trend might be forming.
5. Change in Character (CHOCH)
This is a shift in how the market behaves. For example, price might be making lower highs and lower lows (a bearish trend), but after liquidity is taken, it suddenly starts making higher highs and higher lows. That change in character tells you the trend might be reversing.
-------------------------
Disclosure: I am part of Trade Nation's Influencer program and receive a monthly fee for using their TradingView charts in my analysis.
Thanks for your support. If you enjoyed this analysis, make sure to follow me so you don't miss the next one. And if you found it helpful, feel free to drop a like 👍 and leave a comment 💬, I’d love to hear your thoughts!
US30: Local Bearish Bias! Short!
My dear friends,
Today we will analyse US30 together☺️
The in-trend continuation seems likely as the current long-term trend appears to be strong, and price is holding below a key level of 44,774.9 So a bearish continuation seems plausible, targeting the next low. We should enter on confirmation, and place a stop-loss beyond the recent swing level.
❤️Sending you lots of Love and Hugs❤️

GOLD: Strong Growth Ahead! Long!
My dear friends,
Today we will analyse GOLD together☺️
The market is at an inflection zone and price has now reached an area around 3,338.79 where previous reversals or breakouts have occurred.And a price reaction that we are seeing on multiple timeframes here could signal the next move up so we can enter on confirmation, and target the next key level of 3,351.09.Stop-loss is recommended beyond the inflection zone.
❤️Sending you lots of Love and Hugs❤️

EURUSD: Will Go Up! Long!
My dear friends,
Today we will analyse EURUSD together☺️
The price is near a wide key level
and the pair is approaching a significant decision level of 1.17201 Therefore, a strong bullish reaction here could determine the next move up.We will watch for a confirmation candle, and then target the next key level of 1.17348.Recommend Stop-loss is beyond the current level.
❤️Sending you lots of Love and Hugs❤️

SILVER: The Market Is Looking Down! Short!
My dear friends,
Today we will analyse SILVER together☺️
The recent price action suggests a shift in mid-term momentum. A break below the current local range around 38.780 will confirm the new direction downwards with the target being the next key level of 38.635.and a reconvened placement of a stop-loss beyond the range.
❤️Sending you lots of Love and Hugs❤️

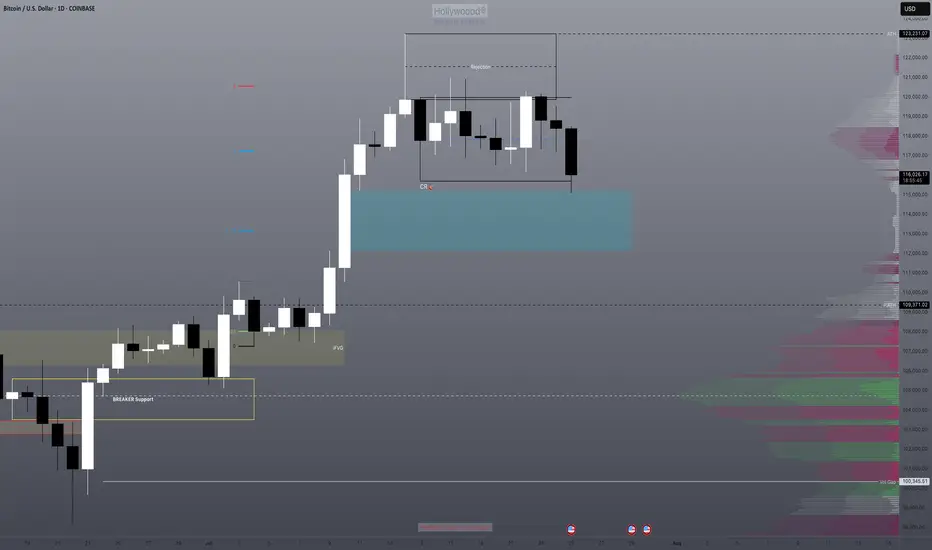
Will the low of this BTC zone be used as a buy point?We have an imbalance high being tested. We know that this also represents the consolidation range low where both TPs and long entries will be triggered.
Will this be enough to send us back bullish or will be need further correction of the imbalance? I think there's a high probability of this with DXY also running into it's daily bearish imbalance range.