AUD_NZD GROWTH AHEAD|LONG|
✅AUD_NZD fell down sharply
But a strong support level was hit at 1.0910
Thus I am expecting a rebound
And a move up towards the target of 1.0930
LONG🚀
✅Like and subscribe to never miss a new idea!✅
Disclosure: I am part of Trade Nation's Influencer program and receive a monthly fee for using their TradingView charts in my analysis.
SMC

EUR-NZD Will Grow! Buy!
Hello,Traders!
EUR-NZD is making a local
Bearish correction while trading
In an uptrend along he rising
Support so after the pair hits
The support line a local bullish
Rebound is to be expected
Buy!
Comment and subscribe to help us grow!
Check out other forecasts below too!
Disclosure: I am part of Trade Nation's Influencer program and receive a monthly fee for using their TradingView charts in my analysis.

NZD-JPY Local Short! Sell!
Hello,Traders!
NZD-JPY has hit a horizontal
Resistance level of 88.851
And we are already seeing
A bearish reaction so we will
Be expecting a local
Bearish move down
On Monday!
Sell!
Comment and subscribe to help us grow!
Check out other forecasts below too!
Disclosure: I am part of Trade Nation's Influencer program and receive a monthly fee for using their TradingView charts in my analysis.

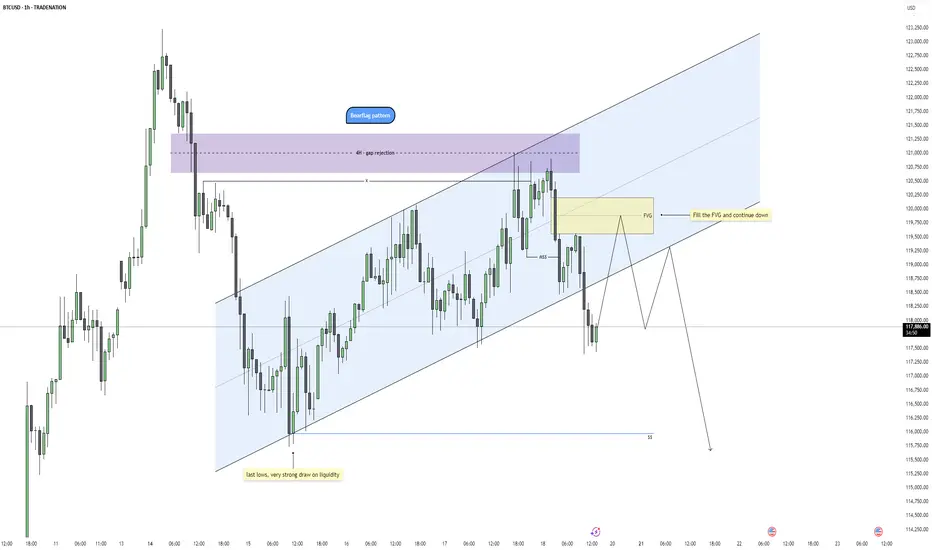
Bitcoin - Bearflag Structure Taking ShapeBitcoin is showing signs of weakness after a clean rejection from a 4H fair value gap, where price also swept the previous swing high. This aligns well with a broader bearish context as the market failed to sustain above the upper bounds of the trend channel, indicating potential exhaustion of the bullish correction.
Rejection Zone and Fair Value Gap
The rejection took place precisely within a 4H imbalance, adding confluence to the idea that this was a premium retracement in a bearish leg. The high formed inside that zone has now been swept, setting up conditions for distribution. A smaller 1H fair value gap was also left behind during the displacement move down, creating a clean area for price to return to and potentially react from.
Channel Structure and Bearflag Formation
Structurally, price has been climbing in a rising channel that resembles a bearflag pattern. The recent market structure shift broke the channel low, confirming that the rising structure is likely corrective. The rejection from the top of the flag and the subsequent breakdown align with a typical bearflag setup, suggesting a continuation move to the downside.
Short-Term Retracement Expectation
Before the next leg down, price may retrace to fill the unmitigated fair value gap while possibly sweeping the minor swing high that caused the current drop. This retracement would offer a premium shorting opportunity in alignment with the bearish bias, especially if internal structure remains weak on the lower timeframes during the return to the FVG.
Draw on Liquidity and Price Objective
The main objective for this setup is a sweep of the last equal lows near 115950, which represents a strong draw on liquidity. If the bearflag setup plays out fully, this area is highly vulnerable and could be the next significant target once the FVG is filled and lower timeframe distribution confirms.
Conclusion
Price has rejected from a 4H imbalance and swept liquidity to the upside, forming a clean bearflag structure. As long as price remains below the recent high and fills the 1H FVG without invalidating the shift, the path of least resistance looks to be down toward the liquidity resting below 115950. I’ll be watching for signs of weakness during the return to the FVG for a potential short trigger.
Disclosure: I am part of Trade Nation's Influencer program and receive a monthly fee for using their TradingView charts in my analysis.
___________________________________
Thanks for your support!
If you found this idea helpful or learned something new, drop a like 👍 and leave a comment, I’d love to hear your thoughts! 🚀
USD_JPY STRONG UPTREND|LONG|
✅USD_JPY is in a strong
Long-term uptrend now
And the pair is accumulating
For the next leg up so we will
Be expecting a bullish continuation
On Monday!
LONG🚀
✅Like and subscribe to never miss a new idea!✅
Disclosure: I am part of Trade Nation's Influencer program and receive a monthly fee for using their TradingView charts in my analysis.

EUR_AUD WILL GROW|LONG|
✅EUR_AUD is trading in an uptrend
With the pair set to retest
The rising support line
From where I think the growth will continue
LONG🚀
✅Like and subscribe to never miss a new idea!✅
Disclosure: I am part of Trade Nation's Influencer program and receive a monthly fee for using their TradingView charts in my analysis.

CAD-JPY Will Keep Growing! Buy!
Hello,Traders!
CAD-JPY keeps trading in
An uptrend and there is a
Rising support below so
We are bullish biased
And we will be expecting
A further bullish move up
Buy!
Comment and subscribe to help us grow!
Check out other forecasts below too!
Disclosure: I am part of Trade Nation's Influencer program and receive a monthly fee for using their TradingView charts in my analysis.


CAD_JPY BULLISH BIAS|LONG|
✅CAD_JPY is trading along
The rising support
And as the pair will soon retest it
I am expecting the price to go up
To retest the supply levels
Above at 108.708
LONG🚀
✅Like and subscribe to never miss a new idea!✅
Disclosure: I am part of Trade Nation's Influencer program and receive a monthly fee for using their TradingView charts in my analysis.

EUR-AUD Strong Uptrend! Buy!
Hello, Traders!
EUR-AUD is trading along
The rising support line in a
Strong uptrend so we we are
Bullish biased and as the pair
Is going down to retest the
Support we will be expecting
A rebound and a move up
Buy!
Comment and subscribe to help us grow!
Check out other forecasts below too!
Disclosure: I am part of Trade Nation's Influencer program and receive a monthly fee for using their TradingView charts in my analysis.

EUR_NZD LONG FROM RISING SUPPORT|
✅EUR_NZD is trading in an uptrend
Along the rising support line
Which makes me bullish biased
And the pair is about to retest the rising support
Thus, a rebound and a move up is expected
With the target of retesting the level above at 1.9544
LONG🚀
✅Like and subscribe to never miss a new idea!✅
Disclosure: I am part of Trade Nation's Influencer program and receive a monthly fee for using their TradingView charts in my analysis.

USD-JPY Will Keep Growing! Buy!
Hello,Traders!
USD-JPY is trading in an
Uptrend along the rising
Support line and the pair
Already made a bullish
Rebound and is consolidating
In a local range so as we
Are bullish biased we will
Be expecting a further
Bullish move up
Buy!
Comment and subscribe to help us grow!
Check out other forecasts below too!
Disclosure: I am part of Trade Nation's Influencer program and receive a monthly fee for using their TradingView charts in my analysis.

CRUDE OIL BEARISH BREAKOUT|SHORT|
✅CRUDE OIL broke the rising
Support line which is now a resistance
And the price made a retest an a pullback
So we we are bearish biased and we
Will be expecting a further
Bearish move down
SHORT🔥
✅Like and subscribe to never miss a new idea!✅
Disclosure: I am part of Trade Nation's Influencer program and receive a monthly fee for using their TradingView charts in my analysis.

NZD-USD Will Go Down! Sell!
Hello,Traders!
NZD-USD already made a retest
Of the horizontal resistance
Of 0.5992 from where we
Are seeing a bearish reaction
And we will be expecting a
Further bearish move down
Sell!
Comment and subscribe to help us grow!
Check out other forecasts below too!
Disclosure: I am part of Trade Nation's Influencer program and receive a monthly fee for using their TradingView charts in my analysis.

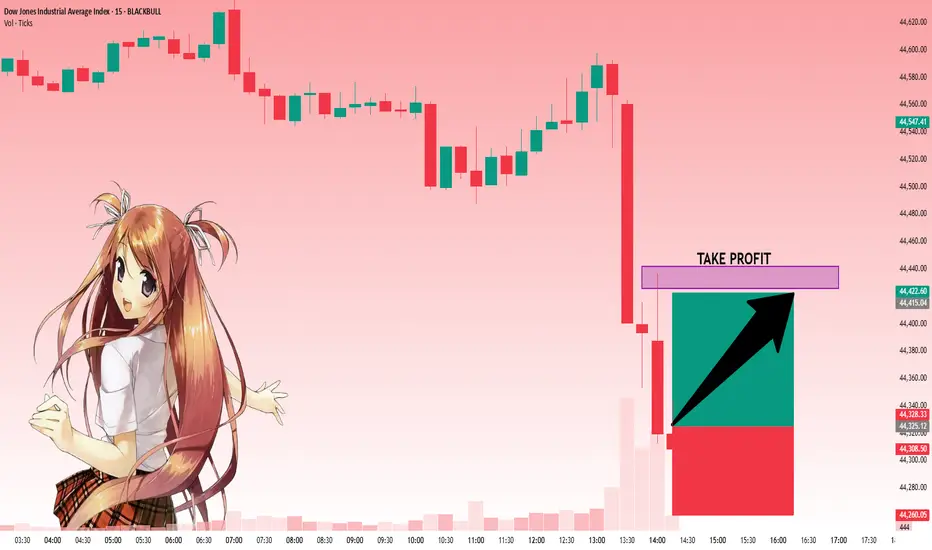
US30: Move Up Expected! Long!
My dear friends,
Today we will analyse US30 together☺️
The price is near a wide key level
and the pair is approaching a significant decision level of 44,325.14 Therefore, a strong bullish reaction here could determine the next move up.We will watch for a confirmation candle, and then target the next key level of 44,425.56.Recommend Stop-loss is beyond the current level.
❤️Sending you lots of Love and Hugs❤️
GOLD: Local Bearish Bias! Short!
My dear friends,
Today we will analyse GOLD together☺️
The recent price action suggests a shift in mid-term momentum. A break below the current local range around 3,358.13 will confirm the new direction downwards with the target being the next key level of 3,349.76.and a reconvened placement of a stop-loss beyond the range.
❤️Sending you lots of Love and Hugs❤️

SILVER: Strong Bullish Sentiment! Long!
My dear friends,
Today we will analyse SILVER together☺️
The in-trend continuation seems likely as the current long-term trend appears to be strong, and price is holding above a key level of 38.281 So a bullish continuation seems plausible, targeting the next high. We should enter on confirmation, and place a stop-loss beyond the recent swing level.
❤️Sending you lots of Love and Hugs❤️

EURUSD: Bears Are Winning! Short!
My dear friends,
Today we will analyse EURUSD together☺️
The market is at an inflection zone and price has now reached an area around 1.16557 where previous reversals or breakouts have occurred.And a price reaction that we are seeing on multiple timeframes here could signal the next move down so we can enter on confirmation, and target the next key level of 1.16419..Stop-loss is recommended beyond the inflection zone.
❤️Sending you lots of Love and Hugs❤️

Wave structure of GRT coin in week time frame- Week is swing bullish => current is pullback.
- Day is swing bullish => current is pullback.
- We can look for buying opportunities when there is a reversal signal on the 4-hour time frame or the price reaches the demand zone of the daily frame.

BTC wave structure analysis on 4 hour and daily timeframe- Daily time frame, after price gave stop hunting signal, price increased again.
- On the 4-hour time frame, the price broke through the strong peak and gave a bullish reversal signal.
- So there is a high possibility that BTC will continue to rise and break the previous top.

AUD-NZD Rebound Expected! Buy!
Hello,Traders!
AUD-NZD is making a retest
Of the horizontal support
Level of 1.0909 and as the
Pair is trading in an uptrend
We will be expecting a
Local bullish rebound
Buy!
Comment and subscribe to help us grow!
Check out other forecasts below too!
Disclosure: I am part of Trade Nation's Influencer program and receive a monthly fee for using their TradingView charts in my analysis.

NZD_USD POTENTIAL SHORT|
✅NZD_USD is going up to retest
A horizontal resistance of 0.5990
Which makes me locally bearish biased
And I think that we will see a pullback
And a move down from the level
Towards the target below at 0.5947
SHORT🔥
✅Like and subscribe to never miss a new idea!✅
Disclosure: I am part of Trade Nation's Influencer program and receive a monthly fee for using their TradingView charts in my analysis.

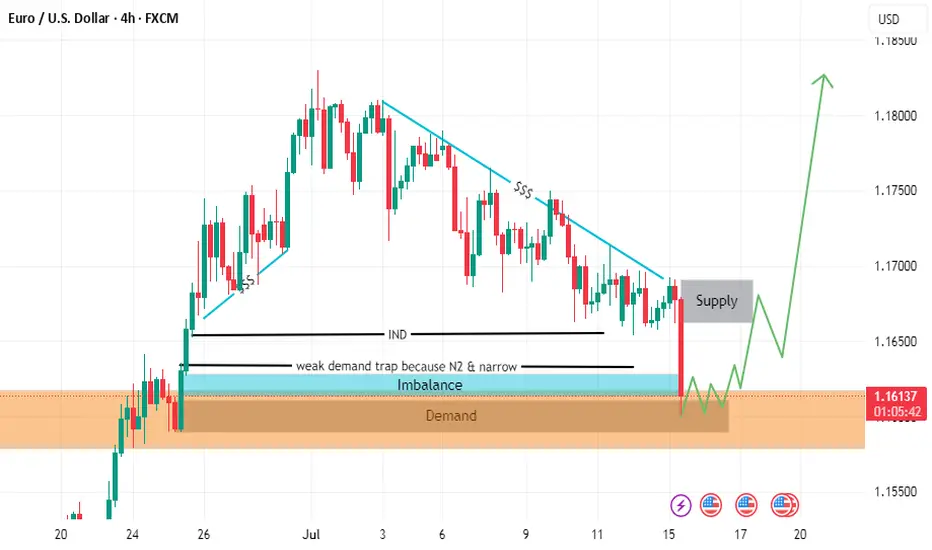
EURUSD long Lion SETUPhello everyone
the price is in a strong demand area
as liquidity has been withdrawn
and the fair value gap has been filled
but we are waiting for formation pattern on a smaller frame in order to enter an upward wave.
we also have resistance area
so in short. I expect an upside go upppp