The wave structure of EURUSD is analyzed using the SMC methodDay Swing is bearish => current is internal bullish
4H Swing is bullish => current is internal bearish
M15 Swing is bearish => current swing is CHoCH
In the 15-minute time frame, the price broke the strong swinghigh peak and showed a reversal signal.
so we have:
M15 is trending up
4H is an uptrend
So the price increased again and broke the weak Swing High of 4H
Smcanalysis

EURUSD is almost ready to turn bullish again.On the the higher timeframes (W and D) EU is already bullish.
For past few days price was bearish on lower timeframes as it was retracing to grab the sell side liquidity to fuel the move to the up side.
Right now price is inside of daily discount and just above the daily imbalance ,today is news as well.
So, if the market reacted to the imbalance and gave signs of possible continuation, we can look for long entries.
Other wise we can expect a deeper push into the daily order block
Hey traders!
I'm back after a break, ready to share fresh analyses. Follow for updates, and if you find my content valuable, show some love with a thumbs up!
Happy trading.

AUDUSD ShortAUDUSD Is Bearish On 4H TF As SMC Structure. Price Sweep The Liquidity On 1H TF, And Mitigate The 1H LQGC So we Got Confirmation On 5min TF.

EURGBP ShortEURGBP Short Bu SMC Structure On HFT. Price On Bearish Mood, So we Trade The Trend Wave.

GBPUSD ShortGBPUSD Is BUllish On 4H HTF By {SMC} Structure, But I'M Shorting Cause The 1H And M15 Is Bearish So I wanna Trade The Internal Structure.


Wave structure of DXY in time frame M15, 4HDay uptrend -> pullback is bearish
4H dowtrend -> pullback is bearish
M15 Uptrend-> current is bullish
The price increased and broke through the strong swing high, so in the M15 time frame it turned into an uptrend
life cycle of the wave structure
Day is uptrend => 4H is dowtrend => M15 is uptrend => 4H is uptrend => Day Uptrend

The wave structure of BTC is at 15m time frameBTC wave structure at 15m time frame
The current price goes into strong swinghigh and weak swinglow.
We can sell the powerful swinglow candle of the 5M time frame that is broken through and then the wave at the 5M time frame turns into a downtrend

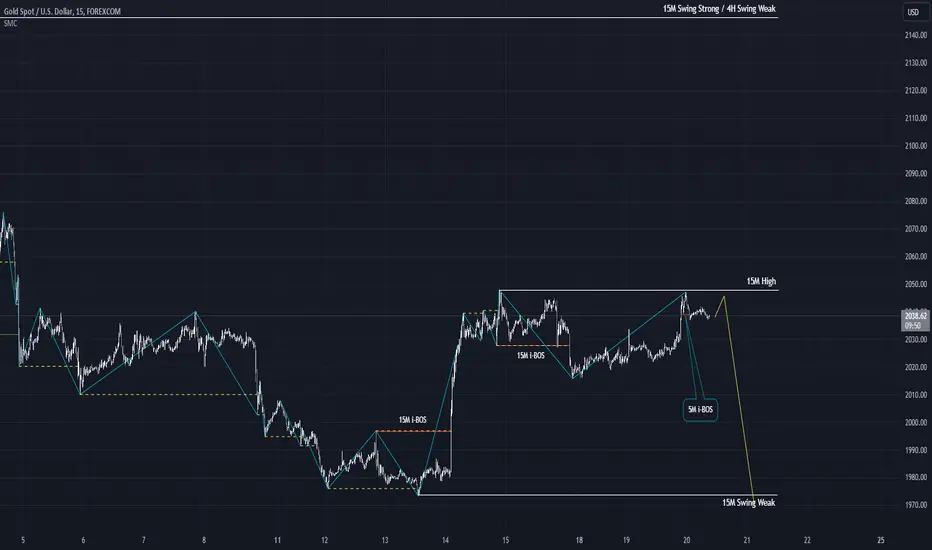
Wave structure of XAUUSD in time frame M15DAY is uptrend => current is impulse
4H uptrend => curent is internal bullish
M15 is dowtrend => current is internal bearish
The price fell and penetrated the i-Swing (Internal Swing) strongly so the internal rising wave ended.
We can find opportunities to sell down when prices rise again

Wave structure of XAUUSD at 15M timeframeThe 15 minute time frame is trending down
Currently it is an internal wave.
We watch the structure develop, can only look for sell-off opportunities when the strong i-Swing bottom is broken

Wave structure of AUDUSD in 15M, 4H time frame4H is uptrend => current is impulse
15M is uptrend -> current is impulse
The current price is in the supply zone of the daily time frame, so there is a high possibility of a pullback wave of the 4H frame.
We wait for the wave structure to develop and give the CHOCH breakout signal

Up to +100%, let's take a look at this analysisGood morning investor, after a reaction in the extreme overbought zone (OB), we've seen a positive response.
We might be heading towards the previous high and potentially gain up to +100%

Wave structure of GBPUSD in 15M, 4H time frameWave structure of GPBUSD in time frame 15M, 4H
We let the structure continue to develop
We can only look for selling opportunities when the strong swing is broken through.

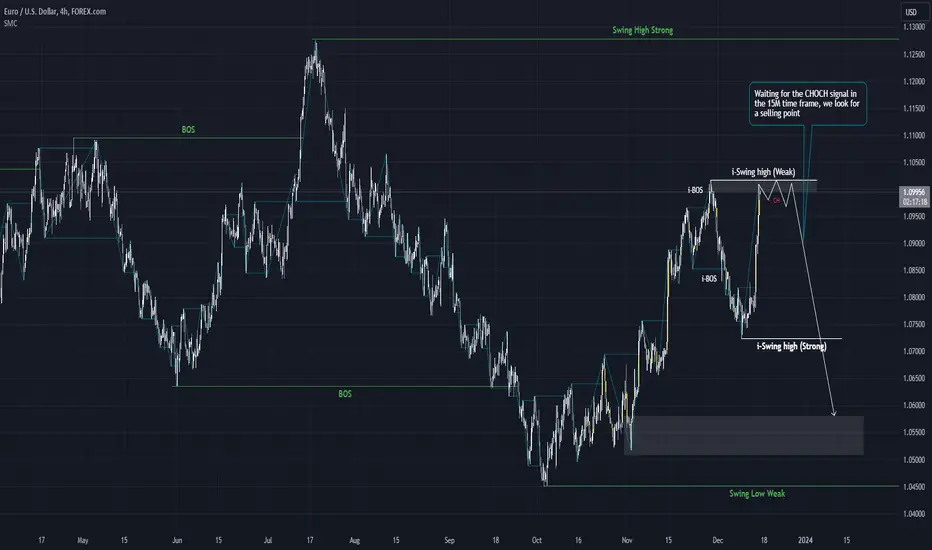
Wave structure of EURUSD in 4H time frameDay is dowtrend => current is correction
4H is uptrend => current is impulse
15M is uptrend => current is correction
Currently, in the 15M time frame there is a CHOCH signal, there is a high possibility that the wave in the 4H frame will have a pullback wave.

Wave structure of XAUUSD in 4H, 15M, 5M time frames4H is uptrend => current is correction
15M is dowtrend => current is conrrection
5M is uptrend => current is correction
If the 5M time frame breaks the strong Swing, then we will look for an opportunity to sell down

Wave structure of DXY analyzed in multiple time framesDay uptrend -> correction
4H dowtrend -> impulse
5M/15M dowtrend -> impulse
We can only buy when the strong swing of the 5M time frame is broken

Wave structure of XAUUSD analyzed in multiple time frames4H is uptrend => current is correction
15M is dowtrend => current is conrrection
5M is uptrend => current impulse
We can only sell down when the Swinglow of the 5M time frame is broken through

XAUUSD wave structure in 15M timeframe- 4H time frame uptrend
- 15M time frame downtrend => currently pullback up
- 5M time frame downtrend => current pullback up
- The price dropped and broke through the bottom of 5M, creating an i-BOS signal signaling the end of the pullback wave of 5M.
- The 15M and 5M time frames end the pullback wave, with a high possibility that the price will fall to the weak swinglow of the 15M time frame.
EURUSD waves in the 4H timeframe are analyzed using SMCThe wave of the 4H time frame is in a downtrend
The current wave is a pullback wave
Waiting for the 15m wave to end, we look for a selling point
Flips That Sweep LiquidityREACTION SWEEP
Flip create + sweeps high
REACTION EQLs SWEEP
Flip crates + sweeps equal highs
FLIP SWEEPS PRIOR LEG
Flip sweeps high in prior leg
FLIP GETS SWEPT
Intial Flip reaction gets swept

GBPUSD → 4H Bullish Continuation SETUP (SMC ANALYSIS)We are closely monitoring a potential buying opportunity around the POI zones.

Wave structure of DXY at 4H time frameDay uptrend -> pullback dow
4H dowtrend -> pullback up
15m dowtrend -> pullback up
If the 15M, 4H time frame changes to an uptrend, the price will increase sharply to the Swinghigh level of the daily frame.

High & Low Resistance LiquidityLOW RESISTANCCE LQ
1.No liqidation
Available SSLQ generated at weak low = low resistance lQ
2. Price is more likely to pullback to the nearest POI
3. high resistance LQ left at new strong high
4. price will move impulsively past low resistance lows to target available SSLQ
HIGH RESISTANCCE LQ
1. Strong liquidation
Signals potential institutional backing
Leaves high resistance LQ
2. Often price will then pull back much deeper (or potentially reverse)
3. The end of the pullback often forms through a liquidation, leaving high resistance LQ at what then becomes the new strong / protected high
4. Price meets some resistance at the sweep zone to the left rather than smashing straight through the weak lows when there's low resistance LQ
