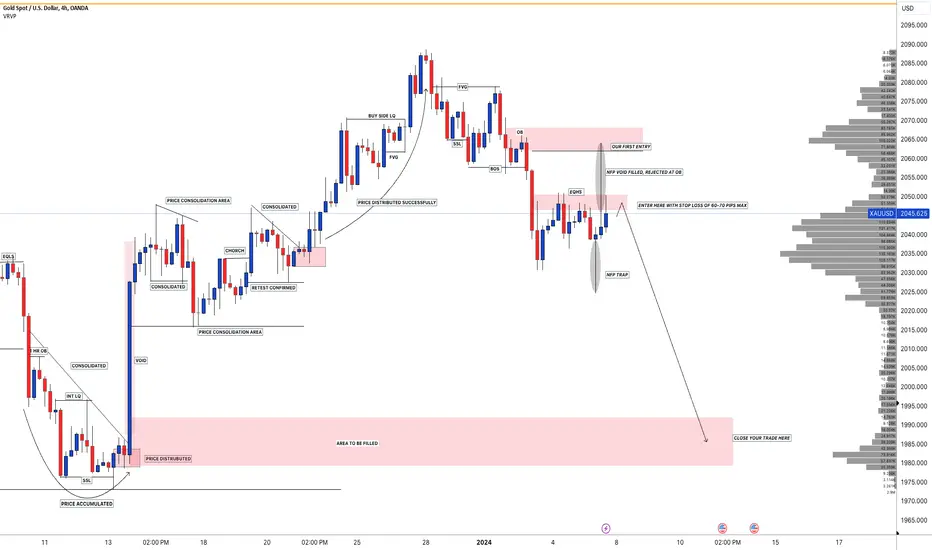
XAUUSD: Is Bull Run Over? Dear Traders,
Hope you are doing great, our last trading idea on Gold turned out to be successful, now there is huge potential of selling Gold for quick 300-400 pips move. There are two area where we can sell big, the first one is currently, and second zone is rejection at 2060-67 area.
Stop loss can be placed around 2057 for first entry and for the second entry place stop loss around 2075. Take profit will be at the identified area.
Good Luck and Trade Safe.
Smcconcepts

XAUUSD: Imbalance filled, What next?$1990 area had to be filled, we previously had identified this 'imbalance level' and have been waiting for price to fill the area so that we can have a clear view. Since price have filled the area. Now we can see price going towards 2020 and then 2050 only if DXY remain week and other economic data support Gold to rise. In other case, price can drop to 1900$ and rebound from there. We will have to wait and see how prices behave.
Good luck and trade safe!

Analyze EURUSD in the M15 timeframe using the SMC method4H swing is down trend => current is pullback up
15M swing is uptrend => current is pullback dow
We look for selling opportunities when the price exceeds the Swing Strong bottom of the M15 time frame

Analyze GBPJPY in the M15 timeframe using the SMC methodDay swing is uptrend => current is pullback dow
4H swing is uptrend => current is pullback dow
15M swing is dowtrend => current is pullbakc up

XAUUSD Bullish idea. Same setup as the previous trade. Fundamental is on our side, going against the dollar. Short term trading idea

Preferforex Analysis on GBPJPYGBPJPY is in bullish bias. According to the higher time frame like daily or 4 hour, the pair is in uptrend. Now the pair is retracing bearish to have some liquidity and to mitigated the nearest imbalance. Expecting further bullish movement targeting recent swing high.

AUDCAD, where is AUD headedthinking of longs with AUD fundamentals leaning towards buys the technicals have never been clearer

PreferForex Analysis on CADCHFCADCHF is in Bullish bias according to the higher time frame. Now it is heading toward a short term POI. Expecting further bullish after taping on the POI

EURJPY: Possible Swing Selling Opportunity!Dear traders,
EURJPY recently has been overbought, and price is currently at the crucial level. There are two possible swing entries which can be utilised properly. JPY plummet to lowest, making it one of the worst performing currency on currencies index. Take sell entry with accurate risk management, no more than 80 pips in stop loss. If first entry fails, take second entry. We are now focusing on both of these area for swing selling. 400 to 800 pips in take profit.
Good Luck.

Long setup: Day Trading Strategy for EURUSD📈💰 Day Trading Strategy for EURUSD 💱
🔥 ICT Long Setup 🔥
Today, let's dive into an exciting day trading strategy for EURUSD! 🚀💹
Here are the key levels and setups to watch out for: 📊📈
⬆️ Buy Limit Levels:
🎯 1.0803
🎯 1.0797
🎯 1.0730
🎯 Take Profits:
TP1: 1.0816
TP2: 1.0824
🔑 Key Level - Resistance:
💪 1.0818
🔑 Key Level - Support:
🛡️ 1.0803
❌ Stop Loss:
🛑 1.0780
💡 Trading Insights:
The ICT Long Setup on EURUSD presents an opportunity for potential gains. The buy limit levels of 1.0803, 1.0797, and 1.0730 serve as entry points to enter the market. By setting take profit levels at 1.0816 and 1.0824, we aim to secure profits if the trade goes in our favor.
However, it's important to keep an eye on the key level of resistance at 1.0818, as it may act as a hurdle. On the downside, the key support level at 1.0803 provides a safety net.
To manage risk, it's crucial to set a stop loss at 1.0780, ensuring that potential losses are controlled.
Remember, always analyze the market carefully and adapt your strategy to changing conditions. Happy trading! 💪💹📈
#EURUSD #DayTrading #ICTStrategy #ForexTrading 🌍💱

EURUSD longs to take out 4H BSLQEXPECTATION: EURUSD on the 4H has made an iBOS. After an internal BOS we expect an internal pullback. There was no 4H supply mitigation, so I am expecting the BSLQ to get swept first, to then facilitate the pullback into 4H demand.

USDCHF Analysis of PreferForexUSDCHF is in Bullish market Structure. It is now in retracing movement. Expecting the continuation of bullish moment after taping into the POI

EURNZD Analysis of PreferForexEURNZD is heading towards the POI. It moves down by collecting the liquidity and finally it is in the bottom of the swing point.

Preferforex Analysis on USDCADUSDCAD is heading toward the bottom of the recent swing point. We will observe the price when it tap on the POI, expected a bullish move from the POI

EURUSDWaiting for the next leg of price to go short on EURUSD. There might be a bounce on 1.07440 to continue the sell. But overall that might form a liquidity to get early sellers in the market.

GOLD: $1983 is possible next target | what do you all think?OANDA:XAUUSD Price rejected at 2064$ key level, and in our previous chart we had identified the same key level from which price could reject. Now the after effect of the NFP data price rose sharply as DXY plummeted. Expecting DXY to be bullish we think price of GOLD will start ranging from $2040 to $1980 next week. Our entry can become valid once market settle down in Asian Session. Then target in London Session if price show bearish sign take entry and set take profit at 2020$ first and 2000$ second and final entry should be at 1990$
Good Luck and Trade Safe.
GBPJPY wave structure at 4H, 15M timeframeDay is uptrend => current is correction
4H is uptrend => current is correction
15M is dowtrend
Current price is in the demand zone of the 4H, Daily time frame.
There is a high possibility that the price will increase again.
To confirm the price increase again, we wait for the price to surpass the strong swing top of the 15M time frame

Wave structure of AUDUSD in time frame M15HAPPY NEW YEAR!
4H is uptrend => current is internal bearish
M15 is uptrend => Currently it is breaking through a strong low swing and turning into a downtrend
We can sell down to the Order block of the 4H time frame

EURUSD: Upcoming big swing selling opportunity!Dear Traders,
As we have news today and tomorrow we think price of EURUSD will fill up the liquidity void area before going down any further. Therefore, our entry will be around that reason if news spikes up and create a strong wick. Once price comes to our area of entry we can enter sell entry.

GBPAUD swing buy ideaFX:GBPAUD thinking of buys, the structure on the daily is bullish after sweeping liquidity, we also created bullish structure on the 4H tf and reacted off a 4H zone, looking to set limits now

GBPUSD where are we headedUSD is not really clear and with cpi and also GBP cpi this week we could be on a bumpy road on GU but i do expect some form of bullish p.a this week looking at a few zones

NZDCAD: 700+ Pips Swing Buying Opportunity!Dear Traders,
NZDCAD is 700 pips buying opportunity, price breakthrough and changed the character, since then price consolidated and then manipulated. We still expect price to drop till 0.8100 and reject from that area. Please give some time for setup idea to become active

XAUUSD: Possible Bullish Move Up Until $2080?Dear Traders,
Gold has not made any significant move yet to decide whether it is in bearish trend or bullish. This has confused many traders to decide the future direction of the Gold. Price have dropped and bounced back and made the similar pattern like last time when it created lower low and then bounced. In our buying bias, we think price will continue the bullish momentum for now up until 2080$ which remain a vital point. If price do decide to go other way we want you all not to take further trades until you see a clear sign. Gold has been tricky and tough to trade with.
Good Luck and Trade Safe!
