EURUSD Weak upcoming fundamentals on the US side. I believe this setup would be a great reversal idea for the short term.
#bullish #EURUSD #bullishfallingwedge #technicalanalysis #fundamentalanalysis #SMC
Smctrading

🌟📈 Exciting Trading Insights for HK50! 💼💹Get ready for some thrilling opportunities as we dive into the market dynamics of HK50! Let's explore the charts, analyze the trends, and uncover potential pathways for profitable trades. 🚀💰
📈 Higher Timeframe Trend:
Zooming out to the higher timeframes (H4 or above), we observe a clear trend in HK50. This sets the stage for exciting possibilities and potential gains. Let's ride the trend! 📈📊
🔍🔄 Double Bottom Formation:
In the H1 chart, we anticipate HK50 to form a double bottom pattern, as indicated. This pattern suggests a potential trend reversal and can provide excellent entry opportunities. Keep a close watch! 👀🔄
⚡️💼 Supply Zone at 16330:
Our analysis reveals a small but significant Supply Zone at 16330. Today's breakdown of this level serves as a Launchpad for potential upward movement. Brace yourself for a bullish breakthrough! 🚀💼
🔮📉📈 Forecast Path:
Let's map out the potential path for HK50's future movements:
1️⃣ Hit Supply Zone 16330:
The first step is for HK50 to reach the Supply Zone at 16330. This level acts as a crucial milestone to watch out for. Prepare for potential price reactions and exciting trading opportunities! 🎯📉
2️⃣ Retest and Lower Low Formation:
Following the initial hit, we anticipate a retest above 16150, accompanied by the formation of a lower low. This scenario may exhibit indicators such as MACD divergence, providing insightful signals for traders. Stay sharp! 🔄📉
3️⃣ Fast Move to 16480:
Our forecast suggests a rapid upward move to 16480, potentially occurring on Friday afternoon or next Monday. This surge presents an excellent chance to capitalize on favorable market conditions. Get ready for action! ⚡️📈💪
Embrace the excitement, stay informed, and adapt to the evolving market conditions. Remember, thorough analysis and risk management are key to successful trading. Let's make the most of HK50's potential and aim for profitable trades! 💪💼💹
#HK50 #TradingInsights #DoubleBottomFormation #SupplyZone #ForecastPath 🌍💱

Wave structure of XAUUSD on 15 minute timeframeAfter breaking the peak of M15, the price dropped again and the candlestick pile created a peak.
We buy when the price drops and surpasses IDM. Wait for CHOCH signal on time frame M1

GBPJPY Analysis of PreferForexGBPJPY has a bullish bias on the higher time frame. It is currently retracing and collecting liquidity, and is now at the point of interest (POI) and starting to react. There is an expectation of bullish continuation from this POI.

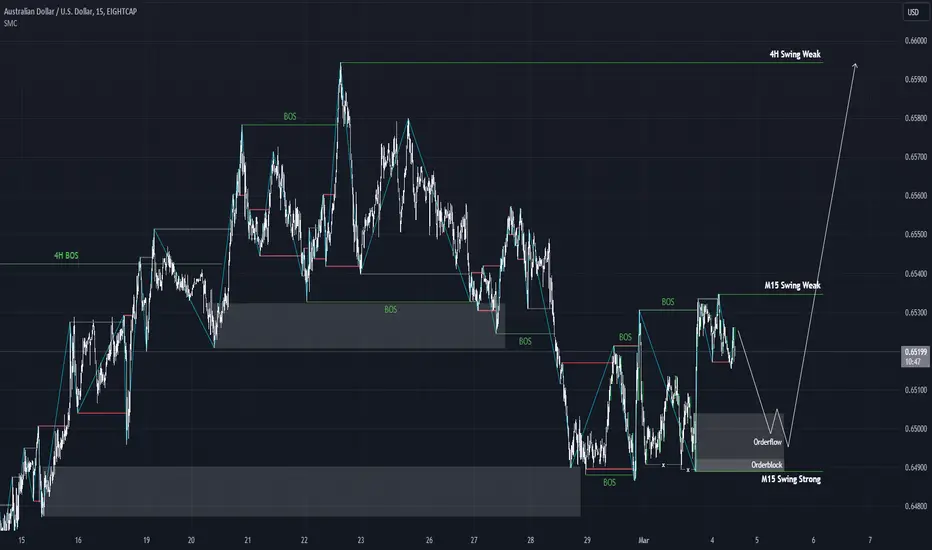
Analyze AUDUSD in the M15 timeframe AS SMC4H is swing bullish => current is pullback dow
M15 is swing bearish => current is CHoCH up
When the price drops Orderflow is where we look for buying opportunities
#EURNZD:First Two Entries Hit Targets What you think about this?FX:EURNZD first two entries hit our targets successfully, now we are focusing on the third entry, price rejected at the key level, where we think most of the major selling orders were placed. Currently, in our price had left behind big 'liquidity void area' due to that reason. In our view, price is likely to fill those area and then bounce back from our 'third entry'. We are targeting same 300-400 pips this time around too. Which will helps us gathering over 1200 pips from three ideas.
Let me know what do you think about EURNZD? Please share your views too.

GBPNZD BULLISH RUN????Creating bullish structure on the daily and 4H, we have buyside liquidity above and a clear high that needs to be taken, using ltf confirmation we could see serious bullish moves to the upside

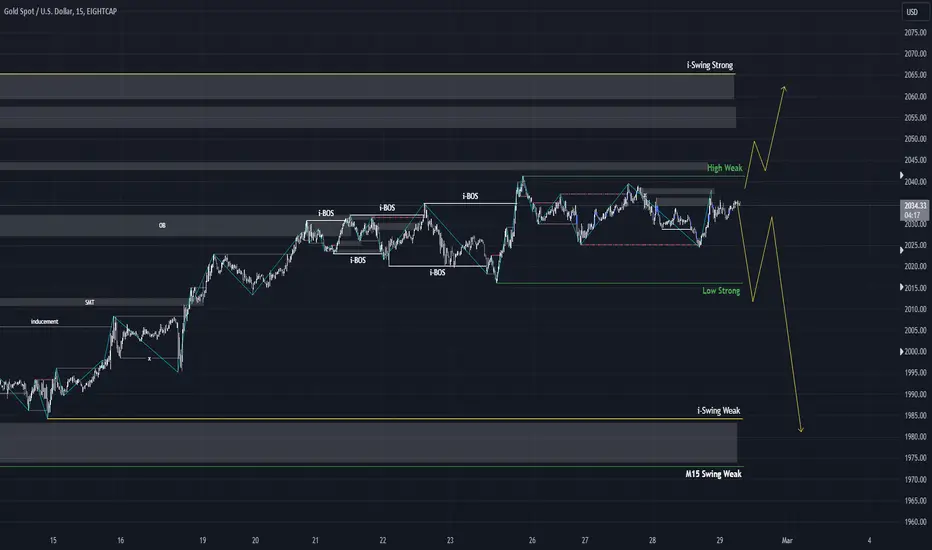
Analyze XAUUSD in the M15 timeframe using the SMC methodM15 swing is bearish
M15 internal swing is bearish => current is pullback up.
We sell when the internal wave breaks through "Low Strong"
GBPUSD wave structure at 4-hour timeframeThe Swing structure is bullish => the internal structure is bearish
If the price increases and breaks through the HighStrong peak, the internal structure changes to bullish, at which point the price continues to increase and break the Swing Strong peak.

BTC wave structure in 4H time frame4H is bullish => internal is bearish
M15 is bearish
We will only buy when M15 turns bullish

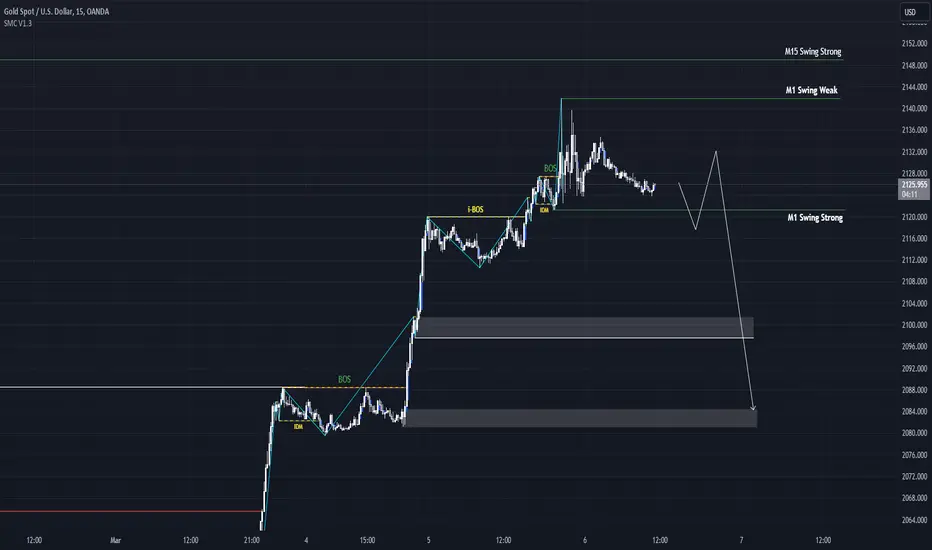
Swing wave structure of XAUUSD in time frames M15 and M1If the price drops and breaks through the Strong Swing of the M1 time frame, M1 gives a decreasing CHoCH signal.
At this time, we will look for opportunities to sell down when the price increases again.
US30 BEARISH IDEA This is just another sell idea ( yellow arrow ) following our entry ( previous post ) which is risk free and running at around 175 pips !!
Technical remains a strong bearish view --> expecting a break of structure very soon
Main target is the ( 4H ) demand zone !
Trade only during N-Y session and only if price is in the rectangle
KEEP FOLLOWING IF YOU WOULD LIKE MORE PRECISION TRADES ( 1 : 7 ) - ( 1 : 10 ) !!

EURUSD LONGHere is a bigger picture of what i see for EURUSD. So even when i want to take a long, is till see a more potential zone below. We can only act by what price presents. So the long from 1.08470 it is for me until otherwise.
See the comment for 5min entry criteria.

CADJPYI already got my entry here at 110.756. I am looking to re-enter at 110.692 while i take partials at 110.520 and hold running till 110.134.
Check comment for 5min for entry criteria.

the importance of InducementLots of Smart Money Traders usually trade Based on Structure and Order Block but in Reality Order Block is Not SMC . Order Block just additional Confirmation for buy or sell . when you look any order Block then dont trade blindly you have to wait for inducement or Liquidity sweep Clear Confirmation before buy sell on Order block . Let see how it work

CADCHF SHORTEven though we have a high probability chance of going short from this zone at 0.65280. We have seen how price has decided to deliver price bearish. On this zone on the 5Min, price has already mitigated the Demand zone and its set to go bearish from my analysis. See where you come in and trail stop loss when it breaks through 0.64930 for the potential target at 0.64704

GBPCADIf i see a clean shift at this imbalance zone of 1.71920 on the 15M, then i will look to sell price or else i will wait for the 1.72124 and get on a sell once i get a shit in market structure bearish.

AUDCADAnother sell opportunity for AUDCAD. Trail SL once it breaks below 0.88373 and lets follow price for this potential short till 0.88060. Cheers.

AUDUSD SHORTHere is my analysis for AUDUSD for a potential short to 0.64906 for a 1:7 profit target with a 5 pips SL. Cheers.

Analyzing the wave structure on the 4-hour time frame of BTC usiTime frame 4h, day turned bullish. Btc will have a pullback phase then continue to increase to break the previous peak

Analyze EURUSD in the M15 timeframe AS SMC1. Sweep of the internal low
Swing is still bullish so buy are Phase B
2. Clear POI at the extreme of the range
Sell are Phase C
But we failed to close below the the internal low so this high is potentially weak

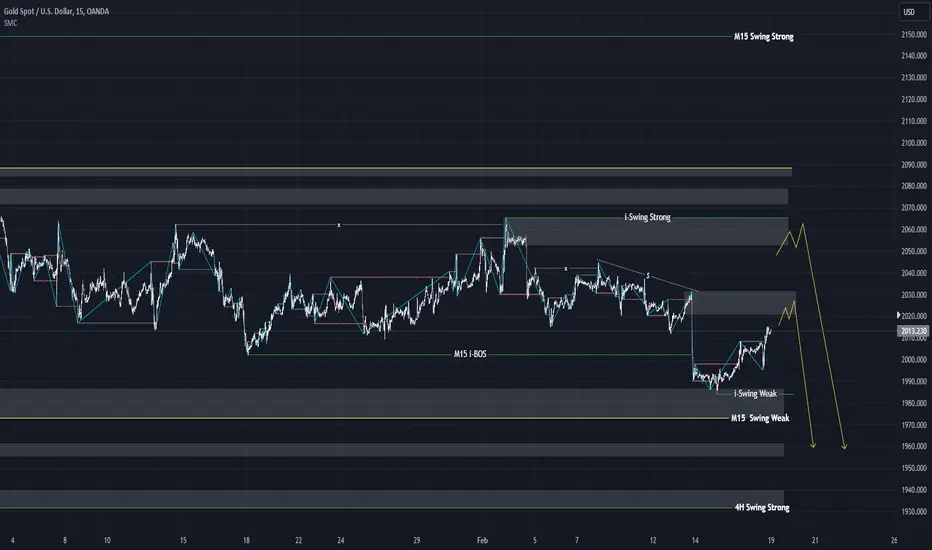
Analyze XAUUSD in the M15 timeframe using the SMC methodAnalysis of XAUUSD in the M15 timeframe using the SMC method
4H is bullish => currently is pullback dow
M15 is bearish => currently pullback up
We sell down when we reach the order block
Current GBP/JPY TradeRight now I am in a long GJ trade. The reason for this trade was the liquidity that was created with a bearish push towards a higher time frame demand order block. Additionally, a few more imbalances were created with the same bearish push. Once price reacted from the higher time frame OB i waited for a CHoCH and found my 5M TF OB from which i took longs from. Price hovered above and below entry before finally pushing towards the upside. I have already exited with one trade, and have another running, which i will hold towards the first imbalance.
