XAUUSD Sideway in Price range?Long entry: 3280 - 3290
SL: 3273
TP: Daily Open Price, 1.5R:R
Short entry: Supply Zone or Caution message
SL: 3360, Upper Swing
TP: Lower Low, 2 R:R
Smctrading

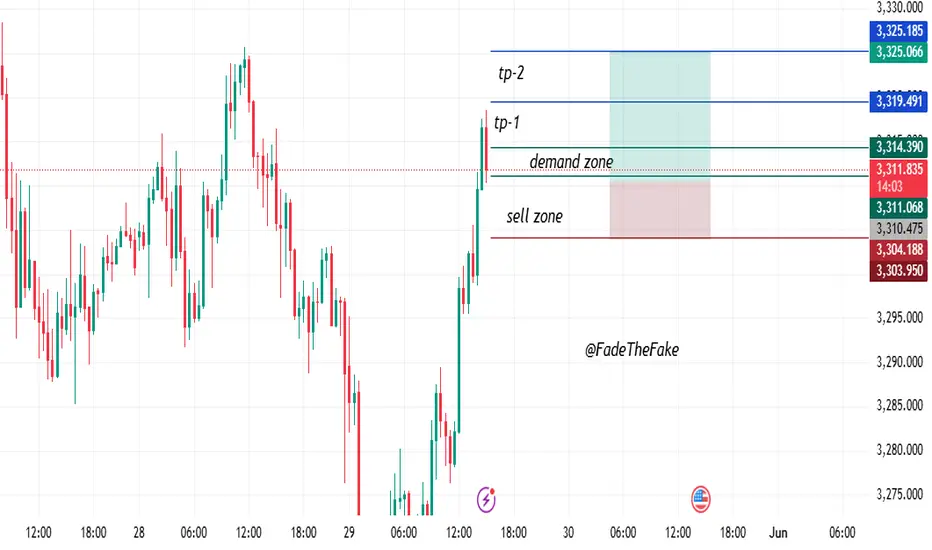
“Clean SMC Buy Setup | Retest & Rally from Demand Zone”This chart shows a clean Smart Money Concept (SMC) style buy-side setup, targeting a highly respected demand zone and high-odds liquidity grab above.
Following a steep bullish impulse, price formed a new market structure shift (BOS) and is now retracing into a crucial entry zone at 3,314.00 – 3,311.50. This area is marked by a hidden order block and imbalance, with high R:R opportunities for buyers.
The stop loss is judiciously set below the latest wick at 3,304.40, safeguarding against manipulation while having the best risk exposure.
The target one (TP1) is at 3,319.70, corresponding to intraday liquidity and recent supply reaction. The second target (TP2) goes up to 3,325.90, a major high where external liquidity would most likely be absorbed before any major change.
This is on the basis of:
A confirmed bullish BOS
Demand zone + OB alignment
Imbalance + inducement layer barely underneath the entry
No indication of bearish turn yet
We expect retest of demand and a move on to liquidity, given the zone is sustained and no bearish BOS is witnessed.
???? Trade Parameters:
Entry Zone: 3,314.00 – 3,311.50
SL: 3,304.40 (below OB)
TP1: 3,319.70
TP2: 3,325.90
Bias: Bullish (scalp-to-swing)
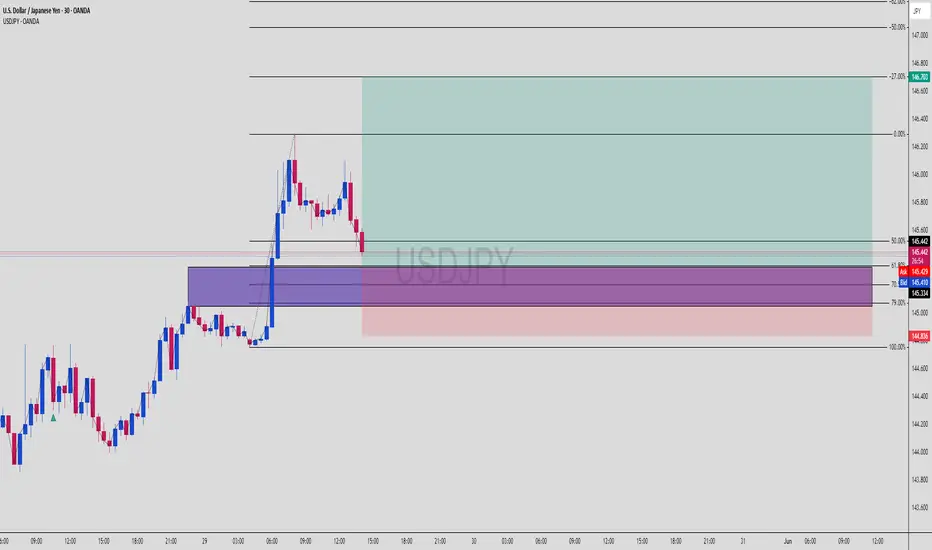
USDJPY SMC Play | Order Block + Fibo 61.8 = Precision EntryUSDJPY | Confluence Entry in Motion 🚀
A beautifully aligned setup using Smart Money Concepts, with a clear entry mapped out at the OB + Fib 61.8% retracement zone. Price just tapped into the purple zone — now it’s all eyes on bullish momentum confirmation.
📊 1. Market Overview
USDJPY has been trending bullish, with a strong impulsive move followed by a retracement — price is now sitting at a key decision zone.
The zone is a refined bullish Order Block (purple) aligning perfectly with:
✅ 61.8% Fibonacci retracement
✅ 70.5% golden zone
✅ Strong imbalance below
We’re seeing a beautiful reaction candle off this area as price hunts liquidity.
🧠 2. Why This Trade Makes Sense (SMC Breakdown)
Here’s the logic:
Price broke structure to the upside
Pullback into OB + discounted pricing
Clean liquidity sweep just beneath the short-term low
Room for continuation toward higher timeframe POI (top green zone)
This is a textbook SMC + Fibonacci sniper setup.
🎯 3. Entry Zone (Purple Box)
📍 OB Zone: 145.200 – 145.334
🧮 Fib Levels:
— 50%: 145.595
— 61.8%: 145.334
— 70.5%: ~145.200
— 100% (SL): 144.836
Your entry's beautifully layered with confluences = 🔥 Risk/Reward.
🚀 4. Target Zones
🟢 TP1: 146.000
🟢 TP2: 146.703
(TOP of the Fibonacci extension, completing the full bullish leg)
⚖️ 5. Risk-Reward Setup
✅ SL: 144.836
✅ Entry: around 145.334
✅ TP: 146.703
👉 RRR: Over 1:4 — institutional grade 🔥
🛡️ 6. Trade Management Tips
✅ Wait for bullish engulfing or LTF break of structure for confirmation
🕰️ Drop to M15 for precise sniper confirmation entry
🔄 If it taps again with more imbalance left = re-entry possible
📌 Save this if you love high confluence entries
🔥 Drop “SMC Sniper” in the comments if you're watching this pair
👀 Follow for daily setups just like this — clean, confident, and calculated
GBPUSD Decision Point | Will the Order Block Hold or Fold?GBPUSD | Smart Money Liquidity Trap or Bullish Breakout?
Here’s a high-probability play based on Order Blocks, Fair Value Gaps, and channel structure—one of the cleanest SMC setups on cable this week.
📊 1. Market Overview
GBPUSD is currently pulling back after a sharp drop, retesting the premium zone Order Block on the H1 timeframe.
Structure remains bullish inside the ascending channel, but there’s major indecision here—will it break above the OB, or retrace deeper into the Fair Value Gap zone?
🧠 2. Dual Bias Logic
You’ve mapped out two valid SMC scenarios (marked in red & blue arrows):
🔻 Scenario 1: Bearish Trap + Deep Liquidity Grab
Price reacts from the Order Block (purple zone)
Rejects and breaks down into the Fair Value Gap (FVG) zone near 1.33300
Targets liquidity resting below prior structure
🔺 Scenario 2: Order Block Respect + Long Continuation
OB holds, price flips bullish
Pushes above 1.35260 for bullish continuation
Final target near channel top @ 1.35920–1.36000 zone
Both scenarios are textbook Smart Money setups — based on how price reacts at this OB, we’ll get the direction.
🧱 3. Key Zones
🔵 Order Block: 1.3445 – 1.3526
🔴 Fair Value Gap (FVG): 1.3330 – 1.3283
🟢 Target (Bullish): 1.3600
🔻 Target (Bearish): 1.3280
⚖️ 4. Risk-Reward Potential
Whether you go long from the FVG or short from the OB, both have:
✅ Clean entries
✅ Clear invalidation zones
✅ Strong RRR potential (1:3 to 1:4+)
📌 5. Watchlist Note
💡 If price taps into the OB and shows weak momentum, prepare for shorts targeting the FVG
💡 If it holds the OB cleanly with bullish engulfing or BOS (break of structure), ride the long back to channel highs
💬 Call to Action:
📈 Add GBPUSD to your SMC sniper list this week
💬 Comment “OB or FVG? 🤔” if you're waiting to catch the bounce
📌 Save this post for Smart Money reference setups

VIEW: EURUSD-Cut your losses short and let your winners run.
-The market is a device for transferring money from the impatient to the patient.
-In investing, what is comfortable is rarely profitable.
-Trade what you see, not what you think.
CONFIRMATION
-Price is bullish
-Strong order block
-BOS
-Liquidity sweep
-FVG filled
-Price retraced
NB: Do not ever compare yourself to other traders. Take regular breaks from trading Maintain a trading journal Love your craft Learn from other successful traders.

Week of 5/25/25: EU AnalysisExtremely bullish last week leads to my bias being long this week until the weak daily structure is broken.
Thanks for coming, goodluck this week!
Major News:
PMI - Thursday

Week of 5/25/25: AU AnalysisBullish previous week leads for my bias being bullish this week as well until price reaches the next Daily supply zone which we will look to trade the pullback.
Thanks for stopping by goodluck this week!
Major news:
PMI - Thursday

XAUUSD 1H | Bearish Order Block Reaction + Liquidity Sweep🔻 XAUUSD 1-Hour Breakdown — May 14, 2025
Gold gave a strong supply rejection at a marked Order Block zone. This isn’t just a pullback — it’s a potential continuation setup targeting lower lows. Here’s what’s cooking:
🧩 1. Market Structure
Clean rejection from premium OB zone at ~$3,220
Massive bearish impulse candle right after sweeping demand zone liquidity
Price formed a lower low and is now forming a lower high
🛠 2. Key Confluences
🟪 Order Block: Solid rejection with no candle closes above
💧 Liquidity Sweep: Deep wick into OB zone → trapped breakout buyers
🔺 Strong High Protected: Market respects structure, suggesting continuation
🔻 Weak Low Targeted: Clean draw to imbalance & potential sweep zone near $3,116
🧠 3. Trade Setup
Entry: Rejection near $3,207–3,220 OB
SL: Above $3,229 (invalidates structure)
TP: First TP zone near $3,116, extended TP: $3,100
RRR: 1:4 to 1:6 setup depending on partials
⚠️ 4. Risk Management
Watch for NY session reversal attempts
Secure profits at first demand zone reaction
Consider trailing stop above last bearish engulfing candle
📌 Price respects structure. If bulls don’t step in quick, sellers will run the table. This is a classic SMC bearish continuation off OB + liquidity grab — don’t sleep on it!
💬 Type “🔻” if you're riding this short wave with us!
🎯 Follow @ChartNinjas88 for sniper SMC plays every day!

Order Block Rejection with Channel Breakout, Smart Money at Work🧠 BTC/JPY Smart Money Breakdown — May 17, 2025
This setup is a textbook bearish reaction off an Order Block right at the top of a rising channel. Let’s dive into what the big money is doing behind the scenes ⬇️
🧩 1. Context
Market was respecting a rising channel on 15m
Price made a final sweep of internal liquidity into a:
🔴 Red Order Block
📏 Premium zone above the mean
Now we’re seeing a strong bearish displacement candle closing outside the structure 👀
🎯 2. Trade Setup
Entry zone: 15,090,000–15,150,000 (Order Block zone)
SL: Above 15,150,000
TP Zones:
TP1: 15,000,000 (psych level + OB base)
TP2: 14,900,000
TP3: 14,829,228 (full imbalance fill + liquidity resting zone)
➡️ Risk-to-reward ≈ 1:3+, depending on exit
🔍 3. Smart Money Confluence
Order Block rejection: Institutional footprint
Break of channel support: Sign of displacement
Liquidity sweep: Retail breakout bait → SMC trap
Momentum candle shows no hesitation — bearish intent confirmed
If you want sniper trades that flip zones into gold, this is it.
📉 Wait for a possible retest if missed — price might kiss the OB again before further melt.
🧠 Final Thought:
The JPY strength + BTC weekend illiquidity combo makes this setup extra spicy. Stay sharp for potential retests or lower timeframe entries 🔍
💬 What’s your bias? Will BTCJPY keep dumping or fake the break? Let’s debate in the comments 👇
🧠 Tag your trading buddy & follow @ChartNinjas88 for daily Smart Money insights.

ETH Just Slapped Into an Order Block — Next Stop: Dump City?🔎 Ethereum Smart Money Sell Setup | May 17, 2025
The ETH/USD 30-minute chart just gave us a juicy bearish confirmation off a clean Order Block rejection, wrapped in a downward sloping parallel channel — exactly what smart money watches for. Here’s the breakdown:
🧩 1. SMC Narrative
Price tagged a bearish OB right at the mid-supply zone 🟣
Followed by strong engulfing rejection candle
Breakdown from the minor trendline support → confirms bearish shift
Order block lines up with the premium zone of the overall bearish channel
Retail might think this is support — we see liquidity 👀
🎯 2. Trade Specs
Entry: ~2,516.09 (OB upper edge)
SL: 2,520.00
TP Zones:
TP1: 2,476.99 ✅ (almost hit)
TP2: 2,450
TP3: 2,409.47 (final target at channel low)
Risk-to-Reward: Approx 1:4.5
🛠️ 3. Why This Setup Works
Price delivered a channel breakout + OB rejection combo
Strong volume spike during the OB touch = institutional activity
The bounce off the OB is weak — signaling exhaustion
All signs point to a grind down to lower channel support
If you know, you know — this is how banks exit in stealth mode 🚪👻
🎯 Bonus Tip:
If ETH retests the OB zone again with weak bullish candles — that’s your secondary sniper entry 🎯
📣 What’s your bias? Think bulls can reclaim this OB, or are we headed straight into deeper discount pricing?
📲 Follow @ChartNinjas88 for daily laser-focused setups, SMC concepts, and precision trading breakdowns!

AUDUSD Long Setup | Price Action and SMC concepts.🔍 Market Structure & Price Action:
After a clear Break of Structure (BoS) to the upside, AUDUSD is currently retracing back into a Bullish Order Block and sitting above a strong Support Zone and an ascending Trend Line.
Previous Bearish Momentum has shifted into Bullish Momentum, suggesting a potential upside continuation from discounted pricing.
📈 Trade Plan:
🎯 Entry: 0.64025 (inside Bullish OB & near support)
🛑 Stop Loss: 0.63870 (below Bullish OB & Support Zone)
✅ Take Profit: 0.64520 (before Bearish OB & inside premium zone)
🧱 Zones to Watch:
🔵 Bullish Order Block: 0.64025 - 0.63947 (entry aligned)
🔴 Bearish Order Block: 0.64585 - 0.64526 (profit booking area)
🟠 Support Zone: 0.63878 - 0.63956 (strong rejection area)
🟢 Resistance Zone: 0.64693 - 0.64605 (final premium structure)
📊 Confluences:
Trendline support + Bullish OB + Support zone + Bullish momentum shift = High-probability buy setup.
RR Ratio: Approx. 3.2:1 📐
🗺️ Expectation:
Price may first wick into the OB/support zone (0.6400 area), then rally towards the bearish OB (0.645x), with potential partials before major resistance.

GBPJPY Trap & Reversal | Smart Money Loading from OB Zone!We’re analyzing a high-probability bullish reversal setup forming on GBPJPY 1H, built on clean SMC logic. Here’s how this trade is setting up:
🔄 Market Structure:
Prior bearish move into a reversal area
Equal highs (liquidity built up)
Clean sweep below short-term lows ➝ Liquidity grab ✅
Price now reacting from a defined Order Block zone
🧱 Order Block Zone:
Purple OB zone marked at 192.753–192.118
This zone is resting between 61.8% and 70.50% fib levels – high confluence 🔥
💸 Liquidity Levels in Play:
Sell-side liquidity already swept
Buy-side liquidity sitting above the recent highs @ 196.413 (target zone)
🚀 Entry Plan:
Entry Point: Reacting from OB near 192.753
Stop Loss: Below the strong low (192.118)
TP Zone: 196.413 = Buy side liquidity ➝ Weak High marked for potential sweep
🧮 RRR (Risk-to-Reward):
Massive potential ➝ Approx 1:8+ RRR
This is the kind of setup institutions dream of. 🚀
📈 Key Confluences:
Equal highs = liquidity magnet
OB sitting at golden zone
Strong low protecting entry
Institutional pattern: Sweep ➝ OB reaction ➝ expansion
📉 Watch for Pullback/Entry Reconfirmation:
Price may tap deeper into the OB before expanding
Wait for bullish momentum confirmation (CHoCH on 15M or 30M TF = better entry sniper style)
📢 Pro Tip (Trader Mindset):
This setup screams “liquidity engineering”. Retail traders shorted the lower high; Smart Money is about to flip the script. Be the shark, not the fish 🦈

AUDCAD: Bull Trap & Bullish Confirmation 🇦🇺🇨🇦
AUDCAD formed a liquidity grab after a test of significant intraday/daily support.
A cup & handle pattern and a violation of its neckline with a bullish imbalance
provide a strong bullish confirmation.
I expect an up move now, at least to 0.899
❤️Please, support my work with like, thank you!❤️
I am part of Trade Nation's Influencer program and receive a monthly fee for using their TradingView charts in my analysis.

4H FVG level is indicating a strong bullish sentiment.Market Analysis – Gold (XAU/USD)
Gold is currently trading within a bullish Fair Value Gap (FVG) on the 4-hour timeframe, accompanied by notable volume activity. Just below this zone lies a weekly FVG, and multiple other FVG and Breaker Block (BPR) formations have emerged in the same region. The price action around the 4H FVG level is indicating a strong bullish sentiment.
However, on the 1-hour chart, the market has recently formed a bearish FVG in the 3214–3220 range. If the price breaks above this level with strength, the bullish momentum could potentially drive the market toward the following upside targets: 3233, 3240, 3250, and 3260.
Let’s monitor closely and remember: Do Your Own Research (DYOR).

SMC Trap = Clean CHoCH + OB Long, Targeting Liquidity Sweep!We’re tracking a textbook Smart Money Concept (SMC) long setup on EURJPY, 30M timeframe, with clear structure shift and clean OB entry. Here's the full breakdown for traders:
🔄 Market Structure Shift:
Major bearish trend visible from previous candles.
Sharp rejection followed by a Change of Character (CHoCH) indicating possible bullish reversal.
🧱 Order Block Zone:
Price swept liquidity to the downside and tapped into a marked Bullish Order Block at 162.195–162.266.
Entry triggered within this OB zone, with tight risk placement below Strong Low.
🔁 Entry Setup:
Entry: Inside OB at 162.266
Stop Loss: Just below the OB at 162.195 (Strong Low protected)
TP1: 70.50% retracement near 162.650
TP2: Full Buy Side Liquidity sweep @ 162.768 (Weak High Targeted)
🧮 RRR (Risk-to-Reward):
Approximate RRR: 1:6+ — High probability trade if market structure follows through.
🧲 Key Levels Highlighted:
🔹 CHoCH confirms shift to bullish
🔹 OB Zone: High confluence with liquidity grab + candle imbalance
🔹 Buy Side Liquidity: Obvious target for institutions
🔹 Weak High: Ready to be taken out
📈 What To Watch For:
Bullish continuation towards 162.768
Strong impulsive move breaking above minor resistance
Potential re-entries on lower TF OBs (5M–15M)
🧠 Pro Tip for Traders:
Don’t chase—wait for CHoCH + OB confirmation combo. This type of setup works best when confluence aligns: OB + CHoCH + liquidity sweep = 🔥

BTC Reversal Starts Here – Smart Money Filled Up the OB! 🔄 Market Context:
Clear uptrend structure, forming higher highs
Pullback starts ➝ Lower timeframe shows bearish BOS
BTC wicks deep into bullish OB between 103,277 and 102,646
Liquidity sweep below the strong low @ 102,646 triggered ✅
Price now printing rejection from the OB zone 🚨
🧱 Key Order Block Zone:
Marked between 103,277 – 102,646 USD
Aligned with the golden zone (61.8%–70.5%)
Thick purple OB shows Smart Money’s interest 🎯
💸 Liquidity Zones:
Sell-side swept via wick under strong low
Next liquidity magnet: Buy-side Liquidity @ 107,141.59
Weak High @ 105,141.76 ➝ probable first stop 🛑
🚀 Trade Plan:
Entry: Tap and bullish rejection from OB
Stop Loss: Below strong low (102,646)
Take Profit: Partial @ 105,000 → Full @ 107,141 ✅
RRR: Estimated at 1:5+
📉 Why This Setup Rocks:
OB sits perfectly at fib retracement level
Strong low protected → Likely shift in structure next
Liquidity engineered before reversal ➝ Classic SMC recipe
📢 Pro Tip for Ninja Traders:
BTC loves to grab lows before sending price through the roof. If this 30M OB holds, higher TF (4H or 1D) could shift bullish again. This is not random—it’s engineered 📐
⚔️ Mindset Reminder:
"Patience is profit." You waited for the sweep, got OB confirmation, and now you're riding with the institutions 🧠💰

Week of 5/18/25: EURUSD AnalysisAll time frames are bearish on EU, looking for a setup at the 4h POI before looking for an entry short.
Major News:
Unemployment - Thursday

Week of 5/18/25: Audusd AnalysisAU is bearish in the short-term until 1h timeframe shifts back to bullish to align with 4h and daily structure. We're looking for shorts in the meantime until price reaches the extreme of the swing structure.
Major News:
Unemployment - Thursday

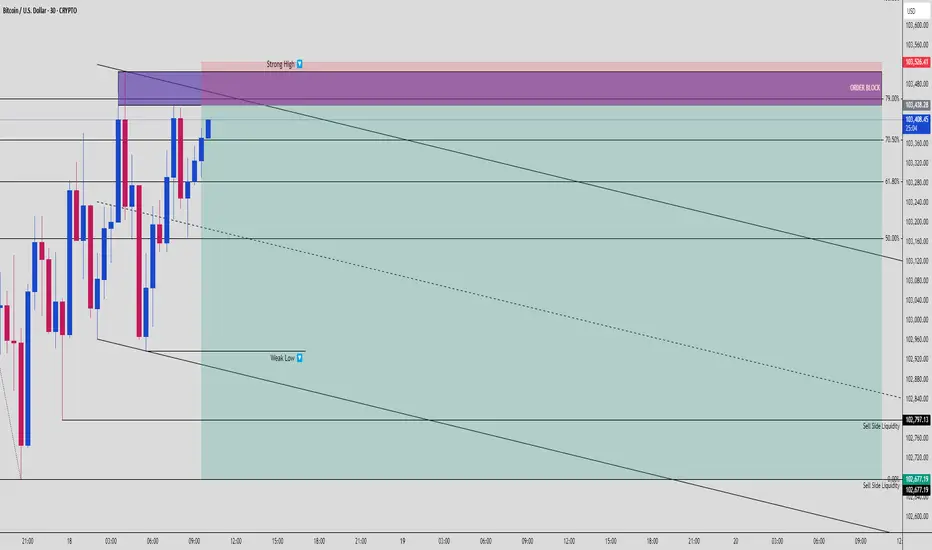
BTC Just Entered the Killzone — Order Block + Strong High Reject🔍 Bitcoin Smart Money Breakdown | May 18, 2025
We’re looking at a potential high RRR short opportunity forming on BTC/USD — chart structure screams SMC precision. Here’s what we’re seeing:
🧩 1. Key Setup Details
Price tapped into a premium Order Block between 103,438–103,526 🔴
Sitting just above a Strong High — liquidity is baiting shorts
Rejection occurred precisely at the 79% Fib retracement level, giving confluence
Bearish structure intact with lower highs & descending trendline
💣 2. Liquidity Map
Above: Strong High = buy-side liquidity trap
Below: Weak Low = prime sell-side magnet
Sell-side liquidity pools at:
102,797.13
102,677.19 (final TP zone)
This is exactly where institutions hunt for exits 🔪
🎯 3. Trade Idea
Entry Zone: 103,438 – 103,526 (OB zone)
Stop Loss: Above Strong High ~103,560
Target Zones:
TP1: 103,120 (50% Fib level)
TP2: 102,797.13 (SSL pool)
TP3: 102,677.19 (final flush zone)
Estimated Risk-to-Reward: 1:3.2 to 1:4.5 depending on SL/TP config 🧠📏
🧠 Bonus Insight:
If BTC wicks above the OB and returns with momentum = potential liquidity grab fakeout — a textbook SMC confirmation entry 👌
🎤 Caption Idea for Short-Form:
“BTC is playing right into the banks’ trap… are you on the right side of this rejection? 😮💨💰”
📲 Follow @ChartNinjas88 for elite SMC plays, sniper-level breakdowns, and real liquidity flow setups!
BTCUSD 1H | Liquidity Grab + FVG Play Before Bullish Expansion📊 BTC/USD 1-Hour Smart Money Outlook — May 15, 2025
Bitcoin is setting up for a classic SMC combo move — targeting sell-side liquidity before flipping bullish and running for the buy-side liquidity at ~$106K.
Let’s break it down 👇
🧠 1. The Setup
Price broke structure to the downside ✅
Heading into a liquidity sweep of the recent lows around $100,000
Major Fair Value Gap lies between $98,100–$96,800
This gap aligns with the 61.8–70.5% fib zone — a premium rebalance area for smart money
🔍 2. Expectations
Short-Term Bearish into FVG → Sell-side liquidity gets swept
Then strong bullish reversal targeting:
🔹 First target: $103,000
🔹 Final target: $105,787 (Buy-side liquidity + Weak High)
Trade Idea: Long after FVG rejection confirmation
SL below $96,800, TP up to $106K — insane RRR of 1:4+
⚠️ 3. Risk Management
Wait for a bullish reaction inside the FVG zone
Protect capital if price closes below $96,800 → setup invalid
Look out for NY session volatility and CPI/FOMC-driven fakeouts
This is textbook Smart Money behavior: draw liquidity, rebalance price, and expand into inefficient price zones. If you're not trading with liquidity in mind — you're the liquidity. 🧠💸
💬 Comment “🚀” if you're long from the Fair Value Gap zone!
🎯 Follow @ChartNinjas88 for daily sniper setups and smart money breakdowns!

After a rock-bottom RSI on DXY, is XAUUSD due for a fall? I thinIts no mystery that the DXY has an inverse mirroring relationship with XAUUSD. When DXY goes down, XAUUSD usually rises.
The RSI for DXY has been bottom of the barrel for a long time now, and combined with a recent break in structure, due certainly due for a temporary rise, which doesn't bode well for XAUUSD in the short term. I placed my SL around 3,254 and TP around 3,243, two key areas of support and resistance from an SMC perspective.

Week of 5/11/25: EURUSD AnalysisEU has clean structure with Daily, 4h, and 1h bearish.
1h internal structure is bullish at the moment and we're waiting for that to break bearish before looking for any shorts.
We're going to be patient and wait for internal before looking for high probability trades.
Major news:
China trade talks - Monday
CPI - Tuesday
PPI/Unemployment - Thursday

Week of 5/11/25: AUDUSD AnalysisDaily is bullish, so in the future price possibly will trend up.
In the meantime 4h and 1h are bearish but has reached a critical daily demand zone at the extreme of daily structure.
So far 1h internal is bullish, so we are still looking for longs cautiously until structure is broken.
Major news:
China trade talks - Monday
CPI - Tuesday
PPI/Unemployment - Thursday
