1H scalp sell update Our trade from yesterday is playing out as I predicted with price pulling back into the orderblock and rejecting it to move downwards.
We are currently winning this trade. Feel free to move stop loss to breakeven.
Smctrading

Ultimate Guide to Smart Money ConceptsWhat Are Smart Money Concepts?
Introduction:
If you’ve been trading for a while, you’ve probably noticed that sometimes the market moves in ways that just don’t make sense. You’ve got your technical analysis all set, but the market seems to go in the opposite direction. That’s where Smart Money Concepts (SMC) come in.
At its core, SMC is all about understanding how big players in the market (think hedge funds, institutions, and banks) move prices. These players have massive amounts of capital and information, and they don’t trade like the average retail trader. Understanding their behavior can help you see where the market is going next before it happens.
What is Smart Money?
In the world of trading, smart money refers to the institutional investors who move markets with their huge orders. Unlike retail traders, who might be relying on indicators or patterns, smart money trades based on liquidity, market structure, and order flow.
While retail traders are typically reacting to price movements, smart money is the one causing those moves. They’re out there seeking out places where they can accumulate positions or distribute them. The tricky part is that they’ll often make the market go in one direction just to trap retail traders and get them to take positions before flipping it back to where they wanted it to go in the first place.
Key Concepts in Smart Money Trading
1. Market Structure
Market structure refers to the way price moves in a trend. It’s essentially a pattern of higher highs and higher lows for an uptrend, or lower highs and lower lows for a downtrend.
Smart money uses these patterns to their advantage. When they see the market creating a series of higher highs and higher lows, they’ll take advantage of that momentum to push prices further, knowing retail traders will follow along.
But when they want to reverse the market, they’ll push it in the opposite direction, creating a market structure shift or a break of structure, which signals that the trend is over and a new one is starting.
2. Liquidity
Liquidity refers to the amount of orders available to be filled at different price levels. Smart money knows exactly where retail traders are likely to place their stops or buy orders.
They’ll often push the price to these levels, triggering those stops and collecting the liquidity. Once that liquidity is grabbed, they’ll reverse the price and move it in the intended direction.
A common way to spot liquidity is by looking for equal highs or equal lows, where traders often place their stop-loss orders. These are often areas smart money will target.
3. Order Blocks
Order blocks are areas on the chart where institutions have placed big orders. These are key levels that represent where price might return to later, and they can act as areas of support or resistance.
Order blocks are usually found after big price moves. Institutions place these orders to either accumulate positions or offload them, and price often comes back to these levels to fill orders that were left behind.
4. Fair Value Gaps (FVG)
Fair value gaps, or imbalances, are price areas where the market moves quickly, leaving gaps between candlesticks. These gaps represent areas where the market has moved too fast for regular orders to fill, and price tends to return to these levels to fill the gaps.
Smart money knows that these imbalances are critical areas for future price action, and they’ll use them to re-enter the market after a move has been completed.
Why Does Smart Money Matter?
Understanding smart money concepts is like learning to think like an institution. Instead of chasing after price based on typical retail indicators, you start looking for the big moves that smart money is making. You begin to notice when the market is setting traps for retail traders, and how these large players accumulate positions before pushing price in a big way.
With SMC, you stop guessing and start anticipating. By looking for liquidity zones, order blocks, and market structure shifts, you can get in sync with the big players and follow their moves, not fight them.
Conclusion
Smart Money Concepts are all about shifting your perspective. Instead of thinking like a retail trader looking for quick breakouts, oversold/overbought conditions, or chasing trends — start looking at the market as the big players do. Pay attention to where the liquidity is, identify key order blocks, and use market structure shifts to guide your trades.
By learning to spot these key signs, you’ll stop being the one who’s trapped and start being the one who’s in sync with the smart money.
Ready to trade smarter? Keep an eye on those order blocks and liquidity zones — they’re where the real money is made.
Next Steps
- Start practicing by reviewing charts through the SMC lens.
- Keep refining your understanding of market structure, liquidity, and order blocks.
- Stay patient, smart money trades aren’t about quick wins, but about positioning yourself for big moves.
__________________________________________
Thanks for your support!
If you found this guide helpful or learned something new, drop a like 👍 and leave a comment, I’d love to hear your thoughts! 🚀
Make sure to follow me for more price action insights, free indicators, and trading strategies. Let’s grow and trade smarter together! 📈

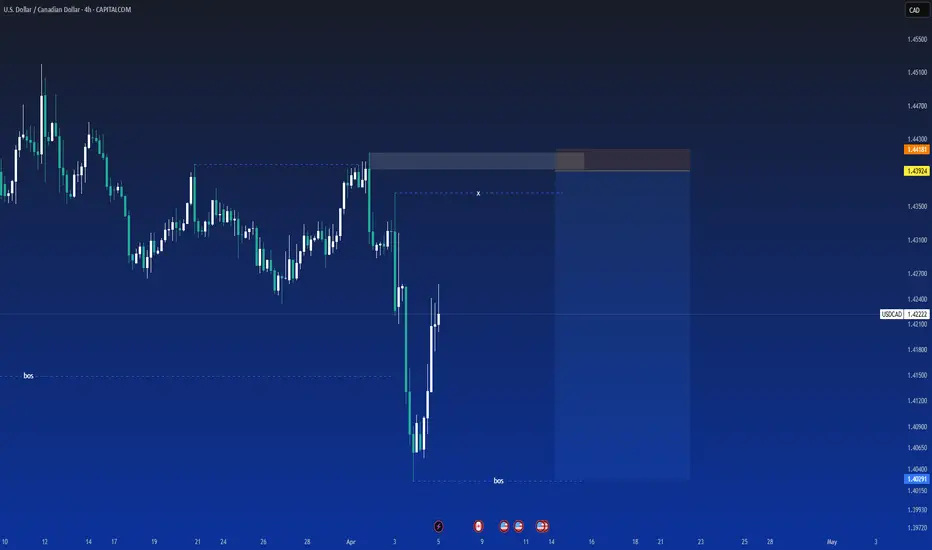
Potential Sell (1H Scalp)Here's my 3 point confluence analysis.. I could be wrong so any additional tips on the comments are welcomed
1. USDCAD was on a small uptrend until it broke the trendline then consolidated sideways.
2. After breaking the trendline a reversal pin bar has formed indicating a downward but this wasn't enough to support the idea
3. after a sell order block formed followed by two FVG I'm confident that it set to move the previous low or to the discount area.
--------------------------------------------
Entry strategy (Enter on Pullback)
--------------------------------------------
Since the stochastics indicator on the hourly is showing it is oversold my TRADE ENTRY is a pull back into the red oderblock & wait for stochastic indicator to be overbought to enter or a rejection of the orderblock
note: the trade could just keep going down without doing a pullback

WEEK OF 4/6/25: EURUSD AnalysisLast week ended bullish for the pair, but there is a correction occuring at the moment so we will follow the MTF internal structure (bearish) until it reaches the daily and 4h POI to look for bullish price action.
Internal MTF structure is always king and we will need that to shift before looking for longs.
Major news: Inflation - Thursday
Thanks for stopping by and goodluck!

WEEK OF 4/6/25: AUDUSDLast week was clearly bearish leading to all time frames being bearish.
Starting the week with a high probability POI to look for entry models from to take shorts to the next daily demand level.
Impactful news: Inflation 4/10
Thanks for stopping by and goodluck traders!

EURGBP Market Structure Analysis on 4 Hour Timeframe4H swing is bullish => current is pullback
M15 swing is bearish.
Currently giving CHoCH reversal signal.
We can look for buying opportunities in this area.
More carefully, we wait for the price to break the top to confirm the 15-minute reversal frame.

GOOGL - Elliott Wave Final ShowdownGOOGL has dropped over 27.28% , reaching a minor profit-booking zone. The $150 level serves as a key demand zone, where a potential price reversal could occur. The formation is either expanded flat or a running flat on the daily timeframe chart.
Confirmation is best observed near the lower trendline of the parallel channel. If bearish momentum persists, prices may decline further to the $142-$140 range before a strong rebound. Once the correction ends, the upside targets are $168, $180, and $195.
A new low will form if the previous low is breached. Further research will be uploaded soon.

ES1 2025-03-31 SPOOZ 15minOBHello everyone, I hope you won, stayed out, or learned something form the market today 😂.
Today was a easy grab.
Drawdown: 17. Tics
TP: 111. Tics Grabbed (out of 438)
Spooz Open Manipulation,
Broke near high,
Retraced to 15min Order Block,
TP Hit at 3 equal Highs (volume).
If you found this inciteful, join our group discussion! (link in bio)

Week of 3/30/25: EURUSD Weekly AnalysisEURUSD has healthy price action with the MTF switching to bullish, once MTF aligns with the daily, we're definitely good to go on longs. For now waiting for price action to show us that it wants to move higher.
Major news: NFP Friday
Thanks for coming, goodluck this week with your trades!

Week of 3/30/25: AUDUSD Weekly AnalysisWeekly analysis this week, price has been congesting and tightening the last 2 weeks, expecting hopefully a good move this week to breakout of consolidation.
Starting the week with a bearish bias.
Major News: NFP Friday
Thanks for stopping by, have a great trading week!

potential liquidity grab and sell-offEUR/USD Key Setup – Smart Money in Action! 🚀
The market is setting up for a potential liquidity grab and sell-off! 📉 Here’s the breakdown:
🔹 Price is approaching a key supply zone (highlighted in yellow & purple). A strong reaction here could indicate a short opportunity.
🔹 Invalidation level is clearly marked—if price breaks above, the setup is invalid.
🔹 Anticipated move: A rejection from the zone could lead to a drop towards the 1.07200-1.07600 demand area.
🔹 Confluence factors: Structure, liquidity, and institutional order flow align with this move.
📊 Trade Idea:
✅ Entry: Wait for a confirmation in the highlighted area
✅ Stop Loss: Above the invalidation level
✅ Take Profit: Lower demand zone
💡 Will this setup play out? Let’s see how the market reacts! Comment below with your thoughts! 🔥📉
#ForexTrading #EURUSD #SmartMoney #PriceAction #Liquidity #ForexSetup

Week of 3/23/25: EU AnalysisWeekly analysis of EU, my analysis shows bearish signals and where I am looking to trade from.
The chart looks very healthy for a daily retracement with the medium time frames aligning to it.
Only volatile news this week for me to watch out for is:
Unemployment Claims - Thursday
Let me know your thoughts, analysis, or what you'd like to see!
Thanks for watching, good luck this week, let's kill it.

Week of 3/23/25: AUDUSD AnalysisAnalysis of my main pair AUDUSD, last week resulted in the bears taking over and my analysis explains why my bias is bearish going into the new week.
Not much volatile news except for Unemployment Claims on Thursday.
Let me know what you guys think, your analysis, and if you want to see anything else!
Goodluck this week traders, let's kill it.

USDJPY Long SetupUSDJPY Looks Bullish, Previous Day Candle Has closed above Friday Candle and we still have a LTH not taken i think today we will be bullish we might have a correction drop down to 0.25 or 0.5 of the previous day and continue higher

GOLD TRADE IDEA : SELL | SHORT (17/03)Gold is at a crossroads. After continuously breaking ATH records it is now looking tired. It has given me signs of a potential reversal. A break to the downside would confirm that. I have reason to believe that it’ll begin dumping the second smaller opens. Even then a break downwards would help us make a decision.
N.B.: This is not financial advice. Trade safely and with caution.

Week of 3/16/25: EURUSD Analysis FIRST VIDEO PUBLISH!First video publish, testing out my recording but also giving my insights for the week ahead. The candle color looks a bit off but hopefully it can be fixed for the next publish.
Pardon the background noise in the first few seconds of the video.
Let me know how the quality and your thoughts/analysis as well!
Happy trading and have a great week traders, let's win.

WHEAT Approaching Key Support - Will Price Rebound to 550$?PEPPERSTONE:WHEAT is approaching a key support level, an area where buyers have previously shown strong interest. The recent bearish movement suggests that price may soon be testing this level, potentially setting up for a rebound.
A bullish confirmation, such as a strong rejection pattern, bullish engulfing candles, or long lower wicks, would strengthen the case for a move higher. If buyers step in, the price could rally toward the 550$ target. However, a decisive breakdown below this support would invalidate the bullish scenario and could lead to further downside.
This is not financial advice but rather how I approach support/resistance zones. Remember, always wait for confirmation, like a rejection candle or volume spike before jumping in.
Best of luck , TrendDiva

USD | USD INDEX Weekly FOREX Forecast: March 10 - 14thIn this video, we will analyze the USD through the USD INDEX (DXY). We'll determine the bias for the upcoming week, and look for the best setups to take.
The USD is bearish, and there is plenty of economic news coming up this week. Should be plenty of opportunities from Tues through Friday.
Short term bullishness, in the form of a pullback, is potentially there. But longer term bearishness is likely to continue.
Enjoy!
May profits be upon you.
Leave any questions or comments in the comment section.
I appreciate any feedback from my viewers!
Like and/or subscribe if you want more accurate analysis.
Thank you so much!
Disclaimer:
I do not provide personal investment advice and I am not a qualified licensed investment advisor.
All information found here, including any ideas, opinions, views, predictions, forecasts, commentaries, suggestions, expressed or implied herein, are for informational, entertainment or educational purposes only and should not be construed as personal investment advice. While the information provided is believed to be accurate, it may include errors or inaccuracies.
I will not and cannot be held liable for any actions you take as a result of anything you read here.
Conduct your own due diligence, or consult a licensed financial advisor or broker before making any and all investment decisions. Any investments, trades, speculations, or decisions made on the basis of any information found on this channel, expressed or implied herein, are committed at your own risk, financial or otherwise.

GBPZAR - Sell Setup at Key Resistance LevelOANDA:GBPZAR has reached a significant resistance zone, a level where sellers have consistently stepped in, leading to notable bearish reversals in the past. This area is marked by strong selling interest and historical price reactions, increasing the likelihood of a bearish move if sellers regain control.
The current price action suggests that if the pair confirms resistance through signals like bearish engulfing candles, long upper wicks, or increased selling volume, we could see a downward move toward 23.41160 — a logical target based on previous price behavior and market structure.
However, if the price breaks above this zone and sustains, the bearish outlook may be invalidated, opening the door for further upside.
Just my take on support and resistance zones—not financial advice. Always confirm your setups and trade with solid risk management.
Best of luck!

GBPUSD Approaching Key Resistance — Will It Drop to 1.27720?OANDA:GBPUSD is approaching a significant resistance zone, an area where sellers have previously stepped in to drive prices lower. This area has acted as a key supply zone, making it a level to watch for potential rejection.
If price struggles to break above and we see bearish confirmation, I anticipate a pullback toward the 1.27720 level.
However, a strong breakout and hold above resistance could invalidate the bearish outlook, potentially leading to further upside.
Just my take on support and resistance zones—not financial advice. Always confirm your setups and trade with solid risk management.
Best of luck!

EURJPY Approaching Major Support – Will Buyers Step In?OANDA:EURJPY is approaching a significant support zone, highlighted by previous price reactions and strong buying interest. This area has historically acted as a key demand zone, increasing the likelihood of a bounce if buyers step in.
The current market structure suggests that if the price confirms support within this zone, we could see a bullish reversal. A successful rebound could push the pair toward the 160.000 level, a logical target based on past price behavior and structural confluence.
Just my take on support and resistance zones—not financial advice. Always confirm your setups and trade with solid risk management.
Best of luck!

NICKEL — Sell Setup at Key Resistance ZonePEPPERSTONE:NICKEL has reached a significant resistance zone, marked by prior price rejections, suggesting strong selling interest. This area has previously acted as a key supply zone, increasing the likelihood of a bearish reversal if sellers step in.
If the price confirms resistance within this zone through bearish price action—such as wick rejections or lower timeframe weakness—we could see a move toward 15,804, which aligns with a logical target based on recent market structure.
However, if the price breaks and holds above this resistance area, the bearish outlook may be invalidated, potentially opening the door for further upside.
Just my take on support and resistance zones—not financial advice. Always confirm your setups and trade with solid risk management.
Best of luck!
