Liquidity Clearing EntryPrice sweep and create a POI unmitigated this is our next POI
The price need always sweep
It become our High Probability Entry
No sweep=No entry
Smctrading

NZDSGD at Key Resistance – Potential Sell SetupOANDA:NZDSGD has reached a clear resistance zone, an area where price has previously struggled to break through. This level has historically acted as a strong supply zone, making it a key area to watch for potential reversals.
If sellers step in and confirm a rejection from this resistance, we could see a move lower toward the 0.76570 level, which aligns with the current market structure. However, a strong breakout above this resistance could invalidate the bearish outlook and signal further upside.
Just my take on support and resistance zones—not financial advice. Always confirm your setups and trade with solid risk management.

Gold SellI am kinda lazy to explain, but
If the price manages to sweep all liquidity at the highs and reaches the zone, you can enter the trade. Make sure to manage your risk properly, or you may blow your account.

XAUUSD - Gold H1 analysis and possible move! 2861!Gold is currently forming a symmetrical triangle pattern, indicating potential breakout opportunities. The price is near $2,915, trading between key support and resistance levels.
Key Levels:
🔹 Resistance Zone: $2,940 - $2,950
Price has rejected this level multiple times.
A breakout above this area could trigger a bullish move.
🔹 Support Trendline: $2,880 - $2,900
A key rising trendline providing support.
A break below could lead to a bearish move.
🔹 Major Support Zone: $2,861 - $2,865
If price reaches this level, buyers may step in.
A confirmed break below could accelerate selling pressure.
Potential Scenarios:
📉 Bearish Breakdown (Main Outlook):
1️⃣ Price consolidates within the triangle.
2️⃣ A break below the support trendline signals further downside.
3️⃣ Target: $2,861 - $2,865 support zone.
4️⃣ If this level breaks, expect a deeper drop.
📈 Bullish Breakout Alternative:
If price breaks and holds above $2,940, expect bullish momentum.
Next Target: $2,960 - $2,970.
Trading Plan for Traders:
✅ Wait for a clear breakout before entering trades.
✅ Short below trendline support, targeting $2,861.
✅ Long above $2,940 with confirmation.
✅ Use stop-loss to manage risk effectively.

LONG BTCCISD AND MSS AFTER A LONG DOWN MOVE.
BULLISH ENGULFING AT BOTTOM.
WAITING FOR PROPER CONFORMATION.
NOTE: I do my analysis, do yours before trade.
Eat🍜 Sleep😴 TradingView📈 Repeat 🔁

AUDUSD Market Structure Analysis on 2 Hour Timeframe- 2H swing is bearish => Current is pullback
- M5, M15 is bullish
- We can look for an opportunity to sell down to this area if the 5-minute time frame turns bearish

GBPAUD Approaching Support: Will Price Rebound to 1.9890?OANDA:GBPAUD is approaching a key support zone. Previously, this area has acted as strong demand, leading to significant bullish reversals. The ongoing bearish momentum suggests sellers are driving the price toward this level, where buyers may step in.
A bullish confirmation, such as a strong rejection pattern, bullish engulfing candles, or long lower wicks, would increase the probability of a rebound. If buyers regain control, the price could move toward the 1.98900 level. However, a breakdown below this zone could invalidate the bullish outlook, opening the door for further downside.
This is not financial advice but rather how I approach support/resistance zones. Remember, always wait for confirmation, like a rejection candle or volume spike before jumping in.
Please boost this post, every like and comment drives me to bring you more ideas! I’d love to hear your perspective in the comments.
Best of luck , TrendDiva

Market Segmentation and Multiple Timeframe AnalysisThe structure of the market is segmented, and what happens in low time periods also happens in high time periods

Still in Bullish trendI see impulse wave in XAU, it's gonna up to the tip or over the highest price I guess.

DIFFERENCE BETWEEN INDUCEMENT AND LIQUITY SMART MONEY COCNEPTHere i show you difference between inducement and liquidity in trading on smart money concept . so watch the video very well to understand how both works.

ACCUMULATION MANIPLUTION DISTRIBUTION EXPLAINED SMCHere i explained how you can use accumulation manipulation distribution trade . As a smart money concept trader you need to under when price is ranging and when is manipulating so you can take advantage of distribution. Using this can maximize your profit and reduce loss.

AUDNZD at Key Resistance: Will It Drop To 1.10650?OANDA:AUDNZD is at a significant resistance area that has consistently acted as a barrier for bullish momentum. The recent price action suggests a potential for sellers to step in and drive prices lower from this zone.
If rejection signals, such as bearish engulfing candles or upper wicks, appear, I expect a move toward 1.10650. A break above this resistance, however, could indicate a shift in market sentiment.
Traders should wait for confirmation before entering short positions and ensure proper risk management. If you have any thoughts or agree with this analysis, I’d love to hear your perspective in the comments!

EURUSD TRADE IDEA: SHORT | SELL (10/02)I think it is quite obvious that EURUSD will continue to the downside as predicted earlier.
It is simple following larger TF order flow
RR: 6.51
N.B.: This is not financial advice. Trade safely and with caution.

SMC EntryBOS with Candle close entry
IN this case, we can plan for the buy after market take out IDM and tap on any POI

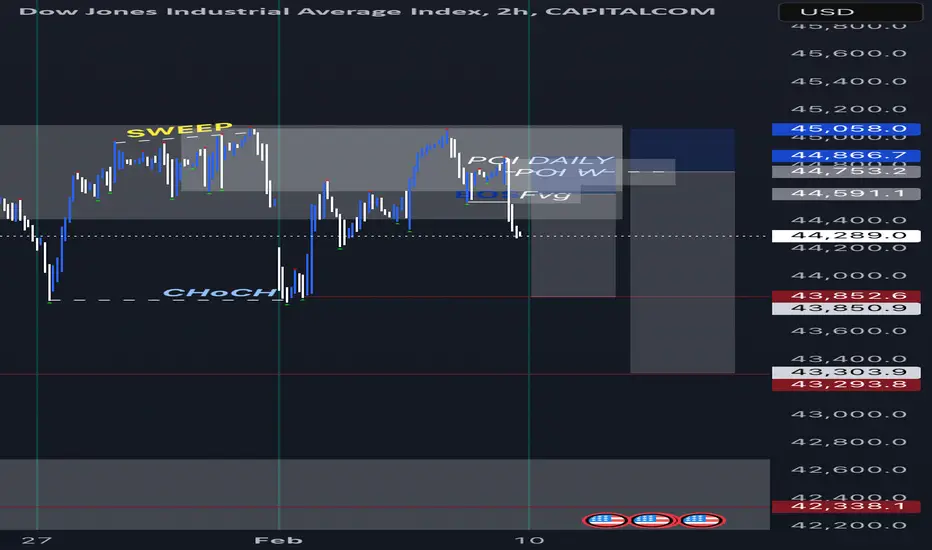
US30 TRADE IDEA: SHORT | SELL (10/08)Price has been bullish overall. While it has been overall bullish - price hasn’t broken from its consolidation, therefore in the meanwhile we’ll take advantage of the situation. Price has broken down on the 4H TF, so we’re looking for an optimal entry. Although I have marked out FVG - I believe the uppermost order block is a great place to enter from.
RR 1 : 2.69
RR 2 : 2.95
RR 3 : 4.82
N.B.: This is not financial advice. Trade safely and with caution.
US DOLLAR at Key Support: Will Price Rebound to 108.200?TVC:DXY is currently testing a key support zone, an area where the price has previously shown strong bullish reactions. The recent price action suggests that buyers may step in and drive the price higher. A bullish confirmation, such as a strong rejection pattern, bullish engulfing candles, or long lower wicks, would increase the probability of a bounce from this level. If buyers regain control, the price could move toward the 108.200 level.
However, a breakout below this support would invalidate the bullish outlook, potentially opening the door for further downside.
This is not financial advice but rather how I approach support/resistance zones. Remember, always wait for confirmation, like a rejection candle or volume spike before jumping in.
Please boost this post, every like and comment drives me to bring you more ideas! I’d love to hear your perspective in the comments.
Best of luck , TrendDiva

EURNZD - Sell Setup at Clear Resistance ZoneEURNZD is currently trading in a clear resistance zone that has consistently acted as a barrier for bullish momentum. This area aligns with prior supply levels and could attract some seller interest.
If rejection patterns, such as bearish engulfing candles or long upper wicks, emerge, I anticipate a move toward 1.82800. However, a break above this zone could signal a potential shift in market sentiment.
This is not financial advice but rather how I approach support/resistance zones. Remember, always wait for confirmation before jumping in.
Please boost this post, every like and comment drives me to bring you more ideas! I’d love to hear your perspective about this setup in the comments.
Best of luck , TrendDiva

HKDJPY - Potential Sell After Support BreakOANDA:HKDJPY has successfully broken a support level and it may be retesting it as resistance. If the price confirms resistance at this retest, I anticipate a bearish move toward 19.64974 level. Conversely, a failure to hold resistance could indicate a continuation of the bullish trend.
Traders should look for bearish confirmation signals, such as bearish engulfing candles or increasing sell volume, before entering short positions. Agree with this analysis? Let’s discuss further in the comments section!

WHEAT at Key Resistance Zone - Sellers Ready to Step In?PEPPERSTONE:WHEAT is approaching a key resistance zone, an area that has previously triggered strong selling pressure, making it a key level to watch.
If rejection occurs—such as wicks, bearish engulfing patterns, or a shift in momentum—sellers could regain control, driving the price lower toward the 559.0 target. This aligns with a short-term pullback scenario within the broader market structure. However, a sustained breakout above this resistance would invalidate the bearish outlook, potentially opening the door for further upside.
This is not financial advice but rather how I approach support/resistance zones. Remember, always wait for confirmation, like a rejection candle or volume spike before jumping in.
Please boost this post, every like and comment drives me to bring you more ideas! I’d love to hear your perspective in the comments.
Best of luck , TrendDiva

EURJPY Approaching Key Support - Buying Opportunity Ahead?OANDA:EURJPY is approaching a key support zone, an area where the price has previously shown strong buying interest. The recent price action suggests that buyers may step in and drive the price higher. A bullish confirmation, such as a strong rejection pattern, a bullish engulfing candle, or long lower wicks, would increase the probability of a bounce from this level. If buyers regain control, the price could move toward the 160.080 level.
However, a breakout below this support would invalidate the bullish outlook, potentially opening the door for further downside.
This is not financial advice but rather how I approach support/resistance zones. Remember, always wait for confirmation, like a rejection candle or volume spike before jumping in.
Please boost this post, every like and comment drives me to bring you more ideas! I’d love to hear your perspective in the comments.
Best of luck , TrendDiva

EURZAR Approaching Demand Zone – Bullish Bounce ExpectedOANDA:EURZAR is approaching a key demand zone. Previously, this area has acted as strong support, leading to bullish reversals. The current price action suggests buyers might step in again, potentially driving the price higher.
A bullish confirmation, such as a strong rejection pattern, bullish engulfing candles, or long lower wicks, would increase the probability of a rebound. If buyers regain control, the price could move toward the 19.39600 level.
However, a break below this demand zone could invalidate the bullish outlook, potentially opening the door for further downside.
This is not financial advice but rather how I approach support/resistance zones. Remember, always wait for confirmation, like a rejection candle or volume spike before jumping in.
Please boost this post, every like and comment drives me to bring you more ideas! I’d love to hear your perspective in the comments.
Best of luck , TrendDiva

NZDUSD Approaching Key Resistance – Potential Sell SetupOANDA:NZDUSD is approaching a key resistance zone. Previously, this level has acted as strong supply area, leading to a bearish reaction. The ongoing bullish momentum suggests that buyers might test this level soon. A bearish confirmation, such as a strong rejection pattern, bearish engulfing candles, or long upper wicks, would increase the probability of a pullback. If sellers step in, the price could move toward the 0.56570 level.
This is not financial advice but rather how I approach support/resistance zones. Remember, always wait for confirmation, like a rejection candle or volume spike before jumping in.
Please boost this post, every like and comment drives me to bring you more ideas! I’d love to hear your perspective in the comments.
Best of luck , TrendDiva

LEAD at Key Resistance Level - Correction Incoming?FUSIONMARKETS:XPBUSD is currently testing a significant resistance zone. Previously, this area has acted as a strong barrier, leading to bearish reactions. The recent rally into this zone suggests a potential for sellers to step in and drive prices lower.
A bearish confirmation, such as a strong rejection pattern, bearish engulfing candles, or long upper wicks, would increase the probability of a pullback. If sellers regain control, the price could move toward the 1,967.000 level.
This is not financial advice but rather how I approach support/resistance zones. Remember, always wait for confirmation, like a rejection candle or volume spike before jumping in.
Please boost this post, every like and comment drives me to bring you more ideas! I’d love to hear your perspective in the comments.
Best of luck , TrendDiva
