SNAP Potential for Bearish Drop | 28th December 2022Looking at the H4 chart, my overall bias for SNAP is bearish due to the current price being below the Ichimoku cloud , indicating a bearish market. Looking for a sell entry at 9.24, where the 61.8% Fibonacci line is. Stop loss will be at 10.15, where the 78.2% Fibonacci line and recent high are. Take profit will be at 7.30, where the previous swing low is.
Any opinions, news, research, analyses, prices, other information, or links to third-party sites contained on this website are provided on an "as-is" basis, as general market commentary, and do not constitute investment advice. The market commentary has not been prepared in accordance with legal requirements designed to promote the independence of investment research, and it is therefore not subject to any prohibition on dealing ahead of dissemination. Although this commentary is not produced by an independent source, FXCM takes all sufficient steps to eliminate or prevent any conflicts of interest arising out of the production and dissemination of this communication. The employees of FXCM commit to acting in the clients' best interests and represent their views without misleading, deceiving, or otherwise impairing the clients' ability to make informed investment decisions. For more information about the FXCM's internal organizational and administrative arrangements for the prevention of conflicts, please refer to the Firms' Managing Conflicts Policy. Please ensure that you read and understand our Full Disclaimer and Liability provision concerning the foregoing Information, which can be accessed on the website.
Snap

SNAP Potential for Bearish Drop | 23rd December 2022Looking at the H4 chart, my overall bias for SNAP is bearish due to the current price being below the Ichimoku cloud , indicating a bearish market. Looking for a sell entry at 9.24, where the 61.8% Fibonacci line is. Stop loss will be at 10.15, where the 78.2% Fibonacci line and recent high are. Take profit will be at 7.30, where the previous swing low is.
Any opinions, news, research, analyses, prices, other information, or links to third-party sites contained on this website are provided on an "as-is" basis, as general market commentary, and do not constitute investment advice. The market commentary has not been prepared in accordance with legal requirements designed to promote the independence of investment research, and it is therefore not subject to any prohibition on dealing ahead of dissemination. Although this commentary is not produced by an independent source, FXCM takes all sufficient steps to eliminate or prevent any conflicts of interest arising out of the production and dissemination of this communication. The employees of FXCM commit to acting in the clients' best interests and represent their views without misleading, deceiving, or otherwise impairing the clients' ability to make informed investment decisions. For more information about the FXCM's internal organizational and administrative arrangements for the prevention of conflicts, please refer to the Firms' Managing Conflicts Policy. Please ensure that you read and understand our Full Disclaimer and Liability provision concerning the foregoing Information, which can be accessed on the website.

$TSLA $AMZN $GOOGL $MSFT $AAPL $DOGEUSD $NFLX $SNAP $META #NIFTYNASDAQ:TSLA
Fair Priced.
> 70% down from the ATH
Now opportunity to double the money.
CMP 125$
Target 250$
Duration < 12M
SL 60
RR > 2 time
Return > 100%
Bet is worth taking the risk!
TSLA AAPL AMZN GOOGL MSFT NFLX SNAP META NIFTY BANKNIFTY V JPM GS ADBE
Factors:
BULLISH WEDGE BREAKOUT
Trend Following
Rising Volume with rising Prices.
Flag pattern breakout.
Pennant Pattern Breakout with Bullish Candle.
Retest Successful.
Higher Highs & Higher Lows.
Broken above RESISTANCE levels
Trading at SUPPORT levels
Earnings are strong.
Bullish Wedge Breakout
Risk Return Ratio is healthy.
And
Rising from Double Bottom Pattern to Flag Pattern forming.
If you like my work KINDLY LIKE SHARE & FOLLOW this page for free Stock Recommendations.
With 💚 from Rachit Sethia

SNAP Potential for Bearish Continuation | 19th December 2022Looking at the H4 chart, my overall bias for SNAP is bearish due to the current price being below the Ichimoku cloud , indicating a bearish market. Looking for a sell entry at 9.24, where the 61.8% Fibonacci line is. Stop loss will be at 10.15, where the 78.2% Fibonacci line and recent high are. Take profit will be at 7.30, where the previous swing low is.
Any opinions, news, research, analyses, prices, other information, or links to third-party sites contained on this website are provided on an "as-is" basis, as general market commentary, and do not constitute investment advice. The market commentary has not been prepared in accordance with legal requirements designed to promote the independence of investment research, and it is therefore not subject to any prohibition on dealing ahead of dissemination. Although this commentary is not produced by an independent source, FXCM takes all sufficient steps to eliminate or prevent any conflicts of interest arising out of the production and dissemination of this communication. The employees of FXCM commit to acting in the clients' best interests and represent their views without misleading, deceiving, or otherwise impairing the clients' ability to make informed investment decisions. For more information about the FXCM's internal organizational and administrative arrangements for the prevention of conflicts, please refer to the Firms' Managing Conflicts Policy. Please ensure that you read and understand our Full Disclaimer and Liability provision concerning the foregoing Information, which can be accessed on the website.

SNAP Potential for Bearish Continuation | 19th December 2022Looking at the H4 chart, my overall bias for SNAP is bearish due to the current price being below the Ichimoku cloud, indicating a bearish market. Looking for a sell entry at 9.24, where the 61.8% Fibonacci line is. Stop loss will be at 10.15, where the 78.2% Fibonacci line and recent high are. Take profit will be at 7.30, where the previous swing low is.
Any opinions, news, research, analyses, prices, other information, or links to third-party sites contained on this website are provided on an "as-is" basis, as general market commentary, and do not constitute investment advice. The market commentary has not been prepared in accordance with legal requirements designed to promote the independence of investment research, and it is therefore not subject to any prohibition on dealing ahead of dissemination. Although this commentary is not produced by an independent source, FXCM takes all sufficient steps to eliminate or prevent any conflicts of interest arising out of the production and dissemination of this communication. The employees of FXCM commit to acting in the clients' best interests and represent their views without misleading, deceiving, or otherwise impairing the clients' ability to make informed investment decisions. For more information about the FXCM's internal organizational and administrative arrangements for the prevention of conflicts, please refer to the Firms' Managing Conflicts Policy. Please ensure that you read and understand our Full Disclaimer and Liability provision concerning the foregoing Information, which can be accessed on the website.

SNAP Potential for Bearish Continuation | 15th December 2022Looking at the H4 chart, my overall bias for SNAP is bearish due to the current price being below the Ichimoku cloud , indicating a bearish market. Looking for a sell limit entry at 9.64, where the previous low is. Stop loss will be at 11.03, where the 61.8% Fibonacci line is. Take profit will be at 8.27, where the -61.8% Fibonacci expansion line is.
Any opinions, news, research, analyses, prices, other information, or links to third-party sites contained on this website are provided on an "as-is" basis, as general market commentary, and do not constitute investment advice. The market commentary has not been prepared in accordance with legal requirements designed to promote the independence of investment research, and it is therefore not subject to any prohibition on dealing ahead of dissemination. Although this commentary is not produced by an independent source, FXCM takes all sufficient steps to eliminate or prevent any conflicts of interest arising out of the production and dissemination of this communication. The employees of FXCM commit to acting in the clients' best interests and represent their views without misleading, deceiving, or otherwise impairing the clients' ability to make informed investment decisions. For more information about the FXCM's internal organizational and administrative arrangements for the prevention of conflicts, please refer to the Firms' Managing Conflicts Policy. Please ensure that you read and understand our Full Disclaimer and Liability provision concerning the foregoing Information, which can be accessed on the website.

SNAP DAILY WOLFE WAVEAnother daily wolfe wave setup was triggered post midterms. The chart for SNAP is closing in on a few gaps left open after the earnings debacle. With tax losses and Christmas rally into end of year, we should see most of the small caps rally and accelerate into Feb 2023. The apex and projection target lines can be used to estimate when price and time will meet in the future by extending a vertical line connecting the two points in space. Based on the position of the apex, the price of SNAP is projected to reach $15 or higher (200 day ma) by Dec 29, 2022.

$META futureNice prespective
lets me know your views
how facebook will help people experiencing meta.nice prespective and hopefully this will be future

SNAPCHAT It's time to buyHI,
I'm betting on snapchat. Price is looking good at $7.5
I'm targeting $20.
Lets how it plays out.
All the best!

Meta pricing in recession in 2023 & is cheaper than sp500 #meta Meta stock was once a 30 percent grower with a high PE and high Price to sales. But now has become a 10 pe value stock. Sp500 has an 18 PE is pricing in 9-10 % growth in 2023. META SPY SNAP GOOG

Market up on GM, UBS, KO earnings Coca-Cola shares rose 2.9% in the premarket after the beverage giant’ third-quarter earnings and sales beat Street forecasts. The company also raised its full-year outlook as demand remains steady even as it has raised prices to make up for higher expenses.
General Motors
(GM) – GM shares rallied 4.4% in premarket trading after the automaker reported a better-than-expected third-quarter profit, helped by rebounding sales. GM also said supply chain constraints are easing, allowing it to increase inventories on dealer lots.
General Electric
(GE) – GE jumped 4.2% in premarket action even though its earnings fell short of forecasts. The company cut its full-year outlook as it works its way through supply chain issues and higher costs. GE’s revenue was stronger than expected, as was free cash flow.
UPS
(UPS) – The delivery service’s shares rallied 4.4% in the premarket following a mixed quarterly report that saw earnings beat consensus and revenue fall short. UPS was helped by expanded profit margins as it raised prices.
UBS
(UBS) – UBS jumped 5.1% in the premarket after the Swiss bank posted better-than-expected quarterly results, helped by a jump in customer cash inflows to its wealth management business.
SAP
(SAP) – SAP rose 3% in premarket action after the German business software company reported upbeat quarterly results, helped by strong growth in its cloud business. SAP also confirmed its full-year outlook.
Logitech
(LOGI) – Logitech jumped 7% in the premarket after the maker of computer peripherals maintained its current full-year guidance, which was reduced in July. Logitech has seen sales cool off following a long period of elevated demand spurred by the pandemic.
Qualtrics
(XM) – Qualtrics surged 9.6% in the premarket after the maker of customer feedback software reported better-than-expected quarterly results and lifted its full-year forecast.

SNAP May be an incredible buy opportunity based on Market PhasesSnap Inc (SNAP) hit new lows last Friday, completing a disastrous -90% drop from its All Time High (ATH). The stock market fundamentals couldn't be more negative and is the reason why the majority of the market is expecting the price to drop even more. Few are thinking to enter Snap here and who can blame them?
However based on Dr. Jean-Paul Rodrigue's infamous Market Cycle Phases, the stock may be an incredible buy opportunity on the long-term as it appears to be trading in 'Despair' territory, below its mean and at the end of its 'Blow off Phase'. The Public and Dumb Money started entering during the Mania Phase, which is dominated by Enthusiasm, Greed and Delusion. The 2022 drop has spread fear, the price capitulated and all that is left now is to reverse on investors' despair and return to the mean.
Does it look like a solid long-term buy opportunity to you?
-------------------------------------------------------------------------------
** Please LIKE 👍, SUBSCRIBE ✅, SHARE 🙌 and COMMENT ✍ if you enjoy this idea! Also share your ideas and charts in the comments section below! This is best way to keep it relevant, support me, keep the content here free and allow the idea to reach as many people as possible. **
-------------------------------------------------------------------------------
You may also TELL ME 🙋♀️🙋♂️ in the comments section which symbol you want me to analyze next and on which time-frame. The one with the most posts will be published tomorrow! 👏🎁
-------------------------------------------------------------------------------
👇 👇 👇 👇 👇 👇
💸💸💸💸💸💸
👇 👇 👇 👇 👇 👇

Trade it 🤡 or leave itHello everyone,🙋🏾
Here again Rom with a new trading idea,
After each report of results in the last quarter, the NYSE:SNAP started with a "gap down" and rose between 14 and 29%.
This time the same thing happened.
Do we expect an increase of about 14 to 30%?
For More, follow me, express your opinion, and share with me.💃🏿
don't forget like👍
⚠️__🚧___🚧___🚧__🚧___🚧__🚧_🚧__🚧__🚧__🚧__🚧_🚧__🚧__🚧_🚧__🚧_⚠️
There is no recommendation for buying or selling or any action in the stock, I am not an investment advisor and publish this article as a hobby only.
Everyone has to perform risk management on their own or contact an investment advisor with a license, I don't have one.
Investing in the stock market involves risking your money!⛔️
have fun💃🏿


Major Earnings Weigh Heavy On StocksThe S&P 500 has taken an unfortunate turn as abysmal Snapchat profits have taken a turn for the worse and the stock has plummeted naerly 25%. This took down other social media stocks with it, some of which form a formidable component of the S&P 500. We were seeing support at our level at 3676, but the selling momentum has taking us down to 3645, where we are seeing some support. If the bear momentum continues, we could retrace the entire move back to 3584 or so. If we are able to pivot from here, look for a ceiling at 3758, and a likely intermediary target at 3714.

Snapped - it's all over for SNAPAnother victim of higher rates, fickle consumer behavior, and a disconnect from reality. All avoidable, of course, if you kept your wits and traded with discipline. The break of 10.03 (RED) spells the likely end of bullish dreams. S/R's guiding the way, as always.

SNAP Snap Inc Options Ahead Of EarningsIf you haven`t sold SNAP here:
Looking at the SNAP Snap Inc options chain, i would buy the $12 strike price Calls with
2022-11-18 expiration date for about
$0.74 premium.
Looking forward to read your opinion about it.

Selling Snap into swing highs.Snap - Intraday - We look to Sell at 12.71 (stop at 13.91)
Price action continues to trade around the all-time lows.
Price action continued to range between key support & resistance (10.00 - 12.80) and we expect this to continue.
The bias is to break to the downside.
Daily signals are bearish.
We look for a temporary move higher.
The primary trend remains bearish.
This stock has seen poor sales growth.
Our profit targets will be 10.04 and 9.04
Resistance: 10.80 / 11.30 / 12.00
Support: 10.00 / 9.50 / 9.00
Disclaimer – Saxo Bank Group.
Please be reminded – you alone are responsible for your trading – both gains and losses. There is a very high degree of risk involved in trading. The technical analysis , like any and all indicators, strategies, columns, articles and other features accessible on/though this site (including those from Signal Centre) are for informational purposes only and should not be construed as investment advice by you. Such technical analysis are believed to be obtained from sources believed to be reliable, but not warrant their respective completeness or accuracy, or warrant any results from the use of the information. Your use of the technical analysis , as would also your use of any and all mentioned indicators, strategies, columns, articles and all other features, is entirely at your own risk and it is your sole responsibility to evaluate the accuracy, completeness and usefulness (including suitability) of the information. You should assess the risk of any trade with your financial adviser and make your own independent decision(s) regarding any tradable products which may be the subject matter of the technical analysis or any of the said indicators, strategies, columns, articles and all other features.
Please also be reminded that if despite the above, any of the said technical analysis (or any of the said indicators, strategies, columns, articles and other features accessible on/through this site) is found to be advisory or a recommendation; and not merely informational in nature, the same is in any event provided with the intention of being for general circulation and availability only. As such it is not intended to and does not form part of any offer or recommendation directed at you specifically, or have any regard to the investment objectives, financial situation or needs of yourself or any other specific person. Before committing to a trade or investment therefore, please seek advice from a financial or other professional adviser regarding the suitability of the product for you and (where available) read the relevant product offer/description documents, including the risk disclosures. If you do not wish to seek such financial advice, please still exercise your mind and consider carefully whether the product is suitable for you because you alone remain responsible for your trading – both gains and losses.

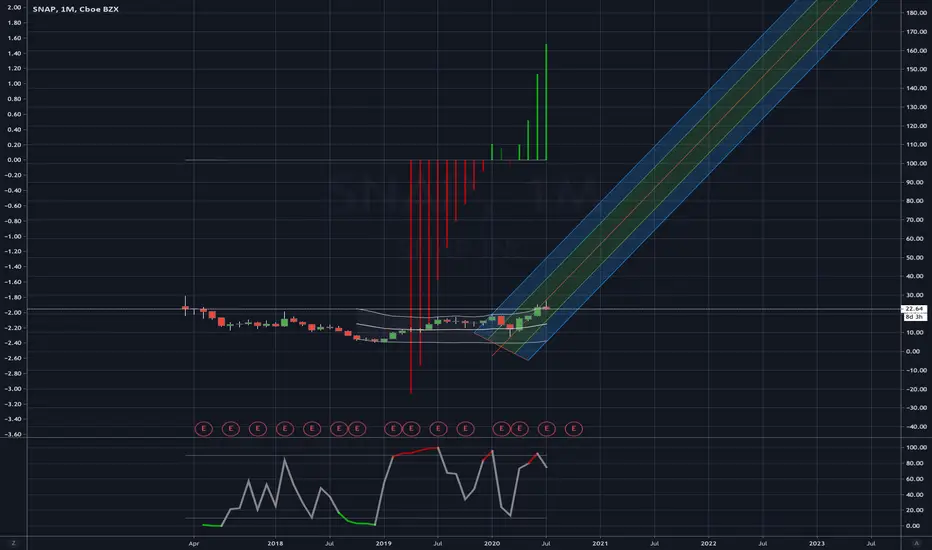
SNAP LongBuckle up, SNAP's run is just getting started and will last multiple years.
Looking towards $100+ over the next 24-32mo.
That Snapback - SNAPMeta looks ready to rally and Snap maybe even more so, Sitting here with daily bull divergence at strong support. Target would be around 20-22 from here. I'll add some to my cash accounts. Stop would be 9 dollars.
Social media stocks look ready to bounce, no idea what the reason will be. I guess we'll see if that's true soon. Good luck!

The Meta Beta - MetaStill looks good for META here and SNAP as well. Markets need to rally from here, but even if the markets are weak, META and other beaten down tech may bounce anyway. Weekly bull divergence should not be ignored, also holding trend (see below) from previous falling wedge structure.

SNAP buying volumeBuy low sell high. Seems like others might be doing the same. REALLY intrigued to see if SNAP will make it out of the 80% hole that it's in from the selling.

snap stock update after up almost 10% today #snap $snap Snap had a monster day after CEO made positive comments. Snap is still massively oversold from its all time highs, but still slightly expensive for its earnings expectations.
