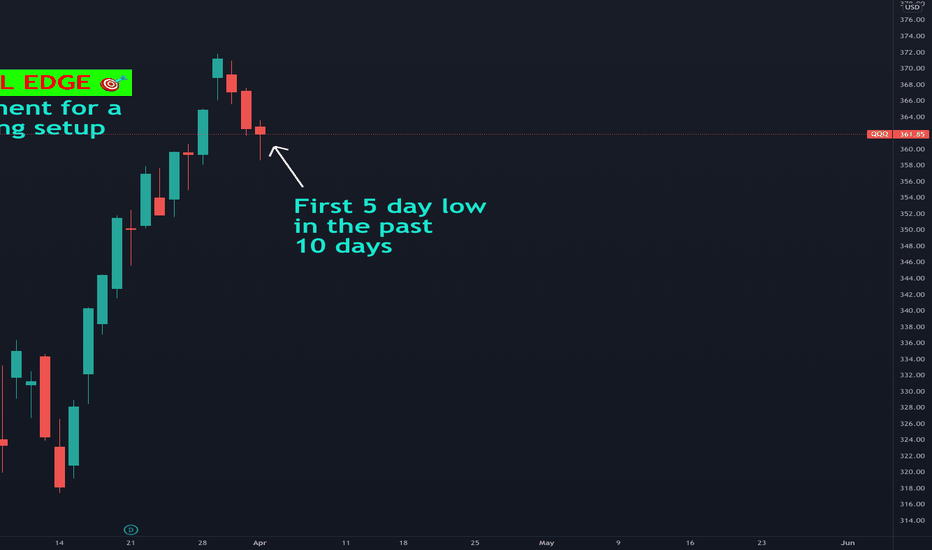
🎯 HISTORICAL EDGE - 76% WIN RATE - 04APR22PRO TRADER : Do you see the HISTORICAL EDGE?
NEWBIE : Yeah we close under the 200D MA
PRO TRADER : Close! The QQQ made a 5day low for the first time in the last 10days AND it closed under 200D
⬇️ ⬇️ ⬇️ RESULT ⬇️ ⬇️ ⬇️
🔱 This setup has occurred 25 times since 2000! 💎
🔱 The 10 day move from here has had 76% chance of being bullish 🟢 ( aka higher from here)
🔱 The average winner has been 4%!
👉 Aka we predict that in the next 10days QQQ has 76% chance of closing 4% here from here!
Sniper
EURUSD.....................................................................................................................................................................................................................Risky entry, since the overall trend is bullish. Just trying to catch the reaction from the demand zone. Manage well. First target 1:1R
Sniper entryUpdate on USDJPY.....................................................................................................................................................................................................................................................................................................................
🎯 HISTORICAL EDGE - 🟢 RESULT FOR 15FEB💁♂️ TRADER: Did you take the signal, Newbie?
👶 NEWBIE: No, what happened?
💁♂️ TRADER: We anticipated a move to the upside ⬆️ on the 15FEB since we had a rare historical setup on the 14FEB.
👶 NEWBIE: And...?
💁♂️ TRADER: SPX posted a move to the upside with 1.5%🟢 AND given this an estimate for the general market, the move to the upside dragged many names up (NEW+5.5%, OXY+5.6%, CTRA+4.87%, PSX+4.18% etc etc.). These setups move the whole market - pay attention next time, Newbie.
🎯 HISTORICAL EDGETRADER: Do you see the HISTORICAL EDGE?
TRADER: Yesterday we posted a LOWER HIGH, LOWER LOW and LOWER CLOSE for the 3rd Day in a row!
NEWBIE: So what?
TRADER: It was also a MONDAY
NEWBIE: And?!
TRADER: We refer to this as TURNAROUND TUESDAY. CHECK out the STATS what happens the next day when this setup occurs
⬇️ ⬇️ ⬇️ RESULT ⬇️ ⬇️ ⬇️
This setup has occured 22 times since 1993! 💎 We backtested the results:
The 1 day move has had 65% chance of being bullish 🟢 on the next day (aka market session on 15FEB)
The average winner has been 2 times larger than the average loser
Bank Nifty Analysis for 07/02/2022HI EVERYONE,
This is bank nifty trade setup for 07/02/2022
Trading Range
FLAT Opening = 38600-38900
Buy Call Above = 38900(take profit up to first resistance and book half qty and trail sl )
Buy Put Below = 38600(take profit up to first support and book half qty and trail sl)
🎯 HISTORICAL EDGE - MORE TO DROPHey guys!
Todays Historical edge comes from an interesting pattern.
📈 The Pattern: SPX closes down over 2% and above 5day low, but yesterday it closed at 5day high.
We backtested and saw strong edge.
⬇️ ⬇️ RESULT ⬇️ ⬇️
📍 Edge: 🔴 Bearish
🔄 Occurrence since 1990: 25x (frequent)
🏔 Highest edge: 4days later
🎲 Probability of bullish move: 28% - aka this suggest a bearish move over the next 4days.
🎯 HISTORICAL EDGE - VIX helping the BULLS 🐂👋 Hey team!
Today we see that the VIX 🌊 made a dramatic reversal after closing more than 10% below its 10D MA 👇
Why is this special? Because a few days ago we were above it by more than 10% 👆
We reviewed when has this happened in the past (since 1993 to be exact)🧪.
⬇️ ⬇️ ⬇️ RESULTS ⬇️ ⬇️ ⬇️
This type of event has occurred 40x since 1993 and we see strong historical edge 8️⃣ days later with a batting average of 77.5% to the upside! 📈
We also see that 90% of these times we have closed above the closing price of SPX on the day it occurred (31JAN in our case) at some point next week!
🎯 HISTORICAL EDGE - 🎾 BOUNCE?Today was interesting day since a few things have triggered:
✅. Yesterday we gapped up
✅. Today we closed at a 10d low
✅. Today we closed under 200MA
✅. Today we closed at 25% of the Daily Close Range (shame)
🦄. Some additional technical magic filters
We tested the times this has happened...since 1993📆 !
We saw a relatively bullish move. The 2DAY move on the spy has been bullish nearly 83% of time🟢 . This type of setup has occurred 1️⃣8️⃣x!
Average move up has been about 3% over a 2day period, which is positive🟢 .
However, if we do not observe strong bounce, probabilities stack strongly to the downside, so observe and evaluate 🔴 .
However, as our members hear me repeat over and over again patience is the name of the game!
Trade safe
🎯 HISTORICAL EDGE – RARE ANIMAL 🦖👋 HOLA team!
A very rare system has triggered in our studies. This is a 7️⃣ day higher close for the VIX.
We backtested the system since the initiation of the SPY (Only 11x, super rare 💎 ). What we see is that....(drum roll 🥁)
the 3 days move has yielded 100% bullish move. This is quite a tell. Average bullish move has been 1.7% for 3 days. 🟢
However, given the abnormal behaviour of this market, caution is advised.
If you like this idea and want similar like this click on the link below. ⬇️
BTCUSD✓From monthly timeframe BTC is falling and is expected to go below 38000 befort regain it's momentum up.
✓Break of Market structure observed at 406500, which indicates the probability for price to drope is so high.
✓ price also show strong resistance zone at 42290.
✓ This zone can also be considered as liquidity zone, therefore an interesting area above it can be valid entry setup for sell.
✓The high probable selling zone is between 42500 and 42750.
✓ At this zone one can find any berish confirmation and enter or can enter direct and put stop loss above the zone.


