SPY - On Our Way To Target 3 ...But First?Trading Fam,
It's been a while since I updated you all on the SPY, which, as you know, we track closely to help us determine the overall market trend. Since we have now exceeded my Target #2, it's time for me to give you all another update. But first, a little context for my new readers which I have been getting a lot of recently, thanks to my new indicator hitting it out of the park.
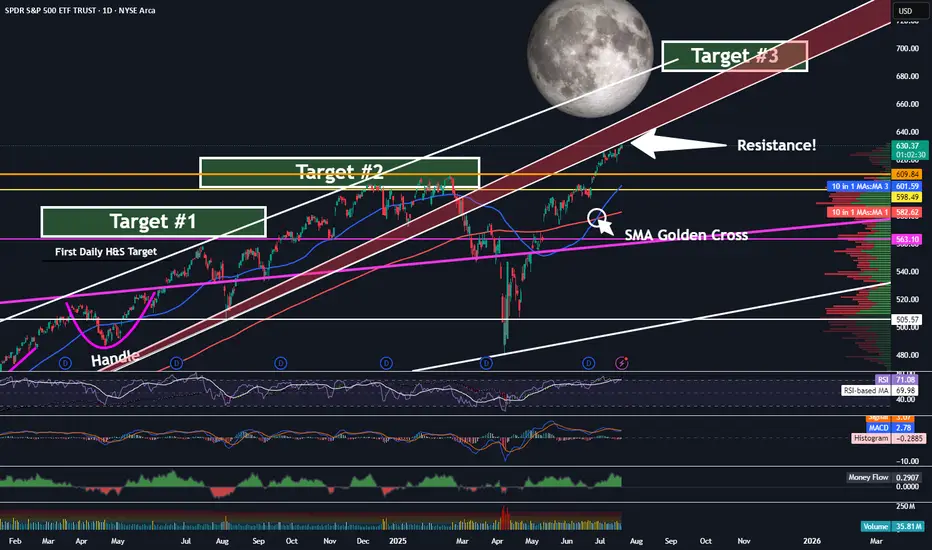
So, we began marking targets on our chart here after spotting an inverse H&S on the daily chart a few years ago. Many of my followers back then were doubtful the pattern would fully form, or if it did, that it would actually play out. But the pattern completed about 14 months ago and subsequently broke the neckline in June of last year. I then knew we were going full send and have been predicting a 700 SPY final target since. This target has been made utilizing both that inverse H&S pattern as well as a longer-trend Elliot Wave, which I don't have denoted here at this point. The chart gets too messy with all of my markings. Regardless, we are currently in wave 5 and heading steadily towards that 670-700 target #3, my final target.
But be careful! Today, we have hit the underside of that RED area, which is HUGE resistance. I would expect that we will NOT break straight through this without some pullback prior. Indeed, the market is overextended at this moment, and we'll need the volume to be able to push through. Could this occur? Of course, anything is possible. But, it is not likely right now.
My guess is that we'll at least pull back to one of those levels below us or possibly even re-touch that 200 SMA in red before the final push.
Anyways, it is worth taking note of what may be ahead of us in the next few weeks or months so that you can plan your trades accordingly. Stay with me. We're almost there.
✌️Stew
Snp500
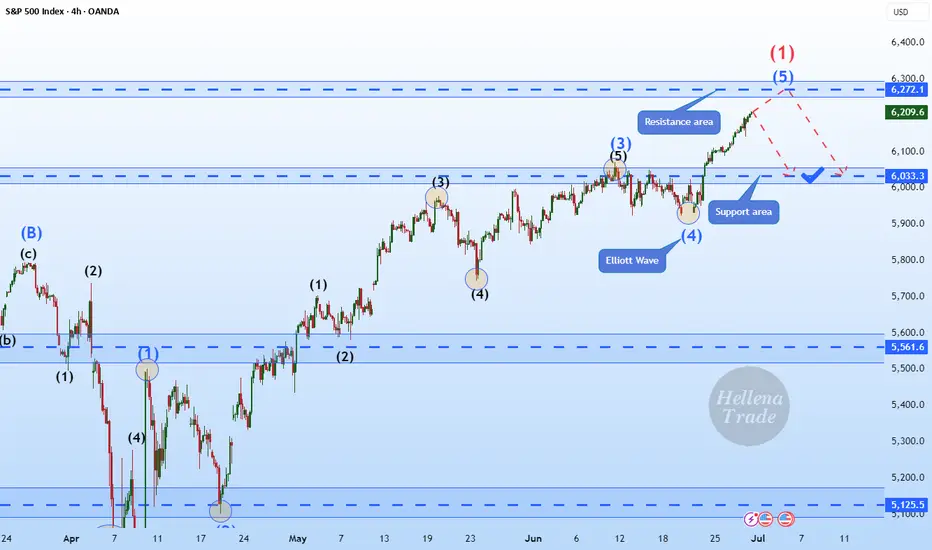
Hellena | SPX500 (4H): SHORT to support area of 6033.Colleagues, I assume that wave “1” completes the upward movement and somewhere around here a major correction ‘2’ should begin, which will consist of waves “ABC” and may continue to the level of 5700. But for now, I think we need to focus on the nearest targets.
I see the support area of 6033 as the first target.
Manage your capital correctly and competently! Only enter trades based on reliable patterns!
30/06/25 Weekly OutlookLast weeks high: $108,531.02
Last weeks low: $99,592.69
Midpoint: $104,061.86
Overall a positive week for BTC in isolation as price moves steadily all week reclaiming the losses made in the week from the 16th-23rd June. This comes after a $2.2B BTC ETF weekly inflow, the 3rd consecutive week of net inflows.
Having now hit the key S/R level of $108,500 it will be interesting to see where BTC goes from here. Jumping up above the level will require a lot from the bulls as ATH is within touching distance and so buying into major resistance is a tough ask. We also have Geo-political uncertainties to add to the situation, one bad tweet is all it takes sometimes to do a lot of damage.
On the other hand the SNP500 hits new ATH in the same conditions and so BTC is more than capable of doing the same.
So far in the first hours of this weeks trading we do have a SFP of the weekly high setup, not ideal for the bulls in any way and so from here the a retest of the range quarters, midpoint being the key area would make sense, invalidation would be a clean break above weekly high with acceptance and strong volume on the move to break the rangebound/choppy environment.
There is also the "window dressing" element to the months &quarter end today. History shows a de-risking going into these events and more money flowing back into risk-on assets in the days following monthly/ quarterly end. For that reason a bullish move (if there were to be one) would come later in the week IMO.
Good luck this week everybody!

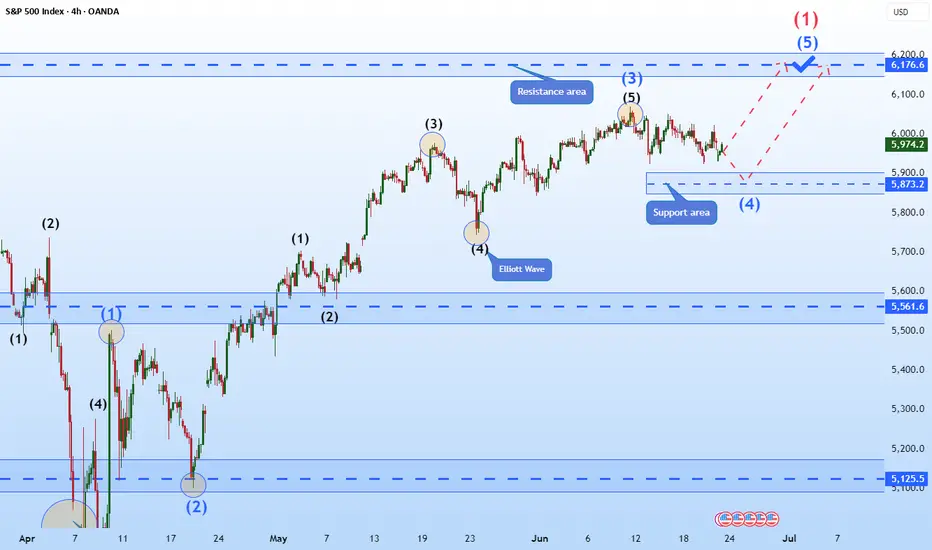
Hellena | SPX500 (4H): LONG resistance area of 6176 (Wave 1).Colleagues, the previous forecast remains essentially unchanged, and the target is still 6176, but I think the forecast can be updated because the price has been flat for quite some time.
I still expect the upward movement to continue in the large wave “1” and in the medium-order wave “5”.
A small correction to the support area of 5873 is possible.
Manage your capital correctly and competently! Only enter trades based on reliable patterns!
What Is The Market Waiting For?Good Morning Trading Fam,
Our stock and crypto markets seem to have stalled. You may be wondering what they are waiting for. Quite simply, the S&P 500 has reached a double-top. That's all. There may be some more pause here for the next week or so. Barring any significant bearish geopolitical or other events, I expect us to move higher. Any FUD at all will send the market back down again. So yes, unfortunately, the next move(s) will be mostly predicated on news. Traders are rather fragile rn. Trade accordingly.
Best,
Stew

Small Stocks vs. GoldThis index represents small caps minus big caps, divided by gold. A good representation of how small companies in USA are doing related to gold (hard asset). You could argue that this is more representing of real economy and it's health.

S&P 500 Index (SPX) Weekly TF – 2025
Chart Context:
Tools Used: 3 Fibonacci Tools:
1. One **Fibonacci retracement** (from ATH to bottom)
2. Two **Trend-Based Fibonacci Extensions**
* Key Levels and Zones:
* **Support Zone** (Fib Confluence): \~4,820–5,100
* **Support Area (shallow pullback)**: \~5,500–5,600
* **Resistance & TP Zones:**
* TP1: **6,450** (Fib confluence & -61.8%)
* TP2: **6,840** (-27%)
* TP3: **7,450–7,760** (Major Confluence)
Technical Observations:
* SPX is approaching a **critical resistance** near previous ATH (\~6,128) with projected upward trajectory.
* The **green dashed path** suggests a rally continuation from current \~6,000 levels to TP1 (\~6,450), TP2 (\~6,840), and eventually TP3 (\~7,450–7,760), IF no major macro shock hits.
* The **purple dotted path** suggests a potential retracement first to \~5,600 (shallow correction) or deeper into \~5,120 or even 4,820 zone before continuing the bullish rally.
* The major support zone around **4,820–5,120** includes key Fib retracement levels (38.2% and 61.8%) from both extensions and historical breakout levels.
Fundamental Context:
* US economy shows **resilience** amid soft-landing narrative, though inflation remains sticky.
* The **Federal Reserve** is expected to cut rates in **Q3–Q4 2025**, boosting equity valuations.
* Liquidity expansion and dovish outlook support risk assets, including **equities and crypto**.
* However, **AI-driven tech rally** may be overstretched; a correction could follow earnings disappointments or macro surprises (e.g., jobs or CPI shocks).
Narrative Bias & Scenarios:
**Scenario 1 – Correction Before Rally (Purple Path)**
* If SPX faces macro pushback (e.g., high CPI, hawkish Fed), expect retracement to:
* 5,600 = Fib -23.6% zone
* 5,120–4,820 = Major Fib Confluence Zone
* These would act as **accumulation zones**, setting up next leg up toward TP1 and beyond.
* **Effect on Gold**: May rise temporarily due to risk-off move.
* **Effect on Crypto**: Could stall or correct, especially altcoins.
**Scenario 2 – Straight Rally (Green Path)**
* If Fed confirms cuts and macro remains soft:
* SPX breaks ATH (\~6,128)
* Hits TP1 (\~6,450), TP2 (\~6,840)
* Eventually reaches confluence at **TP3 (7,450–7,760)**
* **Effect on Gold**: May struggle; investor preference for equities.
* **Effect on Crypto**: Strong risk-on appetite, altseason continuation.
Indicators Used:
* 3 Fibonacci levels (retracement + 2 extensions)
* Trendlines (macro and local)
* Confluence mapping
Philosophical/Narrative Layer:
This phase of the market resembles a test of collective confidence. Equity markets nearing ATHs while monetary easing begins reflect a fragile optimism. The Fibonacci levels act as narrative checkpoints — psychological as much as mathematical. Will we rally on faith or fall for rebalancing?
Bias & Strategy Implication:
Bias: Bullish with caution
* Strategy:
* Await **confirmation breakout >6,128** for fresh long entries
* Accumulate on dips in the **5,100–5,500** zone if correction unfolds
* Use **TP1, TP2, TP3** as staged exits
Related Reference Charts:
* BTC.D Analysis – Bearish Bias:
* TOTAL:Bullish Bias
*TOTAL3 – Bullish Bias:
* US10Y Yield – Falling Bias Impact:https://www.tradingview.com/chart/US10Y/45w6qkWl-US10Y-10-Year-Treasury-Yield-Weekly-TF-2025/

SPY (S&P500 ETF) - Price Attempting Breakout Above ResistanceSPY (S&P500 ETF) price is attempting to breakout above Daily resistance levels of $594 and $597.
SPY ETF has been in an uptrend since May 2025. A Golden Cross also occured on May 19th 2025, signaling that a potential longer term bullish rally could occur.
Friday's candle closed as a Doji signaling some potential indecision after recent price volatility.
SPY price is not at any extreme level on the Daily chart.
If SPY price ever gaps up and rallies up to the $612 to $620 resistance zone, price could sell off stronger (short-term).
In June 2025, trade deal and inflation news will most likely be the catalyst for further volatility, in addition to government news announcements.

S&P 500 in EUR - SHORT- in 15 days timeline
- broke the trendline that comes from 2020 to the downside
- retested and could not go above
- may try again and if fails again, then 25% correction likely

Hellena | SPX500 (4H): LONG resistance area of 6176.6.Colleagues, it appears that price has not yet completed the upward movement in a five-wave move.
At the moment I expect the continuation of wave “3” and reaching the target in the resistance area of 6176.6.
Manage your capital correctly and competently! Only enter trades based on reliable patterns!

#ES_F Weekly Prep 06.01 - 06.06.25Last week we have consolidated, built a cost basis under HTF Edge Top and made a push into new HTF Ranges Value on Wednesday after some news, we made it into the Mean of that range but failed to hold before the open trapping Supply in Value. Thursday held under the Edge and by Friday built up enough supply to flush Holiday Cost basis into lower Value where the selling stopped at the Mean and we started covering, being mid day Friday and End of Month we got strong enough covering to take us all the way back into the Edge/into current Intraday Ranges top which is around 930 - 25 Area.
Question for this week is, was that a strong bid on Friday which will give us a hold and continued pushes into above VAL over the Edge or was it just a retest of this Edge top from below, momentum traders pushed us out on news and now we are back inside 930 - 770s HTF Range ?
Looking at our structure, we had Trend Change on Thursday during RTH Open and for now we have closed Friday in downward correction Trend. This tells us that its possible that we have failed to accept inside new above HTF Range and if that is the case then we could target moves back down towards lower areas of VAH / Mean / VAL and if there will be volume moves under it.
For things to change and to see stability + strength out of here we would need to see a good push over 930s which could hold over AND see a move over 941 - 45 area, without that need to be careful with longs into those areas as our Supply and Sellers are around and over us.
Things have been slow and moves take a while to set up so Current Intraday Range could act as support and we can see price trade back and forth inside it with Holiday Cost basis providing Support, BUT if we do get through that under VAH then we can see further moves down towards Mean and VAL which has another cost basis there that we can try to fill out and it could hold the price around it, to see any more weakness from there we would need to find ourself under VAL and be able to get into that 800 Balance area, it is new Month and we do have Market Moving Data this week so it could happen.
If this will be the case good entry areas for continuation lower could be found around
914 - 10 // 900 - 896 // 869 - 65 // 855 - 51 careful around 824 - 20 and IF we attempt for move into lower Balance could find entries for it at 810 - 06
IF Trend does change and we hold over the Edge OR we hold Current Intraday Range and some of the weekly Data/News will push us over 941 - 45 then we could see moves into above VAL / Mean and would look for Entries around 955 - 59 // 986 - 90 if this will be the case need to be careful with looking for too much continuation over the Mean as there will be selling closer to above VAH we get and especially if we see pushes into/over it as there is more supply above, if move higher happens we would probably look to stay under 630 - 20s and If Holiday Cost Basis holds as Support the could also find long entries at 896 - 900 area after we hold under but need to be careful with looking for big moves and try to grab area to area as market moves and back fills very efficiently lately so watch out for back and forth trading while its moving towards targets.

SPY (S&P500 ETF) - Price Bounced Above Gap Support Zone - DailySPY (S&P500 ETF) price has bounced up from the $576 price support gap level.
EMA Golden Cross is still active, the yellow 50EMA crossed above the red 200EMA which could signal a longer term bullish rally.
SPY price has been in an uptrend since May 2025.
Resistance Levels: $594, $596, $600, $607, $613.
Support Levels: $581, $575, $572, $567, $564.
Tariff and trade deal news, corporate earnings, presidential and government law changes, inflation data, economic data, and consumer sentiment can all affect Stock and ETF prices.

Hellena | SPX500 (4H): SHORT to 38.2% - 50% Fibo lvl 5489.Colleagues, I have reviewed the waves a bit and I believe that when the strong psychological level of 6000 is reached, a reaction and correction in wave “2” is possible.
I propose to consider this movement as a strong five-wave movement. Wave “1” will be over soon.
I consider the 38.2% - 50% Fibonacci levels of 5489 to be the main target of the correction.
Manage your capital correctly and competently! Only enter trades based on reliable patterns!

SPY Will Keep Growing! Buy!
Hello,Traders!
SPY is trading in an uptrend
And the index made a retest
Of the key horizontal level
Of 579$ from where we are
Already seeing a bullish
Rebound so as we are
Bullish biased we will be
Expecting a further
Bullish move up
Buy!
Comment and subscribe to help us grow!
Check out other forecasts below too!
Disclosure: I am part of Trade Nation's Influencer program and receive a monthly fee for using their TradingView charts in my analysis.

ES1! (S&P500 Mini Futures) - Support Trendline Price Test -DailyES1! (S&P500 Mini Futures) price is currently testing a support trendline around $5900.
If several daily Price candles close below $5865 this month, a pullback in the price can occur (rising wedge pattern).
Volume has been decreasing in May 2025, compared to March and April.
Finance and Technology corporate earnings season has passed. The U.S. government 90-day tariff pause is set to expire in early July (pending trade deal negotiations with other countries).
Tariff and trade deal news, breaking news, corporate earnings, government law changes, consumer sentiment, inflation data, the FOMC, and presidential announcements can all affect the prices of stocks and ETFs.

GOLD Has Shown A Significant Bullish Move!!Gold Market Analysis
Over the past week, gold has shown a significant bullish move by touching its weekly bullish Fair Value Gap (FVG) and closing a candle above it. This price action serves as a strong indication that the market is currently exhibiting bullish momentum. However, it is important to note that the sustainability of this bullish trend will be confirmed only through future market developments and price behavior.
As of now, our analysis suggests that gold, after revisiting and respecting the weekly bullish FVG, is trending upward. Looking ahead, we anticipate a minor retracement in the short term. This pullback could provide a healthy opportunity for the market to gather momentum before making another move upward. Ideally, we expect the price to retrace slightly and re-enter the highlighted yellow zone. Within this zone, we will be watching for a Market Structure Shift (MSS), which would act as our confirmation signal to consider entering a long position.
Once confirmation is received through MSS or similar price action cues, our strategy would be to target the liquidity zones situated above the current price level. It is also worth mentioning that the market has already cleared liquidity on the sell-side, which further strengthens the bullish case. Based on current technical indications and liquidity structure, there is a high probability that gold could reach as high as $3,250 in the upcoming sessions.
That said, market conditions can evolve rapidly, and it is essential to monitor price action closely. Traders and investors are strongly advised to conduct their own research (DYOR) and await clear confirmations before making any trading decisions. Staying vigilant and informed will be key to capitalizing on potential bullish movements in the gold market.

SPY BULLISH BREAKOUT|LONG|
✅SPY is trading in an
Uptrend and the index
Made a bullish breakout
Of the key horizontal level
Of 580.00$ and the breakout
Is confirmed so we will be
Expecting a further move up
LONG🚀
✅Like and subscribe to never miss a new idea!✅
Disclosure: I am part of Trade Nation's Influencer program and receive a monthly fee for using their TradingView charts in my analysis.

SPY (S&P500 ETF) - Testing Key Resistance Levels - Weekly ChartSPY (S&P500 ETF) is currently attempting an uptrend rally, bouncing up from the April 7th 2025 support level ($488) and weekly support trendline.
The current resistance price level is $569 above, and the support price level below is $555.
SPY price needs to remain and close above $522 in May 2025 to maintain the current uptrend rally.
Resistance price targets above: $569, $578, $600, $610.
Support price targets below: $555, $542, $533, $512.
Tariff and trade deal news, corporate earnings, government law changes, and consumer sentiment will continue to affect the stock price action of SPY.
Support price levels need to hold for an uptrend to continue in 2025.

MES1!/ES1! Day Trade Plan for 05/06/2025MES1!/ES1! Day Trade Plan for 05/06/2025
📈 5625 5638 5650
📉 5614 5602 5590
Thanks to all my followers! Truly appreciate the support!
Please like and share for more ES/NQ levels Tues & Thurs 🤓📈📉🎯💰
*These levels are derived from comprehensive backtesting and research and a quantitative system demonstrating high accuracy. This statistical foundation suggests that price movements are likely to exceed initial estimates.*

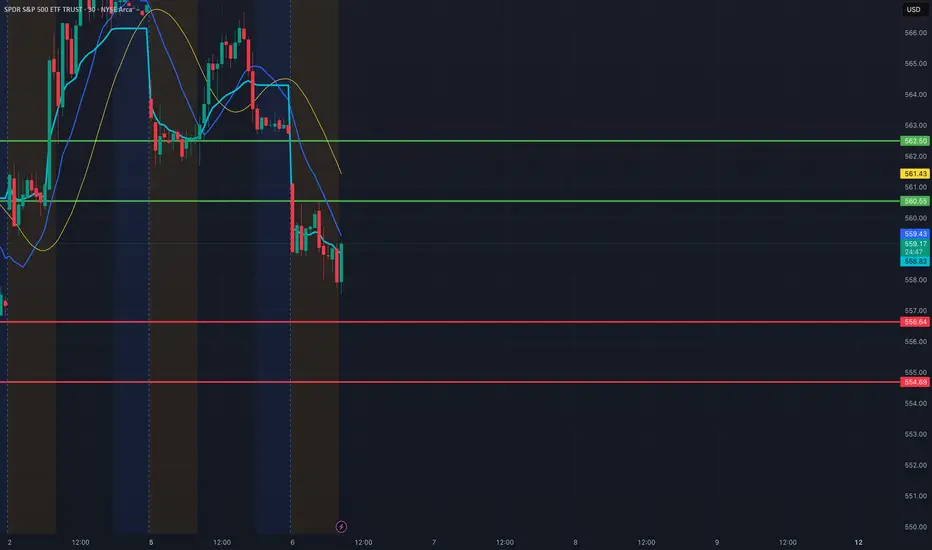
SPY Day Trade Plan for 05/06/2025SPY Day Trade Plan for 05/06/2025
📈 560.55 562.50
📉 556.64 554.69
Thanks to all my followers! Truly appreciate the support!
Please like and share for more ES/NQ levels Tues & Thurs 🤓📈📉🎯💰
*These levels are derived from comprehensive backtesting and research and a quantitative system demonstrating high accuracy. This statistical foundation suggests that price movements are likely to exceed initial estimates.*
Technical Analysis for FX,Indices and many More!(5May-9May2025)Hello fellow traders , my regular and new friends!
Which pairs or instruments should we keep a look out for?
For me I am looking at :
GbpAud and probably EurAud for shorts
BTC likely to continue upwards move
Majors to turn lower against USD
Precious metals like copper and silver to bear more, Gold too.
This coming week is packed with interest rate decision, how?What to do?
Do check out my recorded video for more insights!
Do Like and Boost if you have learnt something and enjoyed the content, thank you!
-- Get the right tools and an experienced Guide, you WILL navigate your way out of this "Dangerous Jungle"! --

SPY Day Trade Plan for 05/01/2025SPY Day Trade Plan for 05/01/2025
📈 562.70 565.60
📉 557 554.30
Thanks to all my followers! Truly appreciate the support!
Please like and share for more ES/NQ levels Tues & Thurs 🤓📈📉🎯💰
*These levels are derived from comprehensive backtesting and research and a quantitative system demonstrating high accuracy. This statistical foundation suggests that price movements are likely to exceed initial estimates.*

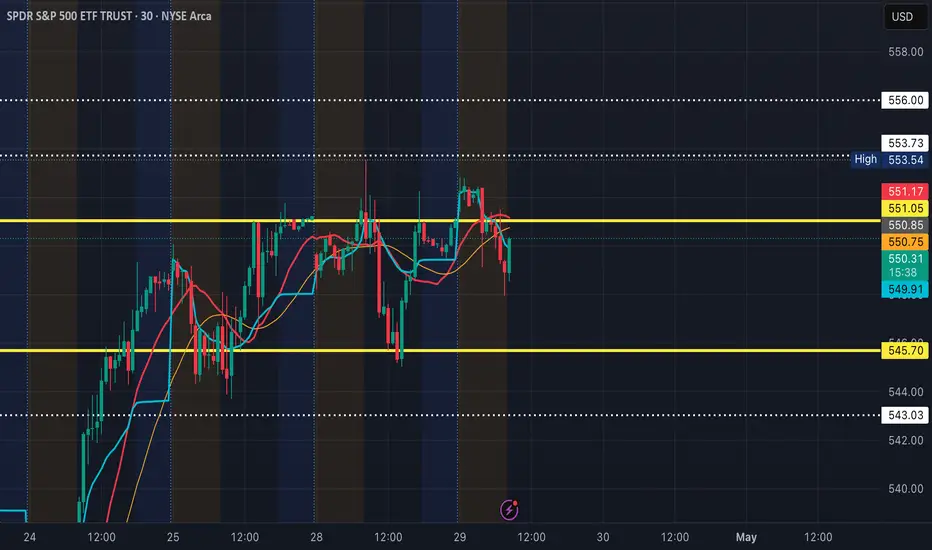
SPY Day Trade Plan for 04/29/2025SPY Day Trade Plan for 04/29/2025
📈 550 553 556
📉 544 543 540.50
Thanks to all my followers! Truly appreciate the support!
Please like and share for more ES/NQ levels Tues & Thurs 🤓📈📉🎯💰
*These levels are derived from comprehensive backtesting and research and a quantitative system demonstrating high accuracy. This statistical foundation suggests that price movements are likely to exceed initial estimates.*