SNR

Ethereum is getting ready for the pumphello traders
I saw this scenario happen. It happens a lot in the markets where we have a support and resistance area, then we get a false break and the price goes up and the process of accumulation begins after that, the liquidity is expelled and the price retests the support area and rises strongly
You can see a similar opportunity I shared before on the usd chf currency pair


USD JPY SHORT resistance level
price action
reflection signal
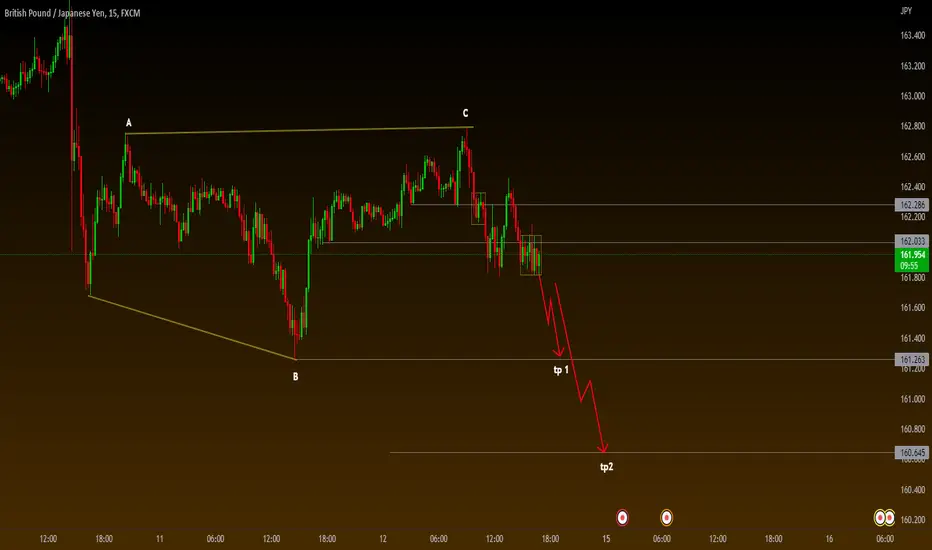
wave analysis
demand zone ( target)
trend line break out


Long1 divergence detected in 1h timeframe
2 dominant break sell in 30 min timeframe
3 Fib lvl close to previous supply and demand
4 fib lvl and supply and demand close to aupport and resistance
2 possible entries where price will do a reversal or pullback


OP / USDT SHORT (Do not buy on top) hey traders
The distribution has begun, the price has reached its peak. Buying the cryptocurrency now means buying at the top. It is the time to open a short position


XAUUSD SHORT hey traders
The last wall of buyers has been broken The price is now in a range Gold can be sold with the range being broken by sellers

Bitcoin crash!!hey traders
There is a signal of a reversal on Bitcoin that may break the bottom or form a major correction in both cases, there is a drop, the closest possibility to break the bottom
But the range must be broken hard to sell bitcoin

A new high for AUD/ JPY hey traders
Watch the aud/jpy pair for a long-term buying opportunity wait for a range and broken by buyers above 93.929
To activate the trade

