SNXUSDT Breakout Alert! Are We Witnessing the Early Stages?📌 🔍 Overview:
After months of relentless downward pressure, SNX has finally shown a strong technical breakout. The price has decisively broken above the long-term descending trendline, signaling a potential shift in structure from bearish to bullish. This could mark the beginning of a significant impulse wave to the upside.
📐 📊 Technical Structure & Key Pattern Breakdown:
🔻 Broken Downtrend Line: Price action has successfully broken above a descending trendline that has been in place since December 2024, effectively ending the bearish dominance.
🔺 Falling Wedge Pattern: A classic falling wedge has formed and recently completed with a confirmed breakout — a bullish reversal pattern that often precedes strong upside momentum.
🟨 Accumulation Zone (Base Support): The yellow box between $0.60 – $0.72 acted as a major accumulation zone and now flips into a strong demand/support area.
📈 Higher Lows Structure: The recent structure of higher lows signals a shift in market sentiment, showing early signs of accumulation and bullish interest.
✅ Bullish Scenario (Upside Continuation):
If price holds above the breakout zone and confirms strength:
🎯 Target 1: $0.938 (key horizontal resistance)
🎯 Target 2: $1.042 – $1.100 (historical resistance zone)
🎯 Target 3: $1.248 – $1.625
🎯 Target 4 (Mid-term rally): $1.966 – $2.197
🏁 Final Bullish Target (Longer term): $3.372 – $3.686
A strong continuation would require confirmation via increased trading volume and bullish momentum from the broader crypto market.
❌ Bearish Scenario (Failed Retest or Rejection):
However, if the price fails to sustain above the breakout level:
🚨 Risk of a false breakout emerges if price falls back below $0.724
🔻 Breakdown of the yellow support box could trigger a deeper correction toward:
Support 1: $0.60
Support 2 (Major Low): $0.480
This would form a classic bull trap and extend the consolidation phase.
⚠️ Validation & Risk Considerations:
Volume confirmation is key. A breakout without rising volume may lack follow-through.
Watch closely for price action in the coming days — will it hold above the breakout zone or fall back?
Strategy: Look for retest entries or enter with partial exposure, using tight risk management.
🧠 Conclusion:
SNXUSDT is at a pivotal turning point. The breakout from a falling wedge pattern combined with higher low formations is a textbook bullish reversal setup. If price holds and buyers step in, we may be witnessing the early stages of a major bull run for SNX.
#SNXUSDT #SNXBreakout #AltcoinSetup #BullishReversal #FallingWedge #CryptoSignals #CryptoTrading #ChartAnalysis #PriceAction
SNX

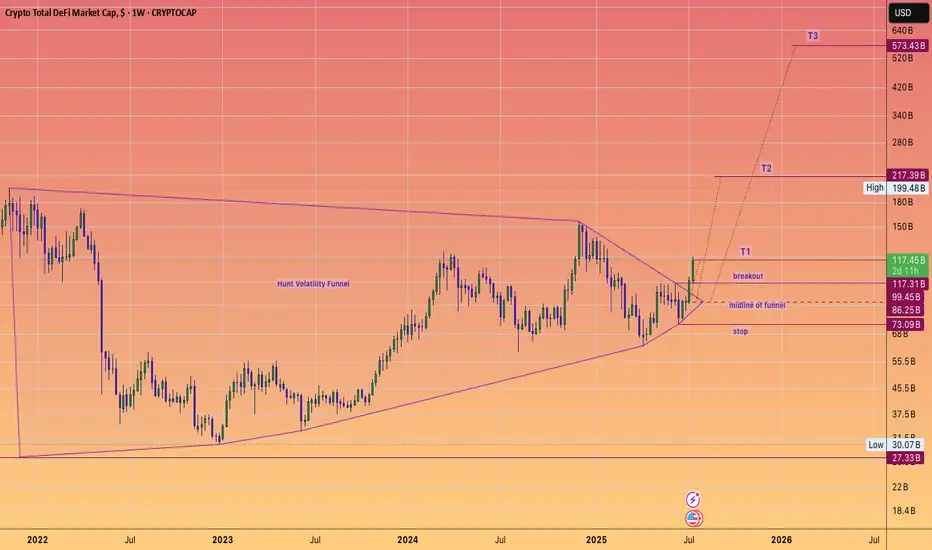
DeFi Moonshot! Moon mission to $573 Billion dollars!DEFI fuelled by Ethereum, built on proven protocols and stablecoin legislation is ready to keep cranking higher for the rest of the year. And instead of a Defi summer of emergence (2020), a multi season of adoption that takes it to half a trillion dollars, hitting these targets of a #HVF
@TheCryptoSniper
The components set to benefit are:
Uniswap #UNI ~ $12.3 Billion
Lido DAO #LDO ~ $9.1 Billion
Aave #AAVE ~ $7.5 Billion
MakerDAO #MKR ~ $4.6 Billion
GMX #GMX ~ $2.5 Billion
Curve #CRV ~ $1.9 Billion
Synthetix #SNX ~ $1.1 Billion
Pulsex #PLSX ~ $0.46 Billion
Key points:
The #TotalDefi index is currently at $117B aligning closely with the $123.6B of TVL
As we see hundreds of billions of dollars get digitized watch this index climb onwards and upwards... With $1 Trillion dollars and obvious milestone that is surely set to be met ... one day.
SNX/USDT Short-Term Trade | Entry at 0.627 with Clear TargetsMidterm/Intra-day Setup
This is an intra-day (midterm) trading setup.
Entry Price: 0.627
Take Profits (TPs): Refer to the marked levels on the screen for target points.
Stay disciplined and manage your risk accordingly.

SNX About to Explode or Collapse?Yello Paradisers, are you watching SNXUSDT closely? Because if not, you might be missing one of the cleanest opportunities for bulls in this current market cycle. The setup is forming right at a critical decision point — and how price reacts here could define the next major move.
💎SNXUSDT is currently showing a bullish internal CHoCH (Change of Character) while trading directly inside a strong support zone. This zone isn’t just standing alone — it’s backed by the powerful 200 EMA and a well-respected support trendline. This confluence of support significantly increases the probability of a bullish bounce from this level, making it a high-reward setup for those paying attention.
💎Zooming out to the higher timeframe, the structure becomes even more interesting. SNXUSDT appears to be forming a bull flag pattern — a bullish continuation signal that often precedes explosive upside moves. When such a formation aligns with key support zones, it suggests that the market is simply consolidating before the next leg up.
💎However, traders must proceed with caution. If price breaks down and closes below the current support zone, this would invalidate the entire bullish scenario. In such a case, it’s best to step aside and wait for better confirmation rather than rushing into a compromised setup. Emotional decisions are the fastest way to ruin sound trading strategies.
🎖Strive for consistency, not quick profits. Treat the market as a businessman, not as a gambler. Discipline, patience, and strategic entries will always outperform emotional trades. Stay focused, Paradisers — the opportunity will always favor those who are prepared.
MyCryptoParadise
iFeel the success🌴

SNXUSDT 1D Analysis SNX ~ 1D Analysis
#SNX Buy after successfully breaking this resistance line with a short term target of at least 15%+ from here.

#SNX/USDT#SNX
The price is moving within a descending channel on the 1-hour frame, adhering well to it, and is heading for a strong breakout and retest.
We are seeing a bounce from the lower boundary of the descending channel, which is support at 0.827.
We have a downtrend on the RSI indicator that is about to break and retest, supporting the upward trend.
We are looking for stability above the 100 moving average.
Entry price: 0.880
First target: 0.900
Second target: 0.943
Third target: 0.977

#SNX/USDT#SNX
The price is moving within a descending channel on the 1-hour frame, adhering well to it, and is heading for a strong breakout and retest.
We are seeing a bounce from the lower boundary of the descending channel, which is support at 0.711.
We are seeing a downtrend on the RSI indicator that is about to break and retest, supporting the upward trend.
We are looking for stability above the 100 Moving Average.
Entry price: 0.744
First target: 0.765
Second target: 0.785
Third target: 0.811

SNXUSDT Bouncing from Channel SupportSNXUSDT Technical analysis update
SNXUSDT has been trading inside a clear descending channel for the last 1700 days. Recently, the price touched the lower support of the channel and is now showing signs of a bounce.
If the current momentum continues, SNX could move upward toward the upper resistance of the channel. A breakout above the upper trendline would be a strong bullish signal. Until then, the price may stay within the channel.
Price could move 100%-250% in a few months.

SNX Analysis (1D)SNX has broken an old trigger line and is also forming a CP within a channel.
We are looking for buy/long positions in the Demand zone.
Targets are marked on the chart.
A daily candle closing below the invalidation level will invalidate this analysis.
Do not enter the position without capital management and stop setting
Comment if you have any questions
thank you

SNX Price ActionSNX is reporting its earnings tomorrow so below would be my estimated target.
It is expected to go as high as $132 and if the market supports could go higher .
Respecting all demand zones and expecting to eventually reach as high as $143

Is SNXUSDT About to Make a Big Move? Yello, Paradisers! SNXUSDT has shown an ideal retracement, setting up a high probability for a bullish bounce from the current support zone.
💎There’s potential for a W-pattern formation here. If the price successfully breaks out and closes candle above the resistance level, this would significantly increase the likelihood of a bullish continuation.
💎However, while a bullish move is possible, the probability at this stage is relatively low, making it a scenario worth watching but not acting on just yet.
💎If panic selling or a deeper retracement occurs, the strong support zone below may offer a favorable bounce. To increase confidence in this setup, we need to see a bullish I-CHoCH (internal change of character) on lower timeframes.
💎On the flip side, if SNXUSDT breaks down and closes candle below the strong support zone, the bullish thesis will be invalidated. In that case, it’s best to remain patient and wait for more favorable price action to develop.
🎖Always remember, Paradisers, discipline and patience are the keys to consistent profitability. Avoid making emotional decisions and stick to your strategy. The market rewards the patient!
MyCryptoParadise
iFeel the success🌴

SNXUSDT 1WSNX ~ 1W
#SNX If you still have Conviction on this coin,. Buy gradually on this support block with a minimum target of 20%+

SNXUSDT 1WSNX ~ 1W
#SNX If you still have Conviction on this coin,. This support block will be a very good buying place for now. buy from here with a minimum target of 20%+

SNX LongThe Accumulation Phase (2023-2024) is marked on the chart, showing a period of consolidation where price moves within a range. This phase indicates that buyers and sellers are reaching equilibrium, setting up a strong foundation for future price movement.
The Demand Zone (2025) is represented by the blue dashed area, a key level of support where price could experience a bounce. This zone is crucial as it could offer an entry point for long trades before a potential breakout.
The chart projects a Bullish Breakout (2025 and beyond) , where the price is expected to rise significantly after the accumulation phase.
Potential Target: The price is projected to rise significantly after the breakout, potentially reaching targets as high as $16 based on the breakout from the demand zone.
Overall Outlook: The chart suggests a well-planned accumulation phase with a likely bullish breakout in 2025. Keep an eye on the demand area for potential entries and watch for upward momentum as price breaks above key resistance levels.

#SNX/USDT#SNX
The price is moving in a descending channel on the 1-hour frame and is expected to continue upwards
We have a trend to stabilize above the moving average 100 again
We have a descending trend on the RSI indicator that supports the rise by breaking it upwards
We have a support area at the lower limit of the channel at a price of 2.16
Entry price 2.20
First target 2.24
Second target 2.31
Third target 2.40

#SNX/USDT
#SNX
We have a bearish channel pattern on a 12-hour frame, the price moves within it, adheres to its limits well, and is expected to break it upwards strongly.
We have a support area at the lower border of the channel at $2.50 from which the price rebounded
We have a tendency to stabilize above moving average 100
We have a downtrend on the RSI indicator that is about to break higher, supporting the price higher
Entry price is 2.60
First goal 3.26
The second goal is 3.60
The third goal is 4.20

TRADE SNX...Hello friends
According to the upward trend, it is expected that the specified range is a good range for buying, the loss limit and the profit limit are also specified.
This analysis is only reviewed from a technical point of view.
Don't forget capital management, friends.

SNXUSDT Signals Bullish Move AheadSNXUSDT Technical analysis update
BINANCE:SNXUSDT has been ranging at the bottom for the last 120 days. The price has now broken out above the resistance line with high volume and is trading above the 100 EMA, signaling a bullish trend. This breakout indicates the potential for a strong bullish move in the coming days.
Buy zone : Below $1.77
Stop loss : $1.50
Take Profit 1: $1.99
Take Profit 2: $2.40
Take Profit 3: $3.30
Thank You
Hexa🧘♀️

Synthetix (SNX)Synthetix is a decentralized liquidity pool provision protocol where users can borrow liquidity at low fees. Anyway, after a huge rise, SNX has been in a downtrend for a while. Recently, SNX broke the downtrend line as well as the minor one. Let's see how far SNX can go.

SNX buy setup (12H)SNX seems bullish. We have iCH on the chart and important trigger lines have been broken and it has stabilized on the upper orderblock range.
By keeping the last OB, you can move towards the targets.
Closing the daily candle below the invalidation level will violate this analysis.
Do not enter the position without capital management and stop setting
Comment if you have any questions
thank you

SNX looks ready tooLot of great setups on the market now... lot of super bullish structures and SNX is one of them.PA and TA is pure bullish. Target red MA. GL. If you have any questions, let me know in comments.
NOT A FINANCIAL ADVICE + MANAGE YOUR RISK AND USE STOPLOSS

SNX (Synthetix): Falling WedgeTrade setup : Price is in a downtrend, however, it's trading in a Falling Wedge pattern, which typically resolves in a bullish breakout and a trend reversal. We wait for such a breakout.
Patterns : Falling Wedge Usually results in a bullish breakout. When price breaks the upper trend line the price is expected to trend higher. Emerging patterns (before a breakout occurs) can be traded by swing traders between the convergence lines; however, most traders should wait for a completed pattern with a breakout and then place a BUY order. Learn to trade chart patterns in Lesson 8.
Trend : Short-term trend is Strong Down, Medium-term trend is Strong Down and Long-term trend is Strong Down.
Momentum is Bearish but inflecting. MACD Line is still below MACD Signal Line but momentum may have bottomed since MACD Histogram bars are rising, which suggests that momentum could be nearing an upswing. Price is neither overbought nor oversold currently, based on RSI-14 levels (RSI > 30 and RSI < 70).
Support and Resistance : Nearest Support Zone is $1.00. Nearest Resistance Zone is $1.85, then $2.50.

SNX mid-term analysisSNX is trading below a bearish trend line.
The big SNX structure is completely bearish.
It is expected to reach the demand range in the medium term and then move upwards.
We are looking for buy/long positions in the demand range.
Closing a weekly candle below the demand range will violate the analysis.
Note that the financial market is risky, so:
Do not enter a position without setting a stop and capital management and confirmation and trigger.
When we reach the first TP, save some profit and try to move the stop continuously in the direction of your profit.
If you have any comments please post them, comments will help us improve our performance
Thanks
