SNXUSDTBINANCE:SNXUSDT SHORT
⚠️Note:
In this type of signals, only the entry point and trade direction are specified, and stop loss and target are not determined.
If you are interested in entering these signals, please provide a stop loss and a logical market-based target.
⛔"Daily crypto market analyses I provide are personal opinions & not financial advice. Trading carries risks, so do your own research & seek advisor's help.#DYOR"
Don't forget to like and comment
SNXUSD

SNXUSD ❕ inverted hammerOn 4H price formed an inverted hammer.
The chart has fixed under the 50EMA on 4H TF.
RSI is moving in the sellers zone.
I think that SNX will continue to decline.

Synthetix Network token SNX price starts a difficult upward moveRecently, SNXUSDT price has finally managed to break out of a prolonged downtrend.
We assume that the current local price consolidation outside of the downtrend is coming to an end. And the SNX price may have quite a bit of growth ahead.
Take profit 1 - $3.55 (+25%)
Take profit 2 - $3.85 (+35%)
Take profit 3 - $4.40 (+55%)
_____________________
Did you like our analysis? Leave a comment, like, and follow to get more

SNXUSD: Bullish but approaching a Resistance. Trade breakout or SNXUSD is haveing the strongest two week streak since July 25th 2022, whose High formed R2 (4.4450). The R/R in buying that deep into the bullish wave is not favorable as despite the R1 at 3.3900, the price has the 1W MA200 as its main Resistance, which has not allowed weekly candle closings above it for 11 months (since August 15th 2022).
Consequently with the 1D time-frame highly overbought (RSI = 76.564, MACD = 0.230, ADX = 34.978), we will wait for a buy either after a pullback to the 1D MA50 or after a 1W candle closes over the 1W MA200. Either way, our long term target is the R2 (TP = 4.4450).
Keep in mind that the bullish trend on the long term is favored as the 1W MACD completed a Bullish Cross last week, under the 0.00 level, which shows significant upside potential.
## If you like our free content follow our profile to get more daily ideas. ##
## Comments and likes are greatly appreciated. ##

SNXUSDTGood time friends, we are at your service with another analysis, this time #snx
⚡️ with 150% growth probability
We have provided you with the daily chart of this index; The pattern you see in the chart is called "Diagonal Reverse Header". This pattern is one of the strongest bullish patterns.
The yellow line also shows the possible movement and temporary corrections of this index.
You can see that the collar of this pattern is broken and it is a signal for buyers. Risk-taking people can enter the purchase now, and low-risk people can also wait for a pullback on the collar of this pattern.
The loss limit of this transaction is 2.47
Maximum profit 8.1
Risk to return 8
⚠️ Note that this transaction and analysis is intended for spot.
Be successful and profitable

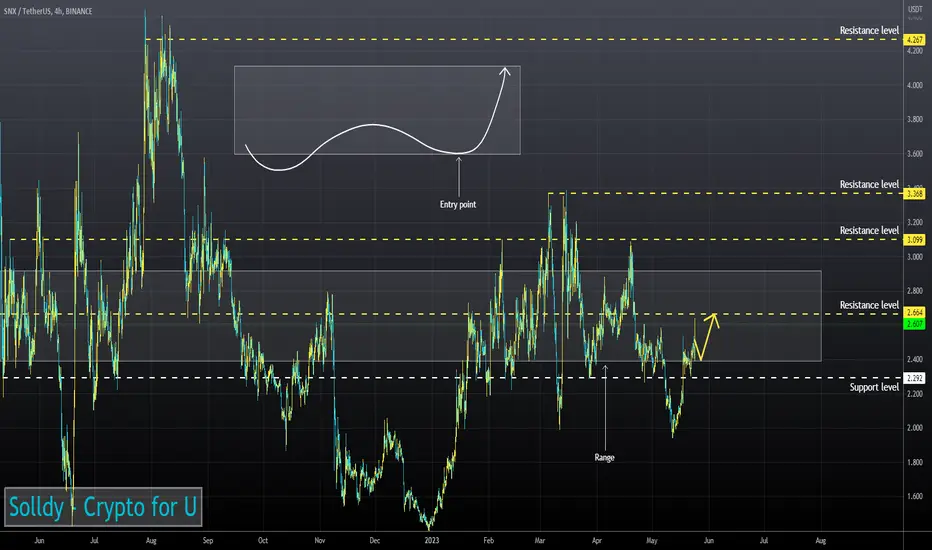
Safe entry after defeating the blue boxConsidering that this currency has come out of its downward channel, the possibility of a growth of up to 34% for this currency is not far from expected, but the condition for entering a long position is to break the resistance range in the blue box.
But if we do not see a positive reaction to break this range, it is possible to return to the support price which is 17% lower.
Follow us to make us happy

SNX Short 2.5RRThe price tested the strong resistance in the 2.8 range. Got rejected. The volume traded began to decrease. I am expecting the price to decrease to 2.4 level


SNXUSD Gave a major break out buy signalSynthetix / SNXUSD crossed today over not just the 4 month Channel Down but also the 1 year Falling Resistance (since the July 28th 2022 High) and the 1day MA200.
That is the strongest break out buy signal we could get on the medium term as despite stopping at Resistance A, it is repeating the rise of January, which after getting the 1day RSI overbought, it formed a Channel Up and peaked near the 1.5 Fibonacci level.
Buy now and target the new 1.5 Fibonacci at 3.70000.
Follow us, like the idea and leave a comment below!!

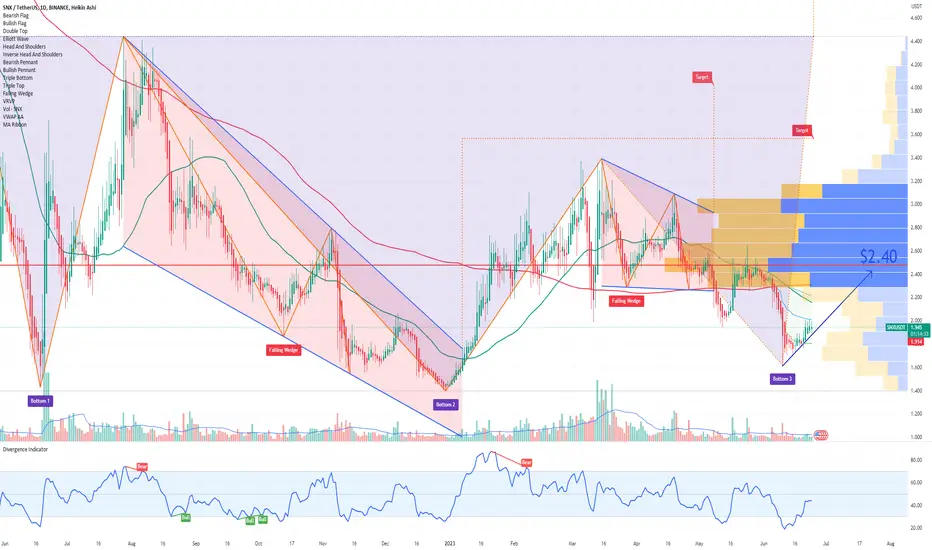
SNX Synthetix Triple BottomSNX (Synthetix) has recently formed a triple bottom pattern, indicating a potential bullish reversal in the near term. The triple bottom pattern is characterized by three successive lows at approximately the same level, followed by a potential breakout to the upside. This pattern often signifies a strong support level and can foreshadow a price rally.
Considering the formation of the triple bottom pattern, SNX may be poised for a potential price target of $2.40. This target represents the potential upside that could be achieved if the pattern plays out as anticipated.
Looking forward to read your opinion about it!
SNXUSD at the top of the 3 month Channel Down.SNXUSD hit today a triple Resistance Zone, the top of its 3 month Channel Down, the MA100 and the MA200 (1d).
Until the price closes over the Channel Down, the trend remains bearish.
Trading Plan:
1. Sell on the current market price.
2. Buy above Resistance (1).
Targets:
1. 2.000 (Rising Support).
2. 3.000 (Resistance 2).
Tips:
1. The RSI (1d) hit its Rising Resistance. If broken it will be a first sign that the Channel Down may break upwards. Also this is a bullish divergence as it is the opposite of the Falling Resistance of the Channel Down.
Please like, follow and comment!!

SNX is about to explode!Hello, everyone!
While CRYPTOCAP:BTC is in sideways it's time for altcoins to recover their prices. Yesterday my coin of the day was BIST:LINK , today is time for NYSE:SNX . In my opinion the increased Bitcoin dominance should be allocated to altcoins in the upcoming days/weeks.
Lets take a look at the SNXUSDT price chart. Like other altcoins this asset is showing the correction ABC is wave 4 of any degree. Waves A and B have been already finished in my opinion and now price is finishing the wave C. This wave is so imulsive which allows us to see some nice gains. Wave C usually consists of 5 Elliott waves cycle. I think that wave has just been finished. Of course wave 3 was not so large, but longer then wave 1. Wave 4 has still not overlapped the wave 1 top. It means that the main axiom has not been violated.
Wave 4 has the original target is zone between 0.38 and 0.5 Fibonacci retracement of the wave 3. Price has reached this level exactly. I decided also to apply the FibDiv trading strategy in conjunction with waves.
If price bounces from this Fibonacci zone we shoud wait the the next impulse (in our case wave 5) in the resistance area which is marked as the red box. Therefore, first target is located at $2. But taking in account that wave 3 was not extended wave 5 can be extended. In such cases we have the second target at -0.618 Fibonacci projection. Now it's located at $2.15. After this pump I expect new deep dive.
Best regards, Ivan
____________________________________________________________
🔥Please, follow me and smash the rocket🚀 button to support me🔥

SNX UPDATE (4H)The chart shows signs of further upswings. Keeping the green area, we have two TPs that I have marked on the picture

SNXUSD ❕ trading in the rangeThe SNX is back in the liquidity zone.
The RSI chart is moving in the buy zone (4H, 1H and 30m TFs).
50EMA has broken up 200EMA on the 4H Timeframe.
Price has fixed above 50EMA on the 1H Timeframe.
I believe the asset will continue to rise after holding the lower range boundary.
SNX ANALYSIS (6H)Hi, dear traders. how are you ? Today we have a viewpoint to BUY/SELL the SNX symbol.
For risk management, please don't forget stop loss and capital management
When we reach the first target, save some profit and then change the stop to entry
Comment if you have any questions
Thank You

snx long 🪐snx
🟢long
💲max capital 2%
🛑max lev 20
🟩enter 1 : 2.569
🟥stop : 2.483
✈️tp
✈️2.655
✈️2.741
✈️2.827
✈️2.913
✈️2.999
✈️3.055


SNX CAN MAKE A CORRECTIONHi, dear traders. how are you ? Today we have a viewpoint to SELL/SHORT the SNX symbol.
For risk management, please don't forget stop loss and capital management
When we reach the first target, save some profit and then change the stop to entry
Comment if you have any questions
Thank You

SNX price has growth prospects for at least x2-x3. Where to buy?Last week, buyers of SNX were very active and managed to organize a +70% increase.
This is a good result, but they still failed to break through the trend line that has been stretching since the beginning of 2021 and consolidating price above it.
(If you narrow the chart, you will see the entire trading history of SNXUSDT)
And although it was not possible to break above the trend line, this maneuver indicates that we need to monitor SNX more carefully.
If you asked us where it is safe to buy SNX in your medium or long-term investment portfolio, we would answer:
if the SNXUSDT price does not fall below $2.20 in the coming days/weeks, it is a strong long.
Or wait for SNX buyers to break through the upward trend line and gain a foothold above $3.15
The choice is yours)
_____________________
Did you like our analysis? Leave a comment, like, and follow to get more


SNXUSD Steady bullish breakoutSNXUSD crossed over the Bear market's Falling Resistance for the 2nd time this month on a clear long term bullish signal.
It is already 3 weeks after the Golden Cross (1d) formation.
Trading Plan:
1. Buy on the current market price.
Targets:
1. All Fibinacci retracement levels on by one up to 9.000 (Fibonacci 0.618, the Golden ratio).
Tips:
1. The MACD (1d) is on a Rising Support. Indicating a tend shift to long term bullish.
Please like, follow and comment!!

SNX : INCREASE VIEWSNX is also one of the coins that will get a follow for the next 24H to see if it's able to confirm.

SNXUSDT IdeaSNXUSDT - SNXUSD BINANCE:SNXUSDT
✅ ✅ Risk warning, disclaimer: the above is a personal market judgment and analysis based on published information and historical chart data on The trading view,
And only some of these analyzes are my actual real trades.
I hope Traders consider I am Not responsible for your trades and investment decision.
