Sofi

$sofii've actually been eying this stock for maybe a month now, i dont short or play puts so i waited patiently for entry. today i bought 400 shares and i am looking for this to make highs back to $22-$25. sofi seems to have a good army of investors and institutional holders. this could become a long term hold if bank charter news creeps closer anytime soon!

SOFI moving from bottomMassive flow coming into 07/15
Could have found a bottom
R:R is great and worth getting in at any pullback
[stock] SoFi - SOFI - Tell its not going to do it again! SoFi - SOFI - Tell its not going to do it again! What is the likelihood that SOFI will bounce again? Is it possible? What do you think? Edutainment Purposes Only!

SOFI, 4 Hours, Shark Analysis 2 SOFI, 4 Hrs Shark Shape. Analysis II
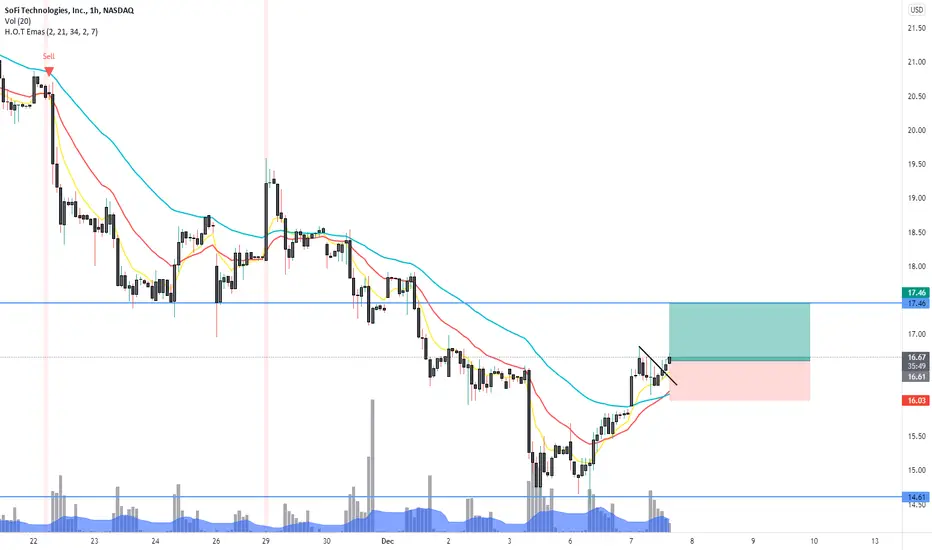
Buy between 16.15 - 15.60.
Buy between 14.67 - 13.12
Target I : 17.57 , Target II: 20.30
STOP LOSS @ 12.51
------------------------------
DISCLAIMER:
I am not a financial or investment advisor. All information found here, including any ideas, opinions, views, predictions, forecasts, commentaries, suggestions, or stock picks, expressed, or implied herein, are for entertainment purposes only and should not be construed as personal investment advice. If you decide to invest, please make your own decision, or contact the specialists’ institutions. Thank you

SOFI, 4 Hours, Shark NASDAQ:SOFI
SOFI, 4 Hrs Shark Shape.
Buy between 16.15 - 15.60.
Target I : 19.08, Target II: 21.21
STOP LOSS @ 14.21
DISCLAIMER:
I am not a financial or investment advisor. All information found here, including any ideas, opinions, views, predictions, forecasts, commentaries, suggestions, or stock picks,
expressed, or implied herein, are for entertainment purposes only and should not be construed as personal investment advice. If you decide to invest, please make your own decision,
or contact the specialists’ institutions. Thank you

Beautiful TA on SoFiTechnical Analysis has been a hobby of mine for a few years now, and charts like this one really get me going.
DISCLAIMER: THESE ARE STRICTLY MY OPINIONS ON THIS DATA. THERE ARE MANY DIFFERENT OPINIONS, THESE IDEAS COULD INVALIDATE AT ANY TIME. THE STOCK MARKET IS A VOLATILE PLACE, DO YOUR OWN RESEARCH. THIS IS POSTED FOR EDUCATIONAL PURPOSES ONLY, NOT ADVICE. ✌✌✌
Based on what we have seen twice this year, SoFi has retraced all the way back to the highest volume node. The pattern would suggest a "u-shaped" recovery, and then a rebound shortly after. With a recent price target set at $21, and the midpoint of the outer triangle just above $19, one cannot wonder if it will reclaim this area accordance with this trend.

SoFi Swing PositionI like this holding here at the .618 level and will be taking a position here. Further down arrows mark additional DCA levels I will consider - if reached. Now if this holds, I anticipate $35+ before next retracement.

[stock] SoFi - SOFI - Not so complicated?SoFi - SOFI - The channel range seems easy to visualize from a technical standpoint. Will price follow the pattern? Edutainment Purposes Only!

$V - Visa in a major bearish downtrend $134 PTIf you draw a trend since 2011, it looks like it can retest the $134 level (which has acted as major support levels multiple times. I would not buy at current levels.

SOFI trendline bounce?$SOFI
Showed strength amid red market Friday. Held the $18 psychological level as well. Not a bad place IMO to pick up shares either if you're bullish long term..
- Bounced off 4HR trendline
- Held the $18 level
Calls as long as 18 holds
or BTD around 17.30
Will monitor XLF, IWM, for sediment.
Targets: 18, 18.50, 18.84,
My stop will be a 15 min close below 17.30
Happy trading!

SOFI - Daily Chart - Levels of Support and Resistance NASDAQ:SOFI
2 Levels of support; solid white and dotted white lines.
The dotted line is allowing lower lows
The solid line is allowing higher lows
Look for the upper/solid support line to be respected in order
to continue setting higher lows and continue an overall
bullish uptrend
If the lower/dotted line is broken with confirmation,
the bears will have control.
_______________________________________________________
2 Levels of resistance; solid yellow and dotted yellow lines.
The solid line is a much stronger resistance
The dotted line could be flipping to support if buying pressure can
overtake the sellers in the selling pressure zone.
Look for the upper/solid support line to be broken in order to start
a new upward resistance trend in order to set higher highs.
5 daily candles have used this line as support, 6 have used is a resistance.
Note the large gap in price around earnings in August. This in my opinion was a market overreaction in which the lower support was respected perfectly.
Refer to 2nd chart for EMA clouds and how they interact with these zones/levels

SOFI EMA Clouds, Support, ResistanceNASDAQ:SOFI
Big takeaway: EMA cloud flips in accumulation zone/selling pressure zone. Look at the blue circles, these would have been excellent entry point for a long position.
2 Levels of support; solid white and dotted white lines.
The dotted line is allowing lower lows
The solid line is allowing higher lows
Look for the upper/solid support line to be respected in order
to continue setting higher lows and continue an overall
bullish uptrend
If the lower/dotted line is broken with confirmation,
the bears will have control.
_______________________________________________________
2 Levels of resistance; solid yellow and dotted yellow lines.
The solid line is a much stronger resistance
The dotted line could be flipping to support if buying pressure can
overtake the sellers in the selling pressure zone.
Look for the upper/solid support line to be broken in order to start
a new upward resistance trend in order to set higher highs.
5 daily candles have used this line as support, 6 have used is a resistance.
Note the large gap in price around earnings in August. This in my opinion was a market overreaction in which the lower support was respected perfectly.

$SOFI - VERY BEARISH Double TriangleClose right below in the smaller triangle, Watch for a continual price decline to the trend line

SOFI - Are bulls in controls of this breakout?Looks like SOFI is possibly setting up for a breakout in the next 1-2 weeks. I am not giving any direction on which way I think it will go but I have plotted out possible levels of support/resistance that it could test in the near future.

$Sofi double bottom pattern (40% measured move potential)Symbol: Sofi
Pattern: Double Bottom
Timeframe: Weekly
Measured Move: $32 (40%)
Entry: $23
Target profit #1 $26.50 (15%)
Target profit #2 $28.50 (24%)
Stop loss: 20.5 (-10%)

SOFI - EPS Squeeze DeliversWe are done for now, although once the Charter
arrives, this will head higher.
With a broader correction looming, we've closed a
very small position for $3.11 x 1.5
Good Luck to HODLers.
_______________________________________________
SOFI has the most intrusive Date Agg of any online Bank.
IRS compatriot.
SOF will quickly become anther "Protected Entity"
The control they exhibited over some test accounts
we put up was disturbing, so much so we closed all
of them.

IMO Key support and new base is $20.75.5 fib ($20.75) is a key support that sofi needs to hold. That should be a new foundation to build from.

COIN Looks like a Short Ahead of EarningsDiminishing fees with the increased competitive landscape with HOOD, KRAKEN, etc.

SOFI - Squeeze Candidate ahead of EPSShort Interest has increased steadily.
It now exceeds 50 Million Shares.
Should it Beat EPS, selling the news
would be expected.
Expect the Potential for the Unexpected.
The Reddit crowd smells a Play.
We will see.
Charter News could arrive any moment.


SofiI like it. I like it a lot. Mix in the bank charter news and the hype about the super bowl...would love to see this to 35 at the start of next year.

SOFI Showing a WEEKLY BULL FLAG - where to next?SoFi has silently become the most innovative and legitimate financial services technology company and the bulls have been accumulating more and more stock as of late. This is one to watch for long term gains. It's still a good time to get in.
