We are due a 2017 style ALT season.One for the memory banks!
Now
do we actually get what we are "owed" ?? :)
We don't know
and nothing is owed to us of couurse
But
Selling too soon could be quite disastrous... as many peopleI speak to say to me 5X - 10X I am out..
Which may be prudent
If you are out. Stay out and don't FOMO back in again near the tops
So it's best to scale out in my opinion
last cycle was a quite difficult Alt season ... some bag holders actually did not get to experience any euphoria
Hence why I am leaning to an exsplosive alt season
BTC at $70k doesn't feel euphoric
so what will it take?
SOL

Solana Update: What About Now, Still Bullish? Yes!What can you tell me about Solana?
Are market conditions different now? Should we worry? Are we still bullish?
Is Solana growing or will it crash based on the chart?
Good questions my friend, great questions.
Market conditions stay the same.
The bullish jump 2-March was rejected but the action continues as a higher low compared to 28-February, and Solana is still trading above a long-term support zone. Above support means bullish.
Market conditions are bullish for Solana because support was tested and support holds. Conditions are bullish because after six days of bearish action the market remains strong. There is no bearish volume, no bearish momentum, no bearish force, mute.
If there was a retrace, it is just because the last move was a reactive event. That being the case, the market erased the move and conditions revert back to before the reaction took place. This means that the basics are in place.
The low is, trading above support. Nothing changes, Solana is set to grow.
Corrections, drops, swings, shakeouts and retraces are an opportunity to buy-in, rebuy and reload. Focus on the long-term while you do so. Solana will soon trade above $700 and it can reach $1,000, $2,000 or more. It will be wild, numbers will go off the chart.
I cannot say anymore so we wait, but you will be extremely happy with the results in several months if you decide to buy and hold.
Namaste.

sol buy midterm"🌟 Welcome to Golden Candle! 🌟
We're a team of 📈 passionate traders 📉 who love sharing our 🔍 technical analysis insights 🔎 with the TradingView community. 🌎
Our goal is to provide 💡 valuable perspectives 💡 on market trends and patterns, but 🚫 please note that our analyses are not intended as buy or sell recommendations. 🚫
Instead, they reflect our own 💭 personal attitudes and thoughts. 💭
Follow along and 📚 learn 📚 from our analyses! 📊💡"
The Era Of Solana SOL Has Been Finished Hello, Skyrexians!
BINANCE:SOLUSDT is the best altcoin of 2023-2024 years because it made 30x from the bottom even on the fake bull run in crypto. This bull run was fake because the true bull run is possible only on DXY dump, but this time Bitcoin and Solana has been growing parallel with the Dollar Currency Index. These assets absorbed all liquidity of the crypto market and on the true bull run it will give it back.
The technical picture is very ugly. Recently we pointed out that Solana has completed the 5 waves cycle and now it's printing ABC correction. Wave A now is in progress and it consists of 5 waves as well. Looking at AO and Fibonacci we can conclude that now asset is finishing the wave 5 which has a target at $110. There we need to see green dot on the Bullish/Bearish Reversal Bar Indicator From there we expect bounce to $200 in the wave B and after that the bear market continuation to targets somewhere below $100.
Best regards,
Skyrexio Team
___________________________________________________________
Please, boost this article and subscribe our page if you like analysis!

$SOL Trying For W Patter ReversalTHE MARKET REALLY WANTS TO GO UP.
Stronger coins, such as CRYPTOCAP:SOL
keep putting in higher lows.
If we close above the EMA9 on the Daily that will be really telling.
A bit premature to call a reversal, but I’ve been speculating on this W reversal pattern forming since Trump announced the Crypto Strategic Reserve.
Perfect setup for that.
The lack of liquidity is the only thing holding back the reversal and reason for the pump n dumps on every bit of news.

Playing Yearly Levels on SOL: Targeting $170I know the market looks dreadful, especially for most coins within the Solana ecosystem. However, this is simply a retest of the breakout levels and the Point of Control (POC) into the $130s.
If there’s a chance to get it cheaper around $122, I’ll place a bid, along with the last level. These are spot buys, of course.
This is all true as long as BTC stays above $75K, so keep that in mind when taking risks. If BTC decides to challenge sub-$80K territory, be cautious.
I’m not looking for new all-time highs (ATHs), but a retest around $170 would be welcomed.
CRYPTOCAP:SOL BINANCE:SOLUSDT

Will SOL start growing now that Trump has announced the reserve?Hi everyone, let's look at the 1D SOL to USD chart, in this situation we can see how the price is moving in an ascending channel where it is currently struggling to stay in the lower part of the channel.
Let's start by defining the targets for the near future that the price has to face:
T1 = 172.96 USD
T2 = 202.57 USD
Т3 = 223.84 USD
Т4 = 250.58 USD
Now let's move on to the stop-loss in case the market continues to fall:
SL1 = 139.90 USD
SL2 = 114.89 USD
SL3 = 94.76 USD
SL4 = 74.35 USD
It is worth looking at the MACD indicator where we can see how low we have gone much lower than during the previous declines, which could potentially indicate that the price will try to go up if the ongoing bullish trend is maintained.

SOLUSDT at Critical Resistance – Will Bears Take Over? Yello, Paradisers! Is SOLUSDT setting up for a major drop? The technicals are flashing warning signs, and you need to pay attention.
💎SOLUSDT has broken down rising wedge, showing a loss of bullish momentum. On top of that, a bearish divergence is appearing, and the price is currently testing key resistance at the 200 EMA—a combination that significantly increases the probability of a bearish move.
💎If SOLUSDT retests the resistance zone and the 200 EMA again, a double top formation could play out. But before jumping in, waiting for bearish confirmation is the smart move.
💎If price breaks above and closes a candle above the resistance, it will invalidate the bearish thesis. In that case, patience is key—waiting for clearer price action will be the best approach.
🎖Trading isn’t about guessing—it’s about waiting for high-probability setups and executing with discipline. Stay sharp, Paradisers, and remember: the market rewards patience, not impulsive moves.
MyCryptoParadise
iFeel the success 🌴

Solana's Flush Is Over: The Path Toward $500+ Is Now ClearThis is it!
Good afternoon my fellow Cryptocurrency trader, we are ready and live today. Solana's low has been hit.
Are you a Solana trader, buyer, holder?
Are you a Solana fan?
If yes, I have great news for you.
The low is in!
Solana's low has been hit.
Get ready for a massive bullish phase.
➖ Technical Analysis
SOLUSDT just activated a very strong support zone. This is the support zone that was created between June and October 2024. A consolidation phase that lasted more than four months and launched a bullish wave that peaked at $296.
This same support range is now being activated with a higher low, and this will lead to a new market phase, the 2025 bull-market. A higher low leading to a very strong higher high; a new All-Time High plus much more.
Easy target here is set around $379 but there is room for more, much more because we are about to experience long-term growth. First, we will have three months green, that is March, April and some May. Then likely a correction and then additional growth leading to the bull-market bull-run phase. This is a rough presentation, we will go deeper as we study together the market and the charts. Huge profits will be made.
This is fun.
This is awesome.
We are ready to trade.
Thank you for reading.
Namaste.

Solana 10X Trade-Numbers (3,810% Potential)Buy when prices are low. Sell when prices are high.
Sell at resistance. Buy at support.
Solana right now is trading at long-term support. The same support range that has been active and valid since April 2024. This support was challenged many times and always holds. —Buy at resistance, sell at support.
This is a great setup, great price, great timing. Risk still exist though.
Leveraged trading is high risk and for experts only.
I am wishing great profits and good luck.
—Full trade-numbers below:
_____
LONG SOLUSDT
Leverage: 10X
Entry levels:
1) $140
2) $135
3) $130
4) $125
Targets:
1) $188
2) $195
3) $210
4) $234
5) $249
6) $273
7) $312
8) $340
9) $375
10) $477
11) $575
12) $664
Stop-loss:
Close weekly below $125
Potential profits: 3810%
Capital allocation: 5%
_____
Thanks a lot for your continued support.
Namaste.

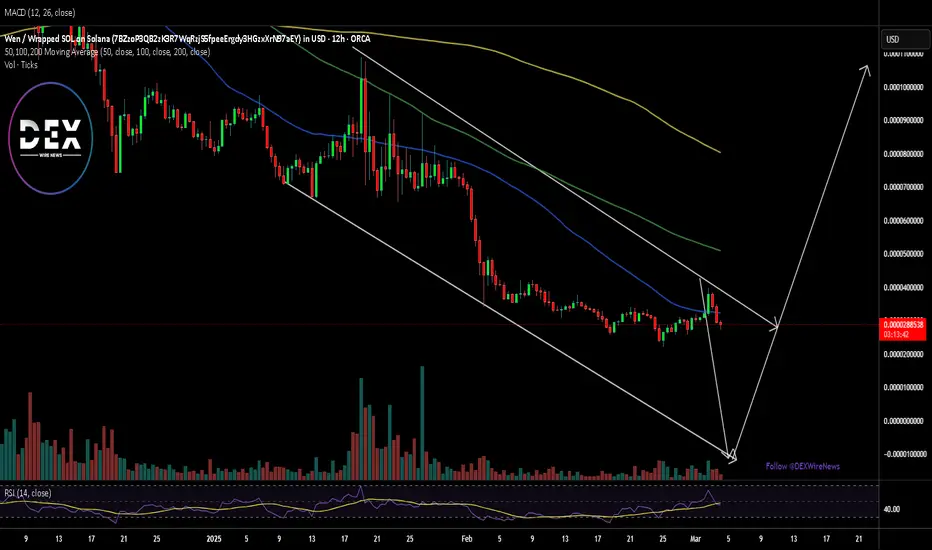
WEN Set For a Breakout Amidst Falling Wedge PatternBuilt on the Solana Ecosystem NASDAQ:WEN seems to be enroute of a bullish reversal amidst a falling wedge pattern. The falling wedge was largely attributed by the overall cool off of the crypto currency landscape with CRYPTOCAP:BTC seeing a major dip from $95k down to $85k.
For NASDAQ:WEN , the asset might further dip to the base of the wedge formed as seen in the chart depicted above before picking liquidity up and surging towards greater highs.
What is WEN
Wen is culture. Wen is a movement. Wen is the internet’s cutest cat and the heart of a growing global phenomenon. More than a brand, Wen is on a mission to become one of the world’s most iconic and beloved IPs.
Wen started as a free airdrop to 1M+ recipients to give back. There were zero influencers, whales, or insiders involved and each recipient received the exact same amount - this made Wen the fairest and widest distributed airdrop ever on Solana. Emphasizing Wen is a coin for the people.
Solana Reverses Downtrend: Trump's View on Crypto and What Next.Solana Breaks Downtrend Line: Trump’s Crypto Stance and Key Resistance at $180
Solana has recently broken the downtrend line on its daily timeframe, which has garnered significant attention in the crypto market. This shift in momentum comes amidst former President Donald Trump’s comments on cryptocurrencies, where he named XRP, Solana, and Cardano as potential candidates for a U.S. crypto reserve. His statements have sparked renewed interest in these assets, pushing their value upward.
Currently, Solana is facing resistance at the $180.00 level. For traders looking to enter a long position, it’s crucial to wait for a breakout above this key resistance. Confirming the breakout would require the price to close above the $180 level in a 4-hour timeframe. Until then, caution is advised, as the market continues to test this critical threshold.
Traders should monitor the situation closely for any signs of a breakout or rejection at the $180 level. If Solana manages to close above this level, it could signal the next phase of its upward momentum, with potential for further gains. However, patience is essential to ensure the breakout is confirmed before entering any long positions.

Velas (VLX) Technical Analysis & Market Outlook – March 2025🚀 Velas (VLX) Technical Analysis & Market Outlook – March 2025 🚀
📊 Current Market Structure & Technical Indicators
🔹 Trend Overview: Velas has been in a prolonged descending trading channel, reaching its lowest price of 2025, making this a potential accumulation zone.
🔹 Key Support & Resistance Levels:
Support: 🟠 $0.00399 (historical low) and $0.00526 (current price level).
Resistance: 🔵 $0.00749 (major breakout target) and $0.00900 (mid-term bullish target).
🔹 Indicators Analysis:
WMC Cipher B Divergences: Strong bullish divergence detected, suggesting upward momentum.
RSI (14): Currently at 56.50, breaking above the neutral zone, indicating a reversal trend.
Money Flow Index (MFI): Positive inflow, signaling increasing interest and potential accumulation.
Stochastic (14,3,1): Overbought but still showing strength in the recovery phase.
📌 Conclusion: VLX has reached its lowest point and is forming a potential breakout from the descending channel. A break above $0.00749 will confirm a bullish trend.
🔥 Velas Ecosystem Updates & Growth Potential 🔥
💡 Major Developments in the Velas Ecosystem
✅ 1M VLX Tokens for Staking Rewards!
Just last week, in collaboration with @AccumulatedFi, 1 million VLX tokens were allocated and distributed among $stVLX stakers, further boosting incentives for long-term holders.
✅ Subchains & Advanced Smart Contract Features
Two weeks ago, Velas introduced a powerful devnet update, significantly improving scalability and efficiency:
Hosting Subchains: New architecture supports subchains with an updated configuration (semi-compatible with geth init).
Improved Subchain Management: More efficient program instructions, leading to faster and smoother blockchain operations.
Mint/Burn Token Mechanism: Subchains now support a dynamic mint/burn token system, enabling more advanced DeFi applications and scalability solutions.
✅ New Devnet Release! 🚀
The Velas team isn't slowing down! They will release another devnet update, introducing:
Internal Transaction Explorer: Users will be able to track internal blockchain transactions, enhancing transparency.
Refined Documentation: Continuous improvements to the Velas Docs ensure seamless onboarding for developers.
🌟 The Road to Velas' Glory – ALEX ALEXANDROW & THE TEAM ARE DELIVERING! 🌟
The Velas team, led by Alex Alexandrow, is on a mission to bring Velas back to its well-deserved glory. With continuous groundbreaking updates, strategic partnerships, and enhanced scalability, Velas is proving itself as a top-tier blockchain project with unmatched potential.
🔥 With major innovations, growing adoption, and a rebounding market, Velas is positioned for a massive breakout! 🔥
#Velas #VLX #Crypto #Blockchain #DeFi #Web3 #Staking #Innovation #Trading #HODL 🚀

$SOL smashes through the EMA9 and SMA20 above $170CRYPTOCAP:SOL smashes through the EMA9 and SMA20.
Looking for the cross for confirmation.
As previously mentioned, that green box was critical to clear $170.
Need a cluster of closes above this.
My 4x LONG is happy rn 🥳

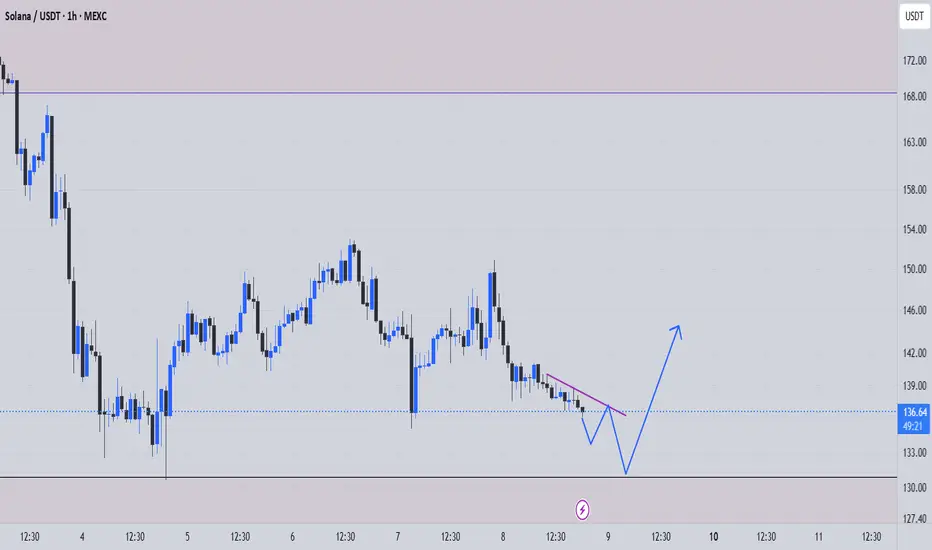
Cryto Bull run StartingCrypto Strategic Reserve News sparking a Crypto Bull run? Seeing nice push across several crypto assets. How long will the bull run last?

The key is whether it can be supported near 145.32
Hello, traders.
If you "Follow", you can always get new information quickly.
Please also click "Boost".
Have a good day today.
-------------------------------------
(SOLUSDT.P 1M chart)
It seems that a sharp decline will occur due to the issue of SOL.
The key is whether it can be supported near 0.707(135.64) ~ 0.786(149.71), 137.04 and rise.
If it rises, whether it can be supported near 179.73 is important.
If it falls, it is likely to fall to around 101.78, so you should think about a countermeasure for this.
-
(1D chart)
If the HA-Low indicator on the 1D chart is generated at the 145.32 point, the key is whether it can receive support and rise around this area.
If not, and it falls below 137.04,
1st: Fibonacci ratio 0.618 (119.78)
2nd: 101.78
You should check whether there is support around the 1st and 2nd areas above.
Circle marked area: Important support and resistance area
(Circle marked area: Important support and resistance area)
-
Thank you for reading to the end.
I hope you have a successful trade.
--------------------------------------------------
- Big picture
I used TradingView's INDEX chart to check the entire range of BTC.
(BTCUSD 12M chart)
Looking at the big picture, it seems to have been following a pattern since 2015.
In other words, it is a pattern that maintains a 3-year bull market and faces a 1-year bear market.
Accordingly, the bull market is expected to continue until 2025.
-
(LOG chart)
Looking at the LOG chart, we can see that the increase is decreasing.
Accordingly, the 46K-48K range is expected to be a very important support and resistance range from a long-term perspective.
Therefore, we do not expect to see prices below 44K-48K in the future.
-
The Fibonacci ratio on the left is the Fibonacci ratio of the uptrend that started in 2015.
That is, the Fibonacci ratio of the first wave of the uptrend.
The Fibonacci ratio on the right is the Fibonacci ratio of the uptrend that started in 2019.
Therefore, this Fibonacci ratio is expected to be used until 2026.
-
No matter what anyone says, the chart has already been created and is already moving.
It is up to you how to view and respond to it.
Since there is no support or resistance point when the ATH is updated, the Fibonacci ratio can be appropriately utilized.
However, although the Fibonacci ratio is useful for chart analysis, it is ambiguous to use it as a support and resistance role.
The reason is that the user must directly select the important selection points required to create the Fibonacci.
Therefore, it can be useful for chart analysis because it is expressed differently depending on how the user specifies the selection point, but it can be seen as ambiguous for use in trading strategies.
1st: 44234.54
2nd: 61383.23
3rd: 89126.41
101875.70-106275.10 (when overshooting)
4th: 134018.28
151166.97-157451.83 (when overshooting)
5th: 178910.15
-----------------

SOL recovery incoming?SOL is testing horizontal support again. The good thing is that invalidation is clear. There is a class A bullish divergence on the 4h while the daily time frame is still not showing much.

$SOL Epic 18% Rally to End the Month!What an epic day for CRYPTOCAP:SOL today with an 18% rally!
Closed the month outside of that accumulation zone I mentioned in previous TA, which is very promising.
Looking for SOL to build a cluster this next week outside that range, and then make another leg up into the green zone to reclaim the EMA9.
Take it level by level 👍

Solana Continues Bullish, Why? Bitcoin & The Altcoins MarketSeeing Solana bullish and ready to grow, what does it mean?
Will Solana decouple from the rest of the Cryptocurrency market and grow all on its own?
Or can we say that we have a clear signal that the bottom is in; what one does, the rest follows.
Good afternoon my fellow Cryptocurrency trader, wonderful news coming from the Altcoins again.
Solana is good. Solana is bullish. Solana already bottomed. Solana looks very strong.
The fact that Solana hit bottom and is ready to grow, reveals what is coming to Bitcoin and the rest of the Altcoins. We are witnessing a long-term higher low and classic final flush before the major 2025 bull-market bull-run. Long-term growth in short.
The support level mapped on the chart has been pierced. Trading volume is very low on the drop. The current session is a very strong hammer, bullish signal, trading on the positive side. It has a long lower shadow and a big green real body. Everything points up.
The fact that Solana is bullish being such a strong and big project, confirms that Bitcoin hit bottom and also the rest of the Altcoins.
I am looking at many of the smaller Altcoins and their behavior is extremely clear to me, it shows that lower is no longer possible nor needed. I will be sharing some of these charts with you.
The thing is that in the last 5 days Bitcoin has been red but some Altcoins instead of crashing are going sideways. This can only happen preceding a major bullish phase. Since everything will grow, the Altcoins already bottomed, they are waiting for Bitcoin to end its flush before taking off. The Altcoins will move before Bitcoin and they will grow strong. The Altcoins never grow if Bitcoin is going down. The fact that many Altcoins are bullish —trading at support and reversing— means that Bitcoin will grow.
The time to buy is now.
Thanks a lot for your continued support.
Buy and hold. Easy hold.
Regardless of the short-term shaking and noise, we are going up. Crypto is going up.
Solana is going up. Bitcoin is going up... In a matter of days.
Namaste.

SOL ANALYSISThe analysis you see is on the weekly time frame.
If you need reviews on lower time frames to be posted on the TradingView site.... Leave a comment in the comments so that this can be done.
If you liked this analysis, share it with your friends.

Solana (SOLUSDT) is Not Dead! A Major Move is Coming! Solana (SOL) is holding strong at its major support level of $110, making this an ideal accumulation zone between $110 and $140. With CME Group launching SOL Futures on March 18th, institutional interest could surge, potentially triggering a massive rally. As Solana gears up for a recovery to previous highs, this could be a prime opportunity to buy and hold for the long term. Don’t miss out—accumulate
BINANCE:SOLUSDT Currently trading at $144
Buy level: $110 - $140.
Stop loss: Below $90
Target : $500
Max Leverage : 1x /Spot trade
Always keep Stop loss
Follow Our Tradingview Account for More Technical Analysis Updates, | Like, Share and Comment Your thoughts

SOL | Solana Drops 54% | WHERE TO NEXT?The recent ByBit hack seems to have sent the market into a downward spiral. But, if you look at it from a few weeks back, prices were already beginning to drop even before the news of the hack.
Solana follows Ethereum pretty closely, and considering the hard sell-off on ETH, SOL followed suit with a -26% drop over the past week.
This is quite a substantial correction, and considering the past 6 candles were red - it's likely that we can expect a bounce from next week, or at least a green candle. If we fail to bounce here, the short term is looking bleak for SOL:
____________________
KUCOIN:SOLUSDT

SOL BuySOL/USDT Analysis & Trade Signal
Chart Overview:
The Solana (SOL/USDT) chart is on a 4-hour timeframe.
The price is currently in a downtrend, trading inside a descending channel.
Major support zone: $124 - $112 (marked in red).
Major resistance zones: $152, $177, $227, and $285.
Trade Plan & Signal:
📌 Buy Zone (High Risk Entry):
The price is around $124.67, which is near the support zone.
The chart suggests waiting for a strong bullish candle before entering.
If the price holds this support, it could trigger a reversal.
📌 Stop Loss:
Below $112.93 to minimize risk.
📌 Target Levels:
First target: $152
Second target: $177
Third target: $227
Final target: $285
📌 Risk Management:
If the price breaks below $112, the downtrend could continue.
Enter only after confirmation of a bullish reversal.
Conclusion:
Bullish scenario: A bounce from $124 could lead to $152+ targets.
Bearish scenario: A break below $112 might push the price lower.
Recommendation: Wait for a bullish confirmation before entering.
Would you like further analysis or modifications in risk management? 🚀
