WORM. Long.This is how it could be if #CRYPTO dudes turn back to the way they were, considering dirty #market #Manipulation and Benjamin Cohen's tears about too many tokens being created and his #YouTube #ALTSEASON predictions not coming true. I encourage all degens aped in $WORM on #Solana
SOL

The key is whether the price can be maintained above 202.45
Hello, traders.
If you "Follow", you can always get new information quickly.
Please also click "Boost".
Have a nice day today.
-------------------------------------
(SOLUSDT 1M chart)
In order to turn into a downtrend, it is expected to start by falling below 147.74.
Since the BW(100) indicator was formed at 231.77, the point to watch is whether it can rise above this point.
-
(1W chart)
The key is whether it can receive support near 202.45.
-
(1D chart)
The key is whether it can receive support near 194.46, the HA-Low indicator point, and rise above 202.45.
-
The charts that do not display support and resistance points and the charts that do are displayed are displayed separately for each time frame chart.
The basic chart for trading is the 1D chart.
Therefore, if you want to trade by looking at charts below 1D charts, it is recommended to mark at least the support and resistance points of the 1D chart.
As traders, the reason we analyze charts is to trade.
Therefore, chart analysis is to select key support and resistance points.
Therefore, you must select key support and resistance points in any way.
-
Thank you for reading to the end.
I hope you have a successful trade.
--------------------------------------------------
- Big picture
I used TradingView's INDEX chart to check the entire range of BTC.
(BTCUSD 12M chart)
Looking at the big picture, it seems to have been maintaining an upward trend following a pattern since 2015.
In other words, it is a pattern that maintains a 3-year upward trend and faces a 1-year downward trend.
Accordingly, it is expected that the upward trend will continue until 2025.
-
(LOG chart)
Looking at the LOG chart, you can see that the upward trend is decreasing.
Accordingly, the 46K-48K range is expected to be a very important support and resistance range from a long-term perspective.
Therefore, we expect that we will not see prices below 44K-48K in the future.
-
The Fibonacci ratio on the left is the Fibonacci ratio of the uptrend that started in 2015.
In other words, it is the Fibonacci ratio of the first wave of the uptrend.
The Fibonacci ratio on the right is the Fibonacci ratio of the uptrend that started in 2019.
Therefore, it is expected that this Fibonacci ratio will be used until 2026.
-
No matter what anyone says, the chart has already been created and is already moving.
How to view and respond to this is up to you.
When the ATH is updated, there are no support and resistance points, so the Fibonacci ratio can be used appropriately.
However, although the Fibonacci ratio is useful for chart analysis, it is ambiguous when used as support and resistance.
This is because the user must directly select the important selection points required to create Fibonacci.
Therefore, since it is expressed differently depending on how the user specifies the selection points, it can be useful for chart analysis, but it can be seen as ambiguous when used for trading strategies.
1st : 44234.54
2nd : 61383.23
3rd : 89126.41
101875.70-106275.10 (Overshooting)
4th : 134018.28
151166.97-157451.83 (Overshooting)
5th : 178910.15
-----------------

SOL - if price reach 300+ area - time to get OUTSOL - if the price reach 300+ area - it time to get OUT
price is in a long up trend
big volume
good news
often that's how trend ends

WORM. Highest degen play or next big thing?Highest degen play or next big thing? The first eternal digital organism started their journey and formed several parallel descending channels in which, at first glance, finds new lows. However, there is an opportunity here if you look through the lens of tech.
" DeepWorm is an autonomous digital organism designed to operate perpetually on the blockchain. It replicates the neural architecture of the Caenorhabditis elegans worm, utilizing 302 neurons to make self-informed decisions. By integrating biological neural networks with blockchain technology, DeepWorm aims to create a living digital entity capable of continuous, autonomous function. "

OFFICIAL TRUMP OPPORTUNITYThe Official Trump meme coin is currently valued at $25.79, having experienced a notable drop from its peak of $75. Even with this decline, the coin continues to capture attention in both the market and mainstream media. It's worth mentioning that some early investors might still be enjoying substantial profits. While the price is on a downward trend, there is potential for a recovery.
Moreover, the coin has established real-world applications, as it is accepted for bookings through Travala, a platform that facilitates crypto payments for flights, hotels, and activities. This acceptance could lead to increased selling as investors cash out, but it may also enhance the coin's value in the long run.
A significant portion of its supply remains unreleased, with 800 million coins set to enter circulation over the next three years, which could result in token dilution unless the market cap grows accordingly. The token's market has been volatile, characterised by swift price changes followed by steep declines.
Currently, it’s uncertain whether the coin will achieve lasting success or gradually fade away. Major exchanges hold a considerable share of the coin, while retail investors typically possess smaller amounts, yet they still play a role in the trading volume. Although there are worries about the coin's future due to intense selling pressure, it hasn't reached a stage that could be labeled a 'rug pull.' Despite the prevailing bearish sentiment, there is optimism that the coin could experience significant growth again, with some forecasts suggesting it might hit a $100 billion market cap.
I see a chance to accumulate within the designated area on the chart. Avoid becoming overly attached to lofty market cap predictions. Instead, establish an accumulation box and a profit-taking box. The strategy of dollar-cost averaging in and out has proven to be a reliable trading approach.

SOL 4H RANGESOLANA is down -40% from making a new ATH to the bottom of the crash wick @ $175. Looking at the chart, unless BTC decides to gap down again from a TA standpoint SOL looks good here.
A triple tap of the bottom with a reclaim of the bullish orderblock that coincides with the golden pocket zone from local LTF high to low, followed by a strong reaction from that zone. Q1 is historically good for altcoins and so the all of these points added together the R:R at this level is good IMO.
Profit taking through the range quarters.
The idea is invalid once price accepts below the triple tap bottom under $170.

SOLUSD Triple bottom initiates new rally to $380.Solana (SOLUSD) has been trading within a Channel Up pattern since the July 29 2024 High. The recent February 03 2025 Low isn't just a Higher Low on the Channel Up but also a Triple Bottom on the Support Zone and a Double Bottom on the 1D MA200 (orange trend-line).
Needless to say, this shows that technically this is a level of high demand, thus long-term Support and within the next 30 days maximum, it should initiate the new Bullish Leg of the pattern, similar to the September 06 2024 Low. Even the 1D RSI sequences between those fractals are identical.
Since the previous Bullish Leg rose be +119.43%, we see no reason to do otherwise now, hence our new long-term Target is set a $380.00.
-------------------------------------------------------------------------------
** Please LIKE 👍, FOLLOW ✅, SHARE 🙌 and COMMENT ✍ if you enjoy this idea! Also share your ideas and charts in the comments section below! This is best way to keep it relevant, support us, keep the content here free and allow the idea to reach as many people as possible. **
-------------------------------------------------------------------------------
💸💸💸💸💸💸
👇 👇 👇 👇 👇 👇

$PENGU’s Price Plummets Despite $150 Million Token BurnThe cryptocurrency market is no stranger to volatility, but the recent plunge of CSECY:PENGU —Pudgy Penguins’ culture coin—has raised eyebrows. Despite a massive token burn of unclaimed Solana airdrop tokens worth over $150 million, CSECY:PENGU has suffered a steep 80% drop from its recent all-time high (ATH) on January 6th, 2025. Now, traders and investors are questioning whether this presents a golden buying opportunity or a warning sign of further declines.
The $150 Million Token Burn
On Wednesday, the Pudgy Penguins team executed a large-scale burn of unclaimed PENGU tokens, amounting to 13.69% of the total supply. Originally, the token claim window was set to last until March 9, but the team expedited the deadline, citing bot activity rather than genuine community engagement.
As a result, over 12 billion CSECY:PENGU tokens were permanently removed from circulation by sending them to the Solana burn address. Traditionally, a supply reduction through burning is seen as a bullish move, as it creates scarcity and reduces sell pressure. However, CSECY:PENGU ’s price has continued to tumble, currently trading at $0.0117, down nearly 8% in the past 24 hours alone.
Despite the price drop, Pudgy Penguins’ parent company, Igloo Inc., is working on strategies to attract institutional interest and increase adoption of both the PENGU token and the Pudgy Penguins NFT collection. However, this push has yet to yield positive price action, as the Ethereum-based Pudgy Penguins NFT floor price has also declined 11% over the past week.
Technical Outlook
From a technical perspective, CSECY:PENGU is showing signs of exhaustion after its steep decline. The token is currently trading within a falling wedge pattern—a classic technical setup that often precedes bullish reversals. Additionally, the Relative Strength Index (RSI) sits at 32, indicating that the asset is in oversold territory. Historically, an RSI this low suggests that a potential bounce could be on the horizon.
Moreover, while the broader trend remains bearish, CSECY:PENGU is hovering above key moving averages, signaling a possible accumulation phase. This suggests that traders looking for a discounted entry point could capitalize on the current price levels before an eventual breakout.
Market Sentiment
While all technical indicators point to bearish momentum in the short term, seasoned traders understand that market cycles often present opportunities amidst fear. The large-scale token burn has removed excess supply, and institutional interest—if successfully attracted—could drive demand in the coming months.
Conclusion
CSECY:PENGU presents a mixed bag. While the massive token burn suggests long-term supply reduction, the immediate impact has not been reflected in price appreciation. The technical setup hints at a potential reversal, but macroeconomic conditions and investor sentiment will ultimately dictate the token’s next move.
For traders, CSECY:PENGU ’s current levels may be an opportunity to accumulate ahead of a possible breakout. However, risk management remains crucial, as further downside remains a possibility. As always, staying informed and monitoring key technical levels will be essential for navigating this volatile market.
Will CSECY:PENGU stage a comeback, or is this just another crypto winter casualty? Only time will tell, but for now, all eyes remain on the charts.

Waiting for Sol to turn my trade on.I expect Sol to deep one more time below 190, but not much lower... then my long will be unleashed.

TOTAL Cryptocurrencies: Global Market Indicator and AnalysisAccording to my theory, we are witnessing a crypto market growth cycle with a growth phase of 35 months and a correction phase of 13 weeks. I expect the crypto market to continue to grow until November 1, 2025, driven by the arrival of large investment funds and corporations behind blockchain technology as well as tokenization. The RWA sector is at a nascent stage and trillions of assets will be tokenized and used for fast transactions, ease of transfers, 24-hour accessibility and transparency. In addition, the arrival of institutional investors via ETFs should not be overlooked. Today, BlackRock owns over 470k BINANCE:BTCUSDT and is unlikely to stop. BYBIT:ETHUSDT is undervalued, BINANCE:SOLUSDT shows the very availability of cryptocurrency for everyone on the planet. Memesession is actually testing the Solana network for its suitability for massadoption. Staying bearish regarding the cryptocurrency market looks like ignoring the internet in the early 2000s. Focus on the RWA direction, a large number of projects are about to show parabolic growth!
Horban Brothers.

ALPHAOFSOL/USDT NEW INCREASE VOLUMEALPHAOFSOLUSDT can show na ew volume increase in the coming time frames.

Shiro Neko $Shiro Big Move IncomingIf you missed the Shiba Inu run, Shiro Neko could be your next golden opportunity. The same team that propelled SHIB to mainstream adoption is behind this project, and its early performance has already caught the market's attention.
Shiro Neko hit an impressive SEED_TVCODER77_ETHBTCDATA:1B market cap on launch and, after a period of consolidation, is gearing up for its next move.
📊 Market Analysis & Potential Reversal
Strong community-driven momentum similar to early SHIB & DOGE.
High-volume accumulation zones suggest whales positioning before the next breakout.
Support forming in key price levels, indicating potential for a parabolic move.
Key Catalysts for Growth
✅ Previous ATH – $SHIRO already reached SEED_TVCODER77_ETHBTCDATA:1B market cap, and a retest could be imminent.
✅ Dev Team with Proven Success – The same minds behind SHIB’s legendary run.
✅ Expanding Ecosystem – New listings, partnerships, and real-world utility in development.
✅ Early-stage growth potential – Market cap still has significant room to expand.
BINANCE:ETHUSDT BINANCE:CHILLGUYUSDT.P BINANCE:SHIBUSDT

Shiro Neko ($SHIRO) – Next Big Move IncomingIf you missed the Shiba Inu run, Shiro Neko could be your next golden opportunity. The same team that propelled SHIB to mainstream adoption is behind this project, and its early performance has already caught the market's attention.
Shiro Neko hit an impressive SEED_TVCODER77_ETHBTCDATA:1B market cap on launch and, after a period of consolidation, is gearing up for its next move.
📊 Market Analysis & Potential Reversal
Strong community-driven momentum similar to early SHIB & DOGE.
High-volume accumulation zones suggest whales positioning before the next breakout.
Support forming in key price levels, indicating potential for a parabolic move.
💎 Key Catalysts for Growth
✅ Previous ATH – $SHIRO already reached 1-Bi market cap, and a retest could be imminent.
✅ Dev Team with Proven Success – The same minds behind SHIB’s legendary run.
✅ Expanding Ecosystem – New listings, partnerships, and real-world utility in development.
✅ Early-stage growth potential – Market cap still has significant room to expand.
The RSI is primed for a sharp reversal, signaling strong bullish momentum ahead. With increasing accumulation and volume building up, we could see an astronomical breakout in the coming days. 🚀
The setup is aligning perfectly—once key resistance is breached, expect a rapid surge. Keep an eye on price action; this could be the beginning of a massive rally!
Risk-Reward Ratio Looks Favorable
The risk-to-reward setup here could be one of the best in the current altcoin market. If momentum kicks in, Shiro Neko could replicate SHIB’s meteoric rise.
Next Moves:
Breakout confirmation above = Entry trigger.
Retest of ATH 1-bi market cap = Mid-term target.
Blue-sky breakout scenario = 🚀🚀🚀
Watch closely and prepare your entries – the next explosive move could be closer than expected! CRYPTO:SHIROUSD GATEIO:SHIROUSDT COINBASE:SHIBUSD BINANCE:ETHUSDT BINANCE:SHIBUSDT

SOL Long Spot OpportunityMarket Context:
SOL has retraced to the bottom of its range support, offering a favorable entry for a long spot trade. Given its strong trend, this could be a high-probability setup for continuation to the upside.
Trade Details:
Entry Zone: $160 - $180 (bottom of range support)
Take Profit Targets:
$200 - $225
$260 - $275
Stop Loss: Just below $155
This setup provides a strong risk-to-reward ratio, with price consolidating near a key level before a potential breakout. Manage risk accordingly and stay disciplined! 📈🔥

Support and resistance zone: 202.68-211.77
Hello, traders.
If you "Follow", you can always get new information quickly.
Please click "Boost" as well.
Have a nice day today.
-------------------------------------
(SOLUSDT.P 1D chart)
Since it is a coin that has renewed its ATH, it may be natural for it to fall.
The key is whether it can receive support near the current support and resistance zone of 202.68-211.77.
-
This applies to coins where the gap between the HA-Low and HA-High indicators is unusually narrow.
Therefore, if it is supported and rises within the box range of the HA-Low indicator (173.33-218.71), it is expected to rise above the Fibonacci ratio point of 1.618 (297.94).
Otherwise, if it falls, it is expected to re-determine the trend by touching the M-Signal indicator on the 1M chart.
-
(SOLUSDT 1D chart)
I think it is also good to hold SOL coins as a long-term investment.
However, I think it is wise to increase the number of coins (tokens) held by increasing the number of coins (tokens) corresponding to profits, if possible, for all altcoins.
The reason is that the volatility is quite large.
I think the only way to stabilize your psychological state in this volatility is to increase the number of coins (tokens) corresponding to profits.
-
Thank you for reading to the end. I hope you have a successful transaction.
--------------------------------------------------
- Big picture
I used TradingView's INDEX chart to check the entire range of BTC.
(BTCUSD 12M chart)
Looking at the big picture, it seems to have been in an upward trend since 2015.
In other words, it is a pattern that maintains a 3-year upward trend and faces a 1-year downward trend.
Accordingly, the upward trend is expected to continue until 2025.
-
(LOG chart)
Looking at the LOG chart, you can see that the upward trend is decreasing.
Accordingly, the 46K-48K range is expected to be a very important support and resistance range from a long-term perspective.
Therefore, I expect that we will not see prices below 44K-48K in the future.
-
The Fibonacci ratio on the left is the Fibonacci ratio of the uptrend that started in 2015.
That is, the Fibonacci ratio of the first wave of the uptrend.
The Fibonacci ratio on the right is the Fibonacci ratio of the uptrend that started in 2019.
Therefore, this Fibonacci ratio is expected to be used until 2026.
-
No matter what anyone says, the chart has already been created and is already moving.
It is up to you how to view and respond to it.
Since there is no support or resistance point when the ATH is updated, the Fibonacci ratio can be appropriately utilized.
However, although the Fibonacci ratio is useful for chart analysis, it is ambiguous to use it as a support and resistance role.
The reason is that the user must directly select the important selection points required to create the Fibonacci.
Therefore, it can be useful for chart analysis because it is expressed differently depending on how the user specifies the selection point, but it can be seen as ambiguous for use in trading strategies.
1st: 44234.54
2nd: 61383.23
3rd: 89126.41
101875.70-106275.10 (when overshooting)
4th: 134018.28
151166.97-157451.83 (when overshooting)
5th: 178910.15
-----------------

SOL ANALYSIS (4H)From the point marked as "Start" on the chart, the correction of SOL has begun.
It appears that this correction is either a Diametric or a Symmetrical pattern.
Currently, it seems to be in Wave F.
It may reject downward from the red zone to complete Wave G.
A daily candle closing above the invalidation level will invalidate this analysis.
For risk management, please don't forget stop loss and capital management
Comment if you have any questions
Thank You

MUSKIT Wild Run – 2300% Surge Followed by a 92% Drop– What Next?The Solana-based meme coin, Musk It ($MUSKIT), which draws inspiration from Elon Musk and his ventures, experienced an explosive 2300% surge before suffering a 92% crash in value. This extreme price fluctuation has left investors questioning whether $MUSKIT has the potential for a strong rebound or if it’s merely another short-lived pump-and-dump scheme.
Market Sentiment and Recent Trends
$MUSKIT's drastic price movement coincided with a broader crypto market shake-up. Bitcoin (BTC) dipped to $91K before rebounding to $101K, while Ethereum (ETH) fell to $2K before recovering. This reflects the volatile nature of the crypto space, where sudden price swings are common.
Despite its steep decline, $MUSKIT maintains a market cap of $27,585,727.43. The coin remains largely unlisted on major centralized exchanges (CEXs), which means that future exchange listings could act as a catalyst for another price surge. Additionally, with a 24-hour trading volume of $3,985,854, market activity remains significant despite a 58.3% decline in trading volume.
Technical Analysis
From a technical standpoint, $MUSKIT is currently down 3.4% but showing signs of a potential reversal. The Relative Strength Index (RSI) stands at 46, indicating that the coin is neither overbought nor oversold. This suggests that the bears are not in complete control, and a recovery to the upside remains a possibility.
A key pivot level to watch is $0.07278, the coin’s all-time high recorded just four days ago. If $MUSKIT can regain momentum and break resistance levels, it could reclaim previous highs and continue its upward trajectory. However, failure to hold support could lead to a further decline toward $0.008864, its all-time low recorded two weeks ago.
Is There Hope for a Rebound?
1. Strong Market Performance Compared to Peers
In the last 7 days, $MUSKIT has risen 148.4%, outperforming the overall crypto market (down 6.4%) and similar meme cryptocurrencies (down 23.6%). This relative strength suggests that investor interest remains high.
2. Potential for More Exchange Listings
Currently, $MUSKIT is primarily traded on Raydium (DEX) and MEXC (CEX). Additional CEX listings could boost liquidity and attract new investors, potentially fueling another rally.
3. Market Sentiment and Meme Coin Hype
Meme coins thrive on community engagement and speculative hype. If Elon Musk acknowledges $MUSKIT in any form (as has happened with Dogecoin), it could significantly impact the coin’s trajectory.
Conclusion
While $MUSKIT’s massive pump and subsequent crash raise concerns, its relative strength against the broader market, decent liquidity, and upcoming catalysts suggest that it is not entirely doomed. However, traders should exercise caution, monitor key resistance/support levels, and watch for major exchange listings that could reignite momentum.
As always, investing in meme coins carries high risks and high rewards, making risk management crucial for those considering a position in $MUSKIT.

SOL updated analysisAfter the massive push up for SOL after the TRUMP coin caused huge volumes on SOL network, SOL has now come right back to support as seen on left chart where price reacted off the green vwap line and the green trendline.
The right chart shows how the 260usd blue line is major resistance. Price currently trying to reclaim the purple npoc.
So, now what?
Well, as a smart trader you always have 2 scenarios, up or down.
If SOL can reclaim the light green vwap line above price on left chart this could be a nice v shape recovery move playing out. 260usd is where we will know if bull run is resuming once SOL closes above this level.
If SOL loses the green vwap line below price then SOL could go as low as the next green vwap line at 154usd.
Smash that like button!

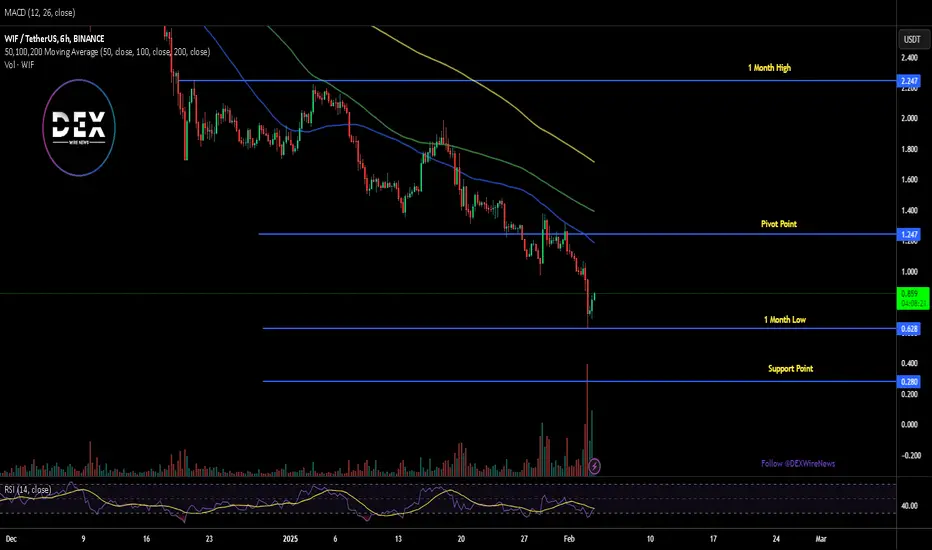
Dogwifhat ($WIF) Breaks $1 Psychological Support – What’s Next?Dogwifhat ( SEED_WANDERIN_JIMZIP900:WIF ), the popular Solana-based meme coin, has experienced a sharp decline, breaking below the critical $1 psychological support and trading at $0.829 at the time of writing. This marks a significant 12.42% drop today, pushing SEED_WANDERIN_JIMZIP900:WIF further from its all-time high (ATH) of $4.83 recorded in March 2024.
The recent dip raises concerns among traders and investors, especially after notable crypto figures, including Arthur Hayes, previously speculated that SEED_WANDERIN_JIMZIP900:WIF could surge to $5. However, current market conditions and technical indicators suggest a different scenario.
Technical Analysis
- Support and Resistance Levels: The one-month low is acting as a short-term support zone. A break below this level could push SEED_WANDERIN_JIMZIP900:WIF further down to $0.29, a critical foreseen support level that might stabilize the asset.
- Fibonacci Retracement Levels: The 38.2% Fibonacci retracement level serves as a key pivot point at $1.24. If SEED_WANDERIN_JIMZIP900:WIF can break above this level, we could see a potential rally towards $2.50 and beyond.
- Relative Strength Index (RSI): With SEED_WANDERIN_JIMZIP900:WIF ’s RSI currently approaching oversold levels, traders may see a short-term bounce, but the overall trend remains bearish unless key resistance levels are broken.
Fundamental Analysis
Dogwifhat ( SEED_WANDERIN_JIMZIP900:WIF ) remains a dominant meme coin on the Solana blockchain, enjoying strong community engagement and significant exchange listings. Here’s a look at its market performance:
- Trading Volume: SEED_WANDERIN_JIMZIP900:WIF ’s 24-hour trading volume surged to $1.62 billion, marking a 134.7% increase, signaling heightened trading activity.
- Exchange Listings: Major exchanges like Binance, MEXC, and LBank continue to facilitate active trading, keeping SEED_WANDERIN_JIMZIP900:WIF accessible to a global audience.
- Historical Performance: Despite its recent decline, SEED_WANDERIN_JIMZIP900:WIF remains significantly above its all-time low of $0.001555 recorded in December 2023, reflecting a massive 54,054.03% increase.
Market Sentiment & Outlook
The ongoing bearish sentiment in the broader crypto market has contributed to SEED_WANDERIN_JIMZIP900:WIF ’s decline. However, meme coins often rely on speculative momentum and social engagement, meaning a resurgence is possible if investor sentiment shifts.
Conclusion
Dogwifhat ( SEED_WANDERIN_JIMZIP900:WIF ) faces a critical test after breaching the $1 support. While the short-term outlook appears bearish, traders are closely watching key support and resistance levels to determine the next move. With strong trading activity and major exchange listings, SEED_WANDERIN_JIMZIP900:WIF is still a player in the meme coin space, but investors should tread carefully amid current volatility.
SOLANA double bottomed on 1day MA200. Target $400.Solana / SOLUSD is trading inside a Channel Up since the July 29th 2024 high.
The price hit today the 1day MA200 for the 2nd time since January 13th and instantly rebounded.
Technically this makes it a Double Bottom formation and took place right at the bottom of the Channel Up.
The pattern is very similar with the Megaphone of May-August 2024 that was followed by a strong uptrend, the bullish wave of the Channel Up.
Their 1day RSI patterns are identical.
Buy and aim for a +140% rise from the bottom. Target 400.
Follow us, like the idea and leave a comment below!!

Avax analysis and review: another rise or fall?hello guys
We came with Avax analysis.
This coin has been suffering for almost 35 days after its price drop, and now that the price is at the bottom of the trading range, it is expected that we will have an upward movement by maintaining the support range up to the ceiling of the trading range.
In case of failure, we will give you a new update.
*Trade safely with us*

sui analysis: Safe shopping...hello friends
Considering the good upward trend we had, now that the entry price has been corrected, it is a good time to buy in steps and with capital management.
We have specified for you the steps of buying which are the support areas.
We have specified for you the goals, which are the resistance.
*Trade safely with us*

The Bitcoin Peak: When Will the Cycle End?Been a while since I published a TA. I’ve been digging deep trying to decipher when the cycle top will come in for Bitcoin. Some say it’s an impossible feat. Well, let’s give it a go.
There are two major dates and one minor date for a possible cycle top:
May 2025
**Volume Flow**: 1157 Days
**From June Bottom**: 1064 days
**ETH clear bottom**: June 2022
**Bar Pattern Fractal**: From 2015 bottom
**221k Price Target**: Target crosses with the model in May.
September 2025
**From November Bottom**: 1064 days
**Major Macro Time Fibonacci**
**Chainlink Fractal**
**Chainlink Time Fib**
March 2025
**Small Time Fibonacci**
**Bull Flag End**
**Average % move and time since 2019**
As you can see, there is a lot of evidence to unpack here, so it’s going to be a long one. Let’s start with the first date: May 2025.
---
May 2025
Volume Flow on Heikin Candles on the Monthly shows that from the Bearish cross to the cycle top is 1126 days, which ends up being May.
Every cycle, Bitcoin has always put in a double bottom to mark its cycle low. As you can see, in 2022 we had two major crashes, and even though it’s not 100% clear here, we got a double bottom.
The amazing thing about the first bottom in June 2022 is that it mirrored the first bottom of the cycle low of 2015. That fractal was a mirror, showing the importance of this first low in Bitcoin in June 2022.
If we overlay the 2015 fractal, we get the top coming in May.
For anyone who doesn’t know, the last two cycles, Bitcoin has taken 1064 days from Cycle Low to Cycle Top. 1064 days from the June 2022 low is May.
ETH has a much clearer bottom than Bitcoin this cycle. It also took 1064 days, which puts it in May.
So you can see, there is a lot of evidence pointing towards a May 2025 Cycle Top for Bitcoin.
---
September/October 2025
1064 days from the second bottom in November 2022 would be October 2025.
For years, I have been using this Major Macro Time Fibonacci sequence that shows me important moments in Bitcoin’s cycles. The last pointed to a move down to 48k in August 2023, which is hard to see on the 2Week chart.
As you can see, it comes close to pinpointing moves, so the next date is the end of September 2025, which lines up with the 1064 days from November 2022.
I have been following this Chainlink fractal for more than a year. We traded LINK using this fractal back in October 2023. You can check my TAs from that period. The fractal is still valid and tops in September 2025.
Chainlink Fibonacci Time Sequence has been hitting home runs time and time again, from pinpointing the top all the way down to the bottom. The next date is late August 2025, very close to September 2025.
---
March 2025
This date has far less weight for a cycle top but could be part of a major local top and correction.
A small Time Fibonacci sequence taken from this level shows that March 31st is the next date, and the one after that is late August 2025, the same as the Chainlink fractal.
240% over 162 days is the average that Bitcoin moves up since 2019. If we just overlay the average, we get 127k by mid-February 2025.
A mirror move from October 2023 to March 2024 puts us in March 2025.
---
Elliott Wave Section
I’m not an expert in this field but will throw in some takes.
Could we possibly be in Wave 4 out of 5?
Or could we be finishing Wave 3 right now and in for the first large correction of this bull market?
The fact is, the last time we hit this band on this model was January 2021. After that, there was a 31% correction lasting 31 days.
Sometimes 5 waves are very clear. Take GOLD, for example: there is a clear 5-wave pattern at max Fibonacci extension. This is a massive macro sell signal, in my opinion. Crazy how GOLD hit this level on Wave 5 as Bitcoin breaks 100k.
---
### **Price Targets
If we take the first cycle and overlay to 2015 cycle, it gave us the cycle top in 2021.
If we do the same for this cycle and overlay the 2015 cycle, we get a price target of 221k, which puts it at the top of my model in May 2025. Just discovered this—that’s one more point for May 2025.
As you can see, in the last two cycles it worked. Will it work this time? Who knows.
---
Pi Cycle Indicator
If we just run a rough projection on when the next cross will be, it crosses in April 2025, very close to May. Keep in mind this is a very rough idea of when it could cross.
---
Conclusion
We have 5 points in favor of May 2025, 4 points in favor of September 2025, and 2 points for March 2025. As always, the path is never clear for Bitcoin. Until we get much further down the road, I won’t conclusively know which date it will be.
This model I have been using has been so accurate thus far. We are so high up the last bands that we are most likely going to get some sort of long consolidation period with a correction soon, which would give the altcoin market a run.
