Your SOUL is for SOLSO SOL looks very nice to cruise up as stated earlier, targets for 161 can be seen!
SOL

SOL Ready To Breakout?SOL had a decent move this weekend overcoming descending resistance and now testing as support.
Price appears to have a completed a wave (2) at the .618 Fibonacci retracement and S1 daily pivot and a larger degree wave 2 at the channel bottom, High Volume Node support and .618 Fibonacci retracement.
If a wave (3) of 3 is underway then we should expect a strong move sooner rather than later with an initial target of the swing high resistance a/ R2 daily pivot $208-$216 range
Safe trading.

WIF back to $3Complete look at Dog WIF Hat
We had some pretty nice technical setups on this meme.
#HVF
#DoubleTop
#InverseHeadandShoulders
#BullFlag
Currently it has two active patterns ...

$420 Solana Within 2 Months —TargetsSolana is on a path to a hit a price target of $420 mid-term, within 1-3 months. This is the continuation of the uptrend that started in early April with the end of the previous correction and a more than a year long strong low.
This is not for the faint of heart. Solana is preparing for something massive, even scary but positive. $600+ is also possible but we are going step by step and $420 is the first step.
Immediately when prices start to rise Solana is likely to find resistance around $220 and $253.
The last high, January 2025, would be the minimum on this bullish wave. This would be price tag of $296.
The end of the retrace happened 22-June. This means that the market is already bullish for an entire week. Bitcoin is about to produce the best possible weekly close. As Bitcoin is ultra-bullish above $106,000/$107,000, the altcoins can continue to recover and will aim higher trying to catch up. Of course, no altcoin can catch up to Bitcoin but invariably the entire market will grow.
The wait is over, we are bullish now. Timing is great.
Bullish momentum will grow for weeks and then a major force will permeate the market, something not seen in many years. I hope you are prepared.
Namaste.

$SOL Bullish Engulfing On WeeklyCRYPTOCAP:SOL closes the week with a Bullish Engulfing candle.
50WMA at $170 next target to smash.

NothingThe SOL will increase $150 and reach to the top of the wedge in the coming weeks .
Best regards CobraVanguard.💚

SOL - You take its SOUL!SOLLLLL is going to get a hump of liquidity touch it and fall down, what can be more better than knowing what you doing hahahahha

HolderStat┆SOLUSD breakoutBINANCE:SOLUSDT on the 6h chart has shifted from a falling to a growing channel structure. Support around $135 held, and now the price is eyeing $160–$170. Previous breakouts from similar structures have triggered steep gains.

SOL - It won't take your soul!SOLOLOL - SOL basically can go direct or if not a halt and a move! But all is interlinked and intertwined to btc!

SOL/USD🔹 Trend direction
Current short-term trend: down
Price below key moving averages:
SMA50 (green) ≈ 154.84
SMA200 (blue) ≈ 168.79
Price ≈ 142.49 – below both, confirming weakness.
🔹 Supports and resistances (key levels)
✅ Supports:
142.00–143.50 – current level where price is struggling (multiple price reactions).
131.00 – strong support, last low (June 18).
119.00 / 116.00 / 113.00 – next supports from previous consolidations.
95.61 – deep support if market breaks down.
❌ Resistances:
148.00–150.00 – local resistance, coinciding with the red SMA (short-term resistance).
154.84 – resistance (SMA50).
162.00 – resistance (SMA200).
183.00 – main resistance from the May peak.
218.55 – very strong resistance from March.
🔹 Technical indicators
📉 MACD:
MACD line < signal, negative histogram → bearish signal.
No signs of bullish strength.
📉 RSI:
RSI ≈ 41.31 – close to the oversold zone, but not there yet (below 30).
RSI trend also downward.
🔹 Formations and trend lines
Broken support line after the April-May bullish structure (white trend line).
The previous bearish trend line (yellow) was broken in April, but the momentum did not hold.
A lower high and lower low may be forming now – a classic bearish structure.
🔹 Potential scenarios
🔻 Bearish:
Breakout of 142 → test of 131 → possible drop to 119/116.
Staying below SMA50 and MACD still negative = high chance of continuing declines.
🔼 Bullish:
Recovery of 148–150 needed → only then a chance to test 154 and SMA50.
RSI close to oversold = possible local technical bounce, but not reversing the trend.
📌 Conclusions / Summary
General trend: Bearish (down).
Sentiment: Negative, no confirmed signals of strength.
If level 142 breaks - next test will be at 131.
A strong breakout above 150-154 is needed to talk about a change in structure.

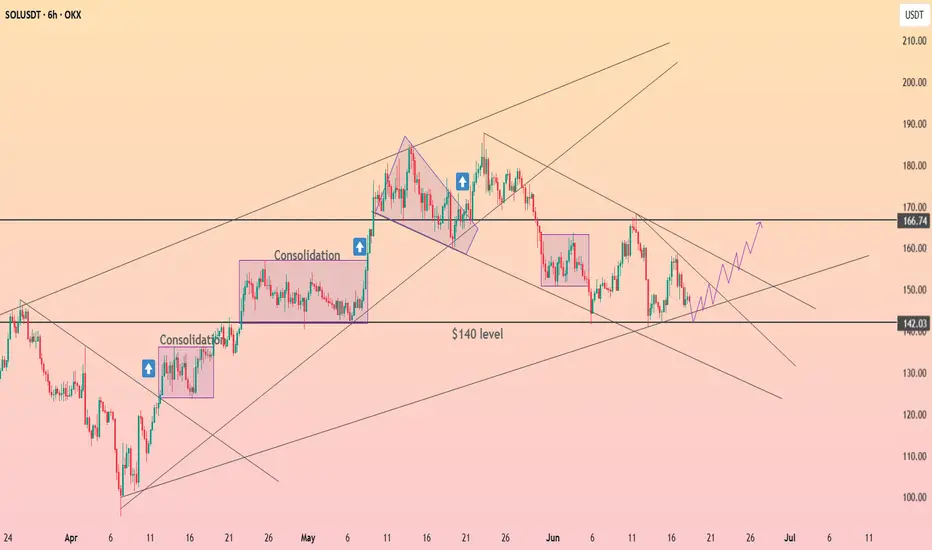
HolderStat┆SOLUSD above the supportBINANCE:SOLUSDT reclaimed the $140 level after a wedge breakout and is now forming a stair-step recovery structure. The price is targeting the mid $150s with higher lows supporting the bullish thesis. Previous consolidations and wedge formations suggest buyers are regaining control. Continued strength above $140 reinforces the move.

Give me your SOL!!SOL not SOUL!! Just look at it and understand your stances whats gonna happen if it happens!

Most see rejection. I see a launchpadWhat looks like a failed breakout is actually SOL setting up for a higher timeframe reversal, right at a refined zone of inefficiency and Smart Money interest. The narrative isn’t over — it’s just beginning.
Technical Breakdown:
Current Price: ~$143.30
Context:
Price tagged the Fair Value Gap (FVG) on the daily and showed reaction — a sign of algorithmic awareness
Volume profile suggests thin liquidity above, ripe for expansion if momentum kicks in
Key Levels:
FVG (1D) zone: just under current price (~140.19)
Order Block (OB): ultimate demand zone near 137.23 — strong structural support
Downtrend Line: recently broken, retest in motion
Major Upside Target: 168.36 — a clean liquidity magnet
Strategic Thesis:
Price dipped into FVG but held above the OB — a classic Smart Money accumulation setup
The dashed projection shows potential higher lows forming, giving fuel for a push through prior highs
FVG + OB form the discount zone, where risk/reward is maximized before the next impulse move
Execution Plan:
Entry zone: $140.00–137.50
→ Expect small shakeouts before confirmation
Invalidation: Daily close below $136 kills the bullish case
Target:
Primary: $168.36
Stretch Goal: $172–176 if momentum is sustained into August

Something Like ThisI believe the charts are pointing towards the market gearing up for a play somewhat like this.
The timing may well be off, but the levels and sequence seem broadly predictable.

$SOL Local Bottom FormingCRYPTOCAP:SOL closed the day back within the POI.
RSI oversold.
Should see a retest ~$136 to confirm the local bottom.

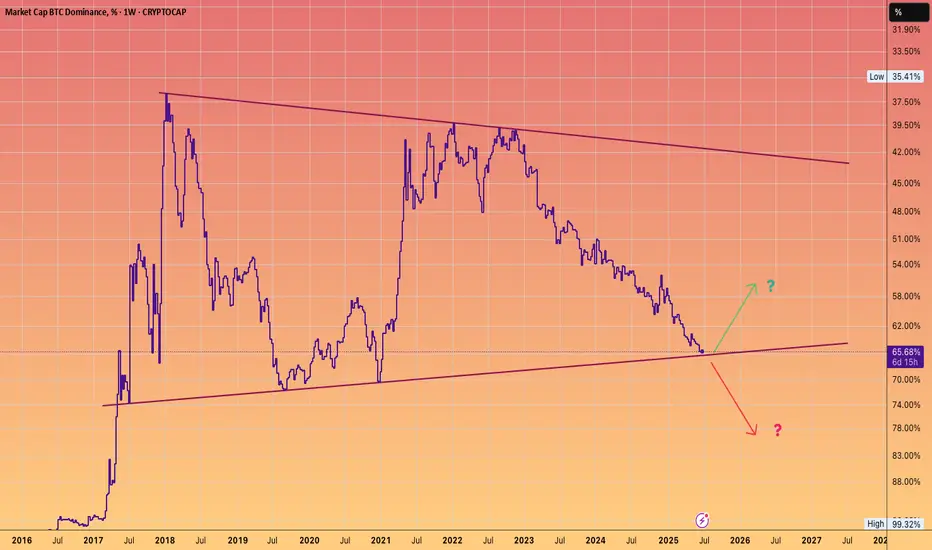
BTC DOMINANCE at pivotal juncture.Which direction do you favour?
The chart is inverted, so the up move will result in #Alts outperforming #Bitcoin.
Solana Breakdown Incoming? These Are Key Levels To WatchYello, Paradisers! Are you ready for the next major flush? After failing to gain momentum since the May double top breakdown, #SOL is now showing even more bearish signs, and the market might be about to punish late bulls one more time.
💎Following the confirmed double top in May, SOL has struggled to reclaim any upside momentum. Now, on the 12-hour chart, a classic head and shoulders formation is emerging, a pattern that often precedes larger trend reversals when the neckline breaks.
💎#SOLUSDT is hanging onto critical support between $142 and $140. This zone is the neckline, and it’s the last stand for bulls. If bears break it, we get a clear breakdown confirmation, with a clean path down toward $130–$127, which marks the first major demand area.
💎That initial support likely won’t hold for long. If pressure continues, SOL is expected to drop further toward the $115–$110 region. This is not just a technical support, it’s also the target area of the H&S formation, making it a magnet zone for price.
💎Adding to the bearish developments, a death cross has now been confirmed on the 12-hour chart. The EMA-50 has crossed below the EMA-200, reinforcing short-term downside pressure. Even if a relief bounce occurs, the $155 region, where the EMA-50 sits, will likely act as fresh resistance and attract renewed selling.
Paradisers, strive for consistency, not quick profits. Treat the market as a businessman, not as a gambler.
MyCryptoParadise
iFeel the success🌴

SOLANA MARKETCAP LOOKS COOKEDIs that a Head and Shoulder's top?
Is #crypto about to endure a Iron dome penetration event?

SOL - Reaching 200??? Can it be that accurate?? LOLSooooo can you see how accurate it is the way i drew and the way it is going ? Its going to go the way I said, observe and take your stancesss!

SOL – Sweep & Spring Play at Local DemandWe’ve got a clean rounded top → breakdown → demand sweep setup.
Current price action suggests a potential reversal is brewing.
🔍 What’s happening on this chart?
Rounded top marks a local distribution — aggressive short entries
Price broke lower, swept the demand zone (gray box), and now shows rejection wick + bullish reaction
Fibonacci levels mapped out the structure
0.5 = 154.51
0.618 = 157.76 = key resistance liquidity zone
🎯 Trade idea:
Entry: inside demand zone (OB marked on chart)
Target 1: 151.25
Target 2: 157.76 (0.618)
Full fill: 162.40 – 168.30 (complete inefficiency sweep)
🧠 Mindset:
This setup is classic spring + reclaim. If price consolidates and flips 147.2, upside becomes favorable.
If you like clean trade setups with logic and clear invalidation, check the account bio for more updates and live breakdowns.

Solana SOL price analysis📞 Rumor has it that as soon as the global geopolitics reach a “temporary lull”, the following ETFs will be launched
Solana ETF is the most likely to be the next one (but there are at least 2 coins more on the list, which we will talk about in the coming days)
🪙 So, are you ready to buy CRYPTOCAP:SOL in your investment portfolio? For example, in the range of $117-123
🤖 Maybe we need to launch a long trading bot OKX:SOLUSDT so that it can buy in micro portions on the current possible price correction to get a “tasty price” as a result
◆ Would you like to join such a trading bot and copy them?
◆ And then compare the results with all “ETF candidates”
_____________________
Did you like our analysis? Leave a comment, like, and follow to get more

HolderStat┆SOLUSD accumulation before growthOKX:SOLUSDT respects the $140 axis and tests the roof of its falling channel. Holding that shelf lets bulls aim for 160-170 and keeps the broader up-channel alive; a dip under 135 would postpone the rally but not derail the long-term trend ⚡️
Short on SOL Here is a short idea on SOLUSDT perpetual contract on Binance.
I also include my overall analysis. I hope you find this useful.
Thank you!
- R2F Trading
