SOL Trade Blueprint: Waiting for the High-Conviction EntryAfter printing a SFP at the key high of $180.52 followed by a sharp -8% rejection, SOL made a second attempt to breach the major resistance zone between $180–$185 — but once again, bulls fell short. Since then, price has been in a corrective phase. So the big question is: where’s the next high-probability trade setup? Let’s zoom out and break it down.
📏 Zooming Out: Structure, FVG & Fib Confluence
Back on May 8th, SOL broke through the April 25th swing high at $157 with strong momentum, leaving behind an untested Fair Value Gap (FVG) — a key displacement area that’s yet to be filled. When we draw the Fibonacci retracement from the low of that move to the current high, the 0.618 retracement lands precisely at $157.34 — right on the old breakout high. That’s a beautiful confluence.
Timing-wise, if SOL pulls back to that level between May 21–22, the 0.75 Fib speed fan also kicks in — adding dynamic trendline support to the static Fib level.
📉 What About the $164 Golden Pocket?
There's a golden pocket forming around $164 from a recent mini-impulse, and while it may look tempting, context matters. This pocket isn't supported by enough confluence — no major structure, volume shelf, or EMA alignment. For a quick scalp? Yes. But for a high-conviction swing? It's not ideal.
Remember, in trading we're not here to chase every candle — we're here to wait for the setups that stack the most reasons to say yes.
📍 The Zone to Watch: $157
Now let’s talk about that $157 zone — and why it’s standing out as the highest-probability long setup:
0.618 Fib retracement of the major impulse
Retest of the breakout swing high
Untested Fair Value Gap (FVG)
233 EMA + 233 SMA on the 4H timeframe lining up as dynamic support
1.5 outer pitchfork support line crossing through
1:1 trend-based Fib extension confluence
Prior area of interest
This is what we call a “stacked setup.” The more layers of confluence, the more conviction we have in the trade. Add to that the potential for a liquidity sweep (SFP) just below the current low at $159.44 — and it becomes a zone worth watching closely.
🎯 Long Setup:
Entry: $157–$159.44 (watch for SFP confirmation)
Stop-Loss: Below $154
Target: $200
R:R: Approx. 1:12 — a setup worth being patient for
🧠 Educational Note: Why Confluence Is King
High-probability trades don’t come from guessing. They come from stacking confluence: structure, Fibonacci, moving averages, time-based levels, pitchforks, VWAPs, volume profiles — the more that lines up, the less you need to hope and the more you can trust your edge. Think like a sniper, not a machine gun.
The market rewards patience and precision — not noise and FOMO.
🔻 Short Setup (Alternative Play)
While we’re primarily bullish, there’s a valid short opportunity at the psychological $200 mark — but only if price shows clear rejection and confirmation (e.g. SFP, bearish engulfing, high volume reversal).
Entry: $200 rejection
Stop-Loss: Above $205
Target: $185–$180
R:R: Approx. 1:3+
🔥 Final Words: Trade With Purpose
This is what trading is about — not chasing green candles, but waiting for structure, clarity, and alignment. Whether you’re trading long or short, focus on high-conviction setups backed by logic and levels, not emotion.
Don’t trade for action. Trade for precision. The market will always reward the patient ones who are willing to wait for that clean entry, stacked with reasons to act.
Trust the process, stay disciplined, and let the charts do the talking. 💪📈
___________________________________
If you found this helpful, leave a like and comment below! Got requests for the next technical analysis? Let me know.
SOL


Binance Blinked! High level of USDC volume across Binance..Binance has for many years tried their own versions of buying US debt with USD made from selling a stablecoin of their own. This has been squashed nearly every time and has most likely hindered the flow on binance itself.
It seems binance may have blinked. USDC has been flooding into Binance this year maintaining often very high levels of relative volume. This flow is overall better than if neither party capitulated. Must be careful of different streams of volume fragmenting both bullish and bearish data. While USDT is seeing all time highs its market share is falling with the wider adoption of stablecoins on chain and in traditional finance.
All this is occuring as stablecoin regulation is being passed in the US www.tradingview.com and Dimon says NYSE:JPM will be buying COINBASE:BTCUSD for clients soon

sol sell midterm"🌟 Welcome to Golden Candle! 🌟
We're a team of 📈 passionate traders 📉 who love sharing our 🔍 technical analysis insights 🔎 with the TradingView community. 🌎
Our goal is to provide 💡 valuable perspectives 💡 on market trends and patterns, but 🚫 please note that our analyses are not intended as buy or sell recommendations. 🚫
Instead, they reflect our own 💭 personal attitudes and thoughts. 💭
Follow along and 📚 learn 📚 from our analyses! 📊💡"

Solana – Speculative Long Trade Setup Ahead of Narrative CatalysDespite BTC and ETH rallying, SOL has lagged, making it a potential rotation play as capital moves across majors. With attention building around the Internet Capital Markets narrative, SOL may soon attract speculative inflows, especially given its historical performance during sector-wide momentum shifts.
🔹 Entry Zone:
$152 – $154
🎯 Take Profit Targets:
🥇 $172 (local resistance / prior rejection zone)
🥈 $181 (next HTF resistance and possible momentum breakout zone)
🛑 Stop Loss:
$144 (invalidates current short-term bullish structure)

HolderStat┆SOLUSD 165 retest could launch 195-200CRYPTOCAP:SOL escaped a falling channel in April and has since respected a well-behaved growing channel. After tagging 180 USDT resistance, price is backing into the channel heart around 170 with potential for a classic 165 support retest. A bounce there would position bulls to challenge the 180 lid again and potentially sprint toward the channel extension at 195-200 USDT. Breakdown below 160 would mark the first technical warning of fatigue.

Poised for a Breakout at $168?Solana is currently trading around $168, showing a period of consolidation after some recent volatility. The price has been hovering in a tight range over the past few hours, which often signals that a bigger move could be on the horizon. With the broader crypto market showing mixed signals, SOL’s ability to hold this level suggests it’s gathering strength, but traders should stay alert for a breakout.
Recent News:
Solana’s ecosystem has been buzzing lately, with its decentralized finance (DeFi) sector showing solid growth, total value locked (TVL) recently jumped from $7.5 billion to $9.6 billion as of May 2025. This uptick reflects growing confidence in the network’s high-speed, low-cost transactions. On the flip side, over 1.4 million SOL tokens were unstaked in the past week, adding some selling pressure.
Meanwhile, Bitcoin’s stability above $100,000 provides a supportive backdrop for altcoins like SOL, though any sudden market shifts could sway the momentum.
Technical Analysis:
Solana is sitting just above the 50-hour moving average at $165, which is acting as a short-term support. The 200-hour moving average at $160 offers a stronger safety net below. As long as the price stays above $165, the short-term trend leans bullish.
A bullish flag pattern seems to be forming, hinting at a potential upward breakout. If SOL pushes past the $170 resistance, it could aim for $180 next.
The RSI is at 55, showing neutral momentum with room to climb before hitting overbought territory. The MACD is teasing a bullish crossover, which could confirm stronger upward pressure if it completes.
Watch $165 as key support, with $170 as the immediate resistance. A break above $170 opens the door to $180, while a drop below $165 might test $160.
SOL is at a pivotal moment on this 1-hour chart. Positive network developments and a stable broader market give it a bullish edge, but the recent unstaking adds a layer of caution. If the price clears $170, a run to $180 looks likely, especially with technical indicators tilting upward. However, a failure to break resistance could see it retest $165 or lower. Traders should keep an eye on volume and the $170 level—any surge there could signal the next big move!

$SOL and Most Major Alts Get Hard Rejection from 200DMAMost of your favorite Alts such as CRYPTOCAP:SOL had hard rejections from the 200DMA.
If this trend breaks into the red box we should see a retest around the .236 Fib and 50DMA ~$140
RSI also looks McDonald's toppy
Not a good time to FOMO.
PS. Normally i dont post TA this late in the night from the US but I'm gonna consider doing more if i get some decent engagement.
Lmk if you think i should post more at these midnight hours 🎃

TradeCityPro | SOL: Key Retest at Support Before Next Breakout👋 Welcome to TradeCity Pro!
In this analysis, I’m going to review the SOL coin—one of the most requested assets and a very popular project in the crypto space.
✔️ This coin holds a market cap of $3.61 billion and is ranked 6th on CoinMarketCap.
⏳ 4-Hour Timeframe
As you can see, a bullish leg started from the 142.25 support and extended up to the 177.51 resistance.
🔍 Currently, after a fake breakout of 177.51 and a rejection from 183.86, the price has dropped back below 177.51 and formed a support level around 166.82.
📈 So far, the price has tested the 166.82 level twice and shown a strong bullish reaction. Recently, a powerful support candle has formed at this level, suggesting it’s being defended.
💥 If the price can move back toward the upper levels, a breakout of either 177.51 or 183.86 would provide a long entry trigger. If a higher low and higher high form before the breakout of 177.51, the trigger becomes even more reliable.
📊 Market volume has declined since the upward move ended. If volume increases as price rises again, it would provide a volume confirmation.
🔽 For a short position, the 166.82 level serves as a valid trigger. In my view, it’s a strong enough level to justify opening a short. The next major support below lies at 142.25.
❌ Disclaimer ❌
Trading futures is highly risky and dangerous. If you're not an expert, these triggers may not be suitable for you. You should first learn risk and capital management. You can also use the educational content from this channel.
Finally, these triggers reflect my personal opinions on price action, and the market may move completely against this analysis. So, do your own research before opening any position.

ALTCOIN BOOM FOR SAROS 2025-2026 PROPOSALIntro & Core Info SAROS ($SAROS) is a decentralized finance (DeFi) ecosystem built on Solana, focusing on liquidity solutions, decentralized exchange (DEX) aggregation, and cross-chain swaps. It aims to solve fragmented liquidity across Solana-based protocols while offering low fees and near-instant transactions. Think of it as the "Uniswap of Solana," but with ambitions to bridge ecosystems like Ethereum and Cosmos.
Recent News Launched "Saros Super Pool," a concentrated liquidity protocol with $50M TVL in its first week. Partnered with Jupiter Exchange to integrate Solana’s largest DEX aggregator into Saros’ interface. SAROS price jumped 60% in July, fueled by Solana’s resurgence.
Deep Dive Solana’s DeFi TVL has tripled in 2024, and SAROS is riding the wave. The Super Pool launch taps into Solana’s speed to attract yield farmers, while the Jupiter collab positions SAROS as a one-stop trading hub. However, Solana’s history of network outages remains a risk. If SAROS can’t ensure uptime during congestion, users might flock to rivals like Raydium.
Latest Tech or Utility Update
Update Details Saros deployed "Cross-Chain Swaps" this month, enabling asset transfers between Solana, Ethereum, and Binance Smart Chain via Wormhole bridges. Also introduced "Dynamic Fees," which adjust based on network congestion.
Implications Cross-chain swaps could make SAROS a hub for multi-chain traders, but reliance on bridges like Wormhole introduces security risks. Dynamic Fees help retain users during Solana’s traffic spikes, but if fees rise too high, it might negate Solana’s low-cost advantage.
Biggest Partner & How Much Was Invested
Partnership Spotlight Jupiter Exchange invested $5M in SAROS’ liquidity incentives program, locked for 12 months.
Impact Analysis Jupiter’s liquidity dominance on Solana gives SAROS instant access to deep order books. This partnership could funnel Jupiter’s user base into SAROS’ Super Pools, creating a flywheel effect. If successful, SAROS becomes the go-to for Solana yield farming.
Most Recent Added Partner & Details
New Collaboration Saros partnered with marginfi (Solana lending protocol) to enable leveraged yield farming. No direct investment, but revenue-sharing on margin trading fees for 18 months.
Future Prospects Leveraged farming could attract degens and boost TVL, but overcollateralization risks could backfire during market crashes. Short-term, this adds hype; long-term, it tests SAROS’ risk management.
Tokenomics Update
Token Dynamics Burned 1.5M $SAROS (3% of supply) in July via protocol revenue. Staking rewards now include 20% of swap fees (up from 10%). DAO voted to extend token vesting for team tokens by 2 years.
Deep Analysis Burns + fee-sharing make $SAROS more deflationary, but the token’s value hinges on volume. Extended vesting reduces sell pressure, signaling team commitment. However, if trading activity stalls, stakers could dump rewards.
Overall Sentiment Analysis
Market Behavior Retail traders are FOMO-ing into $SAROS (social mentions up 300%), while whales are taking partial profits. Funding rates turned negative on derivatives, suggesting short-term caution.
Driving Forces Hype around Solana’s comeback and leveraged farming. Concerns linger about Saros’ ability to scale without Solana-level outages.
Deeper Insights Sentiment is overly tied to Solana’s performance. If SOL dips, SAROS could crash harder. But if Solana’s DeFi summer continues, SAROS might outperform.
Recent Popular Holders & Their Influence
Key Investors Alameda Research survivor wallet bought 500K $SAROS. Solana co-founder Raj Gokal praised Saros’ UX in a tweet.
Why Follow Them? Alameda’s remnants are known for trading Solana ecosystem gems aggressively. Raj’s endorsement signals insider confidence, which could attract more builders to Saros.
Summary & Final Verdict
Recap SAROS is Solana’s liquidity aggregator on steroids, combining cross-chain swaps, leveraged farming, and deep Jupiter integration. Its tokenomics are tightening, and Solana’s revival gives it tailwinds.
Final Judgment $SAROS is a high-beta Solana play . If you’re bullish on SOL’s comeback, this could 3x-5x. But if Solana stumbles, SAROS will bleed harder than blue chips.
Considerations Can Saros’ infrastructure handle Solana’s next congestion crisis? Will leveraged farming lead to cascading liquidations in a crash? How dependent is SAROS on Jupiter’s continued dominance?
If you’re riding the Solana wave, buy the dip. If skeptical about Solana’s reliability, stay clear.

Solana (SOL) Cup & Handle (1W Log)BINANCE:SOLUSDT has formed a Cup & Handle pattern on the weekly chart, and arguably already broke out of the handle.
The measured move target based on the linear depth of the cup is ~$510.
Key Levels to Watch
• ~$100: Local low and 0.618 Fib of the cup depth, a typical handle retracement in a Cup & Handle pattern.
• $260: Cup & Handle neckline and key horizontal resistance. A decisive weekly close with strong volume above this level would confirm the pattern and activate the measured move target.
• $510: Measured move target based on the depth of the cup from the neckline.
Considerations
Volume confirmation remains key. A breakout above $260 with strong volume could validate the pattern and open the path to $510.

SOL-USD 12h Chart ReviewHello everyone, let's look at the 12h SOL to USD chart, in this situation we can see how the price came out sideways from the downtrend line, then formed a downtrend channel, the exit from which gave a strong rebound creating a new uptrend.
Let's start by defining the targets for the near future that the price must face:
T1 = 172 USD
T2 = 195 USD
Т3 = 218 USD
Т4 = 252 USD
Now let's move on to the stop-loss in case the market continues to fall:
SL1 = 151 USD
SL2 = 130 USD
SL3 = 115 USD
SL4 = 96 USD
It is worth paying attention to the Stoch RSI indicator, where you can see how the current correction has strongly reacted on the indicator, which may give room for another stronger uptrend.

Nothing !!!The SOL will increase $150 and reach to the top of the wedge in the coming weeks .
Give me some energy !!
✨We spend hours finding potential opportunities and writing useful ideas, we would be happy if you support us.
Best regards CobraVanguard.💚

HolderStat┆SOLUSD 180 $ flip, 200 $ nextSolana price escaped April’s consolidation box, flipped the old down‑sloping resistance into a rising support line, and is now pressing the 180 $ ceiling inside a well‑defined growing channel. A decisive daily close above 180 transforms that barrier into a launch pad, opening the measured channel extension toward 200‑205 $. Channel lows near 150 remain key invalidation for the bullish momentum.

$SOL rejecting resistance $50-75 targetSol looks to be rejecting resistance here, which sets it up for a large move lower.
I think it's likely that unless price can flip the resistance above as support, that we revisit the support levels.
Pretty simple chart. All of crypto looks the same, look out below.

SOLUSD: Can it hit $1000?Solana is heavily bullish on its 1D technical outlook (RSI = 67.130, MACD = 11.423, ADX = 35.600) and just last week only crossed over its 1W MA50 again. This rebound started exactly on the 1W MA200, after holding the HL trendline of the Bull Cycle. Last time SOL crossed above its 1W MA50 after a HL, was on September 25th 2023 and a +1,122% rally unfolded. If macro and fundamentals assist, SOL can repeat this and reach the 1k mark (TP = 1,000).
## If you like our free content follow our profile to get more daily ideas. ##
## Comments and likes are greatly appreciated. ##

SOLUSDT may rise to 200.0 after long-squeezeMarket maker collected liquidity from 168.5 (liquidation of buyers, entry of sellers and subsequent liquidation of sellers)
After a false breakdown the price went up on a light wave
After the long squeeze, the price is already going to continue the trend with peace of mind.
Ahead is a strong resistance from D1 180 - 180.3.
A break of the level will attract buyers. The target may be 200 - 205
Scenario: a retest of the resistance may end in a small correction. If there is no reversal and the price continues to test 180-180.3, we can expect a breakout, which may attract buyers and further growth to 200 - 205.


$SOL About to Outperform $ETHToday looks like a good day to flip your CRYPTOCAP:ETH for CRYPTOCAP:SOL 😎
Flirting with the 200DMA,
RSI has bottomed,
feels good man 🐸

HolderStat┆SOLUSD fixed above the trend lineSOL spent March in a messy consolidation box before rotating into a disciplined rising channel that has marched price from 110 to the doorstep of 180. Bulls are now wrestling with that major horizontal barrier; acceptance above it would turn the former ceiling into fresh support and open the calculated channel extension toward 205. Until channel lows around 150 give way, trend traders may lean on pullbacks inside the lane to stay positioned with momentum. 🔥

Solana 1-Day Chart – Are We on the Brink of a $1,000 MOONSHOT?!Solana is absolutely on fire! On this 1-day chart, we’re witnessing a massive rising channel that’s been building since 2023. After a solid rebound from the $93 support, Solana has smashed through a fractal resistance line (check that arched arrow from mid-2023 to early 2024 top) . Now, it’s breaking out at a parallel resistance, hanging around $174 — and this could be the setup for a MASSIVE move upward!
I’m calling a potential target of $1,000 if SOLUSDT can muscle through the big resistances ahead: $200, the ATH at $270, and everything beyond. This breakout screams opportunity — Solana might just catch another wave of demand and go parabolic! The $93 support (marked "Back to Nothing Below This Line") looks rock-solid, giving us a strong foundation for this rally.
Key Levels to Watch:
Support: $93 (channel base)
Current Price: $174 (breakout zone)
Resistances: $200, $270 (ATH)
Target: $1,000 (if momentum holds)
Are you ready for this? I’m buzzing — I can’t believe this might actually happen!
Let’s hear your thoughts, traders! Are we heading to $1,000, or will resistance hold us back?

SOL Inverted Head and Shoulders – Breakout Potential!🚀 SOL Inverted Head and Shoulders – Breakout Potential! 📈
SOL has formed an inverted head and shoulders pattern and is now testing the red resistance zone. If the price breaks through this resistance, the first target could be the green line level! 📊
Let’s watch this breakout unfold! 💼💸

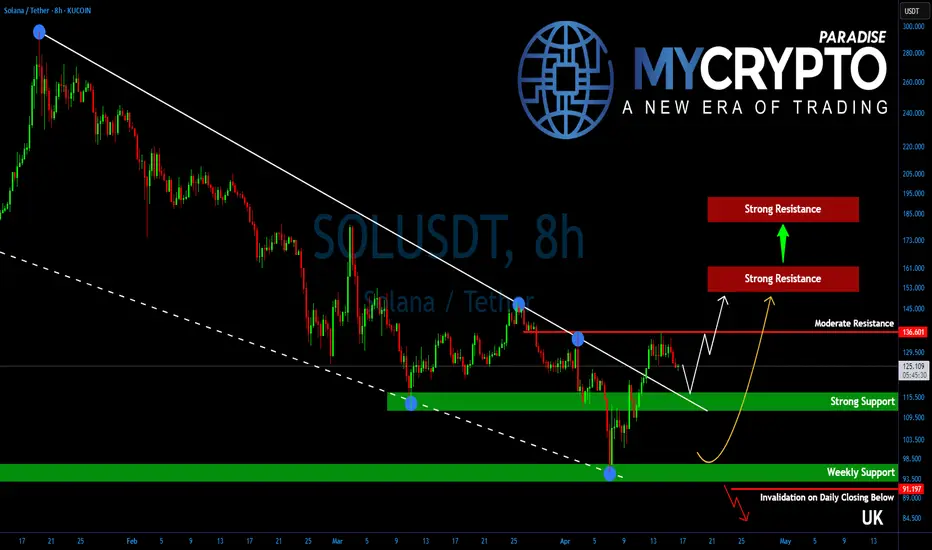
Solana Is One Breakout Away From a Bullish Explosion!Yello, Paradisers! Did you notice how #SOLUSD has been quietly positioning itself while the rest of the market remains uncertain? If you're not paying attention right now, you could be missing one of the cleanest setups on the charts.
💎After several weeks of downside grind and tight consolidation, Solana has just broken out of a falling wedge—a powerful bullish pattern that typically signals trend reversals or the start of a strong upside leg. This breakout wasn’t random either. It occurred after SOL successfully defended a key higher time frame support zone, signaling strength behind the move.
💎For #SOLUSDT, all eyes are on the $136.50 resistance level. This is a critical structural pivot. A clean break and close above this level would confirm a shift in higher time frame momentum from neutral to bullish. Until that happens, bulls still need to proceed with caution—but the setup is clearly developing in their favor.
💎Adding conviction to the idea of a bullish breakout are several supporting factors. Oscillators are showing bullish divergences, a classic sign that seller momentum is fading. At the same time, a golden cross formation on the 12-hour chart is getting closer which typically precedes sustained trend reversals and stronger moves to the upside.
💎If bulls succeed in reclaiming $136.50, the next price targets are $155–$160 as the initial strong resistance zone where some profit-taking could occur. If bulls hold strength, SOL is likely to head further higher and aim for $180–$190, which lines up with the target of the wedge pattern. This is a strong resistance zone and a level which could mark end of the corrective phase for Solana.
💎On the downside, immediate support lies between $110–$115. This is a well-defined range of demand and should offer strong buying interest if any short-term pullbacks occur.
Paradisers, strive for consistency, not quick profits. Treat the market as a businessman, not as a gambler.
MyCryptoParadise
iFeel the success🌴