SOLANA 14Months AccumulationSOLANA had a rally from $20 to $190 , and now for 14 Months is accumulating above the strong support at $100.
As the RSI ON Monthly is playing inside a falling channel, upside movement for SOL in the coming months to about $600 is very likely IMO.
Solana

Poised for a Breakout at $168?Solana is currently trading around $168, showing a period of consolidation after some recent volatility. The price has been hovering in a tight range over the past few hours, which often signals that a bigger move could be on the horizon. With the broader crypto market showing mixed signals, SOL’s ability to hold this level suggests it’s gathering strength, but traders should stay alert for a breakout.
Recent News:
Solana’s ecosystem has been buzzing lately, with its decentralized finance (DeFi) sector showing solid growth, total value locked (TVL) recently jumped from $7.5 billion to $9.6 billion as of May 2025. This uptick reflects growing confidence in the network’s high-speed, low-cost transactions. On the flip side, over 1.4 million SOL tokens were unstaked in the past week, adding some selling pressure.
Meanwhile, Bitcoin’s stability above $100,000 provides a supportive backdrop for altcoins like SOL, though any sudden market shifts could sway the momentum.
Technical Analysis:
Solana is sitting just above the 50-hour moving average at $165, which is acting as a short-term support. The 200-hour moving average at $160 offers a stronger safety net below. As long as the price stays above $165, the short-term trend leans bullish.
A bullish flag pattern seems to be forming, hinting at a potential upward breakout. If SOL pushes past the $170 resistance, it could aim for $180 next.
The RSI is at 55, showing neutral momentum with room to climb before hitting overbought territory. The MACD is teasing a bullish crossover, which could confirm stronger upward pressure if it completes.
Watch $165 as key support, with $170 as the immediate resistance. A break above $170 opens the door to $180, while a drop below $165 might test $160.
SOL is at a pivotal moment on this 1-hour chart. Positive network developments and a stable broader market give it a bullish edge, but the recent unstaking adds a layer of caution. If the price clears $170, a run to $180 looks likely, especially with technical indicators tilting upward. However, a failure to break resistance could see it retest $165 or lower. Traders should keep an eye on volume and the $170 level—any surge there could signal the next big move!

$SOL and Most Major Alts Get Hard Rejection from 200DMAMost of your favorite Alts such as CRYPTOCAP:SOL had hard rejections from the 200DMA.
If this trend breaks into the red box we should see a retest around the .236 Fib and 50DMA ~$140
RSI also looks McDonald's toppy
Not a good time to FOMO.
PS. Normally i dont post TA this late in the night from the US but I'm gonna consider doing more if i get some decent engagement.
Lmk if you think i should post more at these midnight hours 🎃

TradeCityPro | SOL: Key Retest at Support Before Next Breakout👋 Welcome to TradeCity Pro!
In this analysis, I’m going to review the SOL coin—one of the most requested assets and a very popular project in the crypto space.
✔️ This coin holds a market cap of $3.61 billion and is ranked 6th on CoinMarketCap.
⏳ 4-Hour Timeframe
As you can see, a bullish leg started from the 142.25 support and extended up to the 177.51 resistance.
🔍 Currently, after a fake breakout of 177.51 and a rejection from 183.86, the price has dropped back below 177.51 and formed a support level around 166.82.
📈 So far, the price has tested the 166.82 level twice and shown a strong bullish reaction. Recently, a powerful support candle has formed at this level, suggesting it’s being defended.
💥 If the price can move back toward the upper levels, a breakout of either 177.51 or 183.86 would provide a long entry trigger. If a higher low and higher high form before the breakout of 177.51, the trigger becomes even more reliable.
📊 Market volume has declined since the upward move ended. If volume increases as price rises again, it would provide a volume confirmation.
🔽 For a short position, the 166.82 level serves as a valid trigger. In my view, it’s a strong enough level to justify opening a short. The next major support below lies at 142.25.
❌ Disclaimer ❌
Trading futures is highly risky and dangerous. If you're not an expert, these triggers may not be suitable for you. You should first learn risk and capital management. You can also use the educational content from this channel.
Finally, these triggers reflect my personal opinions on price action, and the market may move completely against this analysis. So, do your own research before opening any position.

SOL at a key resistance area - Bullish or Bearish?SOL at $180 is at a key resistance area.
The last time we had the same pattern repeating from the trendline support that turned resistance which gave a prolong bear season. (April '22)
We need to see SOL break out past this wall of resistance above $180 to be bullish.
For now, I am not allocating capital into SOL until I see that break of resistance.

Solana: Below ResistanceOur primary scenario for Solana is that the coin is already close to the top of the green wave 4. Therefore, we expect a bearish trend reversal below the resistance at $192.33, followed by a move toward our blue Target Zone (coordinates: $56.56 – $29.87) with the green wave 5. Down there, we see an opportunity for long trades with the low of the blue wave (ii), which should be followed by a fresh upward impulse. According to our alternative scenario (probability: 38%), however, we may have already seen the low with wave alt.(ii) in blue prematurely. To validate this alternative scenario, the price would have to rise directly above the resistance at $192.33 from here and extend the blue wave alt.(iii) .

Skeptic | Solana’s Uptrend Ignites: Big Moves Ahead?Hey everyone, Skeptic here! Let’s kick off this Friday morning with a deep dive into Solana , one of my favorite coins! 😊 In this analysis, I’m breaking down the charts, spotting spot and futures triggers, and exploring what’s next for SOL. Stick with me to the end, and we’ll grow together! <3 Let’s start with the Daily Timeframe. 📊
Daily Timeframe: The Big Picture
We’re riding a solid upward channel on Solana’s daily chart. The price has reacted beautifully to the ceiling, floor, and especially the midline, which gives this channel a ton of credibility—we can trust it. After a strong price surge starting October 20 and running through January 25 , we entered a price correction. I expected a pullback to 80.78 , but we corrected to 95.15 instead. Now, we’ve formed a head and shoulders pattern, and the neckline has broken, activating the pattern. This pattern, at the end of a correction, signals a trend reversal and a continuation of the major uptrend. The target for this pattern is the height from the head to the neckline, which takes us to 202.82 —coincidentally, a key resistance level ahead. I expect we might range around that level or, if we break it, it’ll likely be a sharp and messy move. So, plan ahead to avoid FOMO or making rash moves. Our spot entry was at 151.78 , but a break above 202.82 could be another solid trigger, with a stop loss below the support at 147.97 . Don’t FOMO —wait for confirmations from SOL/BTC and Bitcoin’s action. Volume is your friend for spotting momentum, so keep a close eye on it. Let’s zoom into the 4-Hour Timeframe for long and short triggers.
4-Hour Timeframe: Long & Short Setups
After breaking the 153.29 resistance, we saw a nice rally, but then we hit some turbulence. If you look closely, the market seems to have formed a symmetrical triangle—the worst pattern for breakout and momentum-based strategies. Why? The market doesn’t care about support or resistance here, making it tough to tell if moves are fake or real. So, what’s the plan?
Let’s drop to the 1-Hour Timeframe.
The last level we got rejected from was 174.51 . If we revisit this level with rising volume and candles showing buyer strength—think good lower shadows and strong green bodies with high closes—it means sellers pushed the price down, but buyers stepped in and drove it back up. If you see this setup and we break the 174.51 resistance, you can open a long position. For shorts, since the major and secondary trends are uptrends, I’m not giving any short triggers—it’s completely against the trend, and the risk of hitting a stop loss is way too high. Be patient. Wait for this uptrend to fake out and drop below 149.07 —then we’ll hunt for shorts. 🙂 Let’s also take a quick look at SOL/BTC.
SOL/BTC Analysis
On the daily timeframe, we’ve got a clean head and shoulders pattern for SOL/BTC, with the neckline broken and a pullback to it now. This could lead to a strong rally moving forward, provided it’s not a fakeout and we don’t fall back below the support at 0.0015043. What does this mean? If the market stays in an uptrend, Solana could outperform Bitcoin. And if BTC.D is dropping during a market rally, Solana could see some serious growth. That’s the Solana breakdown! If you’ve got your own technical or fundamental analysis on this coin, I’d love to hear it—drop it in the comments so we can grow together! 😄
💬 Let’s Talk!
If this analysis helped you out, give it a quick boost —it means a lot! 😊 Got a pair or setup you want me to tackle next? Drop it in the comments, and I’ll get to it. Thanks for hanging out, and I’ll see you in the next one. Keep trading smart! ✌️

Solana (SOL) Cup & Handle (1W Log)BINANCE:SOLUSDT has formed a Cup & Handle pattern on the weekly chart, and arguably already broke out of the handle.
The measured move target based on the linear depth of the cup is ~$510.
Key Levels to Watch
• ~$100: Local low and 0.618 Fib of the cup depth, a typical handle retracement in a Cup & Handle pattern.
• $260: Cup & Handle neckline and key horizontal resistance. A decisive weekly close with strong volume above this level would confirm the pattern and activate the measured move target.
• $510: Measured move target based on the depth of the cup from the neckline.
Considerations
Volume confirmation remains key. A breakout above $260 with strong volume could validate the pattern and open the path to $510.

SOL Charging Higher: Monthly VWAP Hold Sparks Bullish MomentumSOL/USD remains in a constructive up-trend on the daily chart, trading above its monthly VWAP and an ascending trendline that dates back to March 2025. This positioning tells us that buyers have been willing to pay above the long-term average price—and that momentum is intact despite a recent cool-off from overbought levels. Volume delta readings have been modestly positive, suggesting steady buying pressure without the explosive institution-level participation seen in prior rallies. The RSI recently topped 70 before pulling back into the 60–65 range, a healthy consolidation that keeps the broader bullish bias alive.
Trade idea:
• Build long positions on small pullbacks toward the monthly VWAP (around USD 165) or along the rising trendline (~USD 160).
• Target a breakout above USD 185—ideally confirmed by a significant uptick in positive volume delta—for a move toward the next resistance zone near USD 200–220.
• Place a stop-loss beneath the trendline (around USD 155) to cap downside at roughly 10–12%, while allowing for 15–25% upside.
Current sentiment:
The market is cautiously bullish. Buyers remain in control but without overextended volume spikes, indicating measured confidence rather than euphoric buying. Keeping entries disciplined around key support levels and waiting for volume-backed breakouts will offer the best risk-reward opportunities.
#Solana #SOL #Crypto

Market Pump, real or fake news?The pump is likely to begin again around the blue zone on May 19th. You might witness an unexpected surge in the #Altcoins market.
I hold(From Large to Small): CRYPTOCAP:SOL CRYPTOCAP:SUI CRYPTOCAP:ETH CRYPTOCAP:ADA CRYPTOCAP:XRP
Memecoins: $NAIIVE CA:0xB21b24F12c6125487a33fCF96aB06a5c74114444
Believe Ecosytem Meta Play 1.618 $0.034 and 5.618 $0.10Creator Buddy is a meta narrative play in the wider Launchcoin bonanza which I believe has a lot of upside in the current meta.
This just launched 2 days ago but is in a great buy zone to take advantage of any upside shots.
Launchcoin blasted 27x yesterday and this is part of the Internet Capital Markets (ICM) meta narrative that is playing out currently as the next major idea which is on Solana's L1.
The best dex to trade BUDDY is Jupiter.
There's a ton of mindshare circulating on Launchcoin and now people want to bid up the better narratives on the ecosystem, which I think BUDDY is one of those. This could see some explosive upside in the next few days.
Price Targets:
Initial Squeeze: 1.618 Fib (using Dexscreener's chart): $0.034 (priced in USD)
Initial Blowoff: 5.618 Fib: ~$0.10 USD
More info on BUDDY:
www.coingecko.com
Official Website:
www.creatorbuddy.io
Contract Address:
65svCEvM4HdBHXKDxfhjm3yw1A6mKXkdS6HXWXDQTSNA

Nothing !!!The SOL will increase $150 and reach to the top of the wedge in the coming weeks .
Give me some energy !!
✨We spend hours finding potential opportunities and writing useful ideas, we would be happy if you support us.
Best regards CobraVanguard.💚

HolderStat┆SOLUSD 180 $ flip, 200 $ nextSolana price escaped April’s consolidation box, flipped the old down‑sloping resistance into a rising support line, and is now pressing the 180 $ ceiling inside a well‑defined growing channel. A decisive daily close above 180 transforms that barrier into a launch pad, opening the measured channel extension toward 200‑205 $. Channel lows near 150 remain key invalidation for the bullish momentum.

Could SOL Break $200 and Fly 15% Higher Soon?Hello and greetings to all the crypto enthusiasts, ✌
All previous targets were nailed ✅! Now, let’s dive into a full analysis of the upcoming price potential for Solana 🔍📈.
Solana has finally broken out 🚀 — signaling the potential start of a strong bullish leg. With solid confluence between the daily support, Fibonacci retracement, and a well-respected monthly trendline, I’m eyeing a move toward the $210 leve l. A clean break above the key psychological resistance at $200 could confirm this setup. Stay alert — SOL is showing real strength 🔍.
🧨 Our team's main opinion is: 🧨
Solana has kicked off a strong move, and I’m targeting a 15% upside with a main target at $210, once the key $200 psychological level breaks with momentum 🚀.
Give me some energy !!
✨We invest hours crafting valuable ideas, and your support means everything—feel free to ask questions in the comments! 😊💬
Cheers, Mad Whale. 🐋

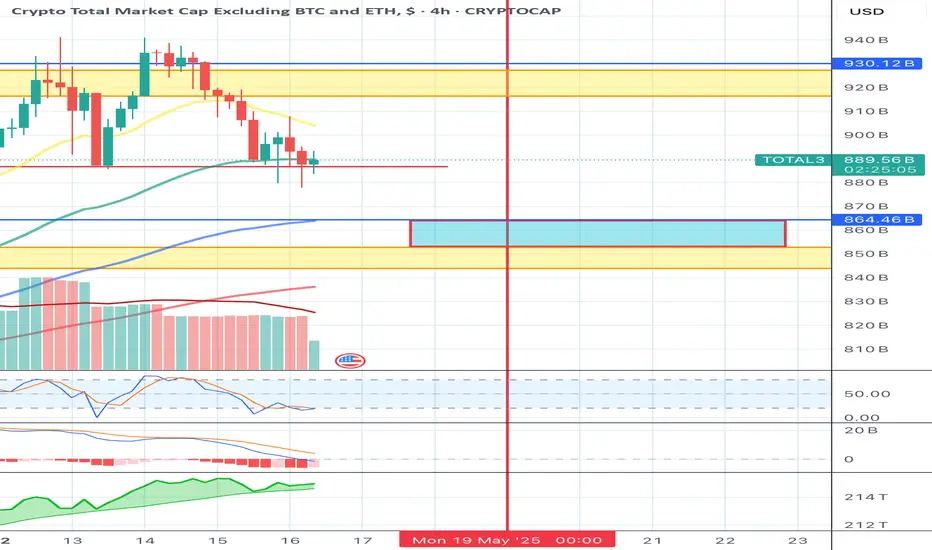
Altcoins Market Consolidation until 19th May 2025Total3 (Altcoins market cap) is currently consolidating between $900b-$930b expected until 19th May 2025 before the market continue to climb, just as I pointed out in last week’s analysis. No need to worry, #Altcoinseason is already here. A healthy correction is better than none.

$SOL rejecting resistance $50-75 targetSol looks to be rejecting resistance here, which sets it up for a large move lower.
I think it's likely that unless price can flip the resistance above as support, that we revisit the support levels.
Pretty simple chart. All of crypto looks the same, look out below.


$WEN on $SOL. Possible bottomAppears NASDAQ:WEN may have double bottomed at the .786 retrace of the entire 1-5 wave count.
Accumulating between .00015-.0002
This is an accumulate and HODL. Spot only. Small size, this type of token should only be purchased with funds you are absolutely willing to lose a large % of.
This is key. It will make it it a lot easier to HODL no matter what.
The goal is to hodl until it pumps, period.
Will update upon pump
small size, spot, patience
😉 goodluck

SOLUSD: Can it hit $1000?Solana is heavily bullish on its 1D technical outlook (RSI = 67.130, MACD = 11.423, ADX = 35.600) and just last week only crossed over its 1W MA50 again. This rebound started exactly on the 1W MA200, after holding the HL trendline of the Bull Cycle. Last time SOL crossed above its 1W MA50 after a HL, was on September 25th 2023 and a +1,122% rally unfolded. If macro and fundamentals assist, SOL can repeat this and reach the 1k mark (TP = 1,000).
## If you like our free content follow our profile to get more daily ideas. ##
## Comments and likes are greatly appreciated. ##

Solana can we hit 186 from this correction ? Hey everyone
currently Solana made a nice correction and looks like if price action can confirm it making a higher high this could be a nice spot for everyone to possibly look at taking a nice long position to 186-191
Let me know what you think
Kris/Mindbloome Exchange
Trade Smarter / Live Better

Solana Potential UpsidesHey Traders, in today's trading session we are monitoring SOL/USDT for a buying opportunity around 157 zone, Solana is trading in an uptrend and currently is in a correction phase in which it is approaching the trend at 157 support and resistance area.
Trade safe, Joe.

$TOTAL2: Altcoin bull market until April 2026Signal flashing here, very promising outlook for altcoins...
Follow me for more insights on how to maximize profits in the coming bullish cycle that is forming now, check out my signature for more info.
Best of luck!
Cheers,
Ivan Labrie.

MOODENG Up 1561% — Is a 50% Crash Next?MOODENG has gone full parabolic — launching from $0.0206 to $0.34 in just 36 days. That’s a staggering +1561% gain. But after a move this vertical, it’s time to ask the real question: can it sustain this pace… or is a correction looming?
Let’s break it down.
Technical Snapshot
MOODENG just tapped a major resistance zone — the 0.786 Fibonacci retracement (log scale) of the entire bear trend from $0.70 down to $0.0206. That drawdown was a brutal -97% over 143 days, defining the last macro bear cycle. The current rally has now retraced almost 80% of that decline.
And now? It’s knocking on exhaustion’s door.
RSI Screaming Hot
The RSI on the daily chart is currently at 96 — a level rarely sustained for long. Historically, these readings lead to sharp corrections as early bulls take profit and late buyers get trapped.
Key Structure:
The key swing high at $0.31982 was just taken out, possibly as a liquidity grab.
Price is now hovering at this level — hovering… or topping?
Potential Retracement Zone
If MOODENG enters a standard corrective phase, the $0.15411 level stands out. — it lines up as a logical 50–61.8% retracement zone from the recent parabolic leg. A return to that level would mean a -50%+ crash from current highs.
Short Trade Idea (On Confirmation Only)
Entry: Break below $0.32 and retest it as resistance
Stop-Loss: Above $0.34 (structure invalidation)
Target: $0.15411 (0.618 Fib retracement)
R:R: 7:1+
This setup requires patience. Don’t front-run it — let price lose $0.32 with conviction and treat a clean retest as your trigger.
📘 Bonus Insight:
Whenever you see extreme RSI paired with major Fib levels (like 0.786), you’re likely looking at the exhaustion phase of a move — especially when paired with psychological price levels and historical resistance. That’s where smart money exits… and emotional money enters.
🧠 Educational Note: Why You Should Be Cautious with Parabolic Moves
These kinds of explosive rallies are exciting, but they’re often unsustainable. When price goes vertical and indicators like RSI hit extreme levels, smart money starts exiting — and emotional money starts chasing.
Parabolic moves often end with sharp, sudden crashes. Chasing these tops may feel tempting, but more often than not, it leads to losses. The real edge comes from waiting — for structure, confirmation, and setups with defined risk. Don’t trade hype. Trade the chart.
Summary
MOODENG up +1561% in just over a month
Tapped the 0.786 Fib of its entire macro downtrend
Daily RSI at 96 → overheated
Break & retest of $0.32 = ideal short setup
Targeting a possible -50% correction to $0.15411
Keep your emotions out of it — parabolic runs like this are exciting, but it’s discipline that gets you paid. Let price confirm. Then strike. 📉🔥
