Breaking: $FARTCOIN Gearing For A Breakout To 1 Bln Market CapThe price of fartcoin has been surging consecutively, but failed to break the $1 pivot or resistant point withholding the asset from breaking the $1 billion market threshold.
The memecoin was created on the Solana blockchain through pump.fun, shortly after the community took over the project making it graduate to Raydium- a DEX on Solana ecosystem. Gaining momentum, the asset was listed on few CEX like Kucoin, GateIo, BingX, etc.
Fartcoin ($FARTCOIN) has made 3 attempts to break pass the $1 resistant but each move was denied making the asset to form a short-term head and shoulder pattern. while the asset is consolidating after the recent fit, failure to break the $1 resistant for $FARTCOIN might resort to a retracement to the $0.60 support point before picking liquidity up for a reversal.
Fartcoin Price Data
The Fartcoin price today is $0.760227 USD with a 24-hour trading volume of $292,550,722 USD. Fartcoin is down 15.66% in the last 24 hours. The current CoinMarketCap ranking is #77, with a market cap of $760,225,448 USD. It has a circulating supply of 999,998,256 FARTCOIN coins and a max. supply of 1,000,000,000 FARTCOIN coins.
Solana

Bittensor Breaks Descending Channel, 10X Potential Vs BitcoinAnother downtrend is reaching its end. You are about to experience something that you have never experienced before. You are about to feel something you have never felt before. You are about to become rich; buying, trading, holding, investing in Crypto. That's the experience you are about to embark on.
Another downtrend comes to an end. Here Bittensor—TAOBTC—is breaking out of a descending channel. As this breakout occurs, a downtrend is left behind. The end of a downtrend signals the start of a new trend. An uptrend.
The bottom already happened 7-April, this we already know. The action now is bullish-already and confirmed. Crypto is going up.
Potential is great, I am showing 690% on the chart. This would be profits, you need to add the 100% you put in. So total growth from current price to the main target on the chart would be 790%. Profits potential 690%. There can be more.
Bittensor can grow more than 10X vs Bitcoin.
These are true bottom prices. The best entry probable, the best timing possible... This is your chance.
Thanks a lot for your continued support.
Namaste.

SOL: The Leader#Solana is among the top 10 and stands as a key market mover.
It remains in a strong bullish trend, recently bouncing off the 111SMA. Three possible scenarios are presented, two bullish, and one more time-consuming.

SOL - Some new TA- IO and CVD increased regarding last highs (15.04.) but price has not broken Local Daily line. This means Big Money is shorting the Local Daily and absorbing Longs.
- Price is going up while Volume (OBV and AD) is decreasing in almost every time frame. Again. Big money is selling heavily to the Longs. The probability that Whale Sellers get exhausted is high too!
- 1H:
Grey line would be a nice Short if we can catch it.
Price on 0.78 Fib.
Risky...
1H Chart :
Follow for more ideas/Signals.💲
Just donate some of your profit to Animal rights or other charity :)✌️

Solana Bullish Based On Volume & Support, Or Crash?Solana is now bullish, I shall explain. Many signals are pointing to this fact, these are easy to see. Once I share them here, below, you will agree with me 100%. Correct?
Let's start with the easy part. Volume is rising and has been very strong lately. A significant rise in trading volume after a major drop and as prices grow is a signal that confirms any bullish development. The bullish development is the move and recovery above support.
Support is found as the 0.148 Fib. extension level, Solana trades above it. Support is the early August 2024 low. SOLUSDT trades above it. Support is EMA34, Solana closed daily above this level after resistance was met. Support found, bullish.
The RSI is bullish with a reading of 55. A bottom formation is present, v shaped pattern. Do you want more?
One signal is good but not enough. Two signals are good but we need more. Three signals can count toward reaching certain conclusions about what will happen next. When you have 5, 6, 7 strong signals all combined, it is hard to miss what the chart has to say. Too many signals now are pointing toward higher prices. Do you see any bearish signals?
You can say bearish only if you ignore the bullish signals.
Or you can say bearish if you don't have a chart.
If you are with me now —thanks for the support— you already know that Solana is set to grow.
Solana will soon trade above $400. Very easy, I know you agree with me because I showed you data to support my point of view. It is not done blindly. Everything I wrote can be confirmed by anyone, at any point in time. Now.
You can check each signal for yourself; what do you see?
I see a low 7-April followed by a quick recovery. I see the market now turning green.
Do you agree?
If you do, follow me.
Namaste.

Solana Climbs Amid Institutional Investments and ETF Backing Solana (SOL) has climbed to $134.35, marking a 0.89% gain over the last 24 hours and an impressive 20.39% increase over the past week. Its market capitalization now stands at $69.37 billion. Although 24-hour trading volume has declined by 14.73%, settling at $3.71 billion, bullish sentiment continues to build around the asset.
Institutional interest has intensified. Real estate fintech company Janover recently added over $10 million in SOL to its treasury. With more than 163,000 SOL now under management, Janover is following a similar strategy to MicroStrategy’s Bitcoin approach — buying, staking, and holding long-term. This move reinforces growing trust in Solana’s infrastructure and staking rewards.
Support for Solana also extends to regulated investment channels. Canadian institutions have backed Solana-based ETFs, adding another layer of credibility. These developments suggest that SOL is transitioning from a speculative asset to a longer-term investment holding.
Technical Analysis
On the chart, Solana recently broke structure (BOS) to the downside, indicating a growing bearish momentum. However, price found support and bounced off after recording a low of $95. Currently, the price is trading towards a high at $147. If it breaks above the the resistance, the price could extend toward $180, with potential continuation. Alternatively, if the breakout fails, a retest of the $110 zone may follow. The volume remains moderate, signaling cautious participation.
The recent bullish activity aligns with institutional accumulation and ETF exposure. Key levels to watch include $110 as support and $147 high as near-term resistance. A sustained move, break and close above $147 may confirm the next bullish leg for Solana.

Solana (SOL) Market Overview – April 17, 2025As of April 17, 2025, Solana (SOL) is trading at approximately $134.55 USD, reflecting a 5.48% increase from the previous close.
⸻
📈 Technical Analysis
Price Action & Momentum:
• Recent Performance: SOL has rebounded from lows near $120 to around $134.55, positioning itself as one of the top-performing altcoins recently.
• Support & Resistance Levels:
• Immediate Support: $120 – Crucial for sustaining the current bullish momentum.
• Resistance Zone: $133 – $135 – A breakout above this range could unlock further upside.
Key Indicators:
• RSI: 53.90 – Neutral momentum
• MACD: -3.01 – Slightly bearish
• Stochastic Oscillator: 92.14 – Overbought territory
• ADX: 19.10 – Weak trend strength
⸻
🧭 Fundamental Analysis
Network Strength:
• High Throughput & Low Fees: Solana continues to dominate with its scalable and low-cost blockchain infrastructure.
Institutional Interest:
• ETF Activity: Five ETF filings as of March 2025 highlight increased institutional trust in Solana.
Market Sentiment:
• Fear & Greed Index: 29 – Market is in “Fear” zone, potentially creating long-term buying opportunities.
⸻
🔍 Summary
Solana is showing bullish recovery signs driven by positive price action and ETF momentum. However, technicals suggest a cautious approach in the short term due to overbought signals and weak trend strength. Fundamentally, Solana’s powerful infrastructure and institutional support could fuel long-term growth.

Elliott Wave Update – Structure OverviewBINANCE:SOLUSDT
We may have found a potential local bottom at yellow Wave A, and are now tracking a move towards yellow Wave B.
This yellow Wave B appears to be unfolding as a 1-2-3-4-5 structure:
Waves 1-2-3 are likely completed.
Waves 4 and 5 could still be ahead.
This full impulse may form part of a larger A-B-C correction, completing the final yellow Wave B.
In the black wave count, the 1-2-3 move is finished.
Within Wave 3, we saw a clean internal 1-2-3-4-5, confirming the completion of that wave.
Currently, I’m tracking the move from black Wave 3 to black Wave 4 as a developing A-B-C correction:
Wave A is potentially in.
We are now in the resistance zone of Wave B, which could lead to the final drop into Wave C.
After completing Wave 4, I expect an upward move into black Wave 5, starting with an initial A-wave.
This should then form another A-B-C structure, leading to the completion of the final yellow Wave B.

SOL – Small pullback to then grab the liquidity?This 1H chart of SOLUSDT on Bybit showcases a clean bullish continuation setup after a strong impulsive move upward. The current price action suggests a strategic retracement into a high-probability zone of interest before a potential continuation toward buy-side liquidity.
---
1. Market Structure & Context:
- SOL has shifted market structure to the upside following a strong impulse that broke previous lower highs.
- The current pullback resembles a classic bullish retracement, aligning with smart money concepts where price revisits inefficiencies and discount zones before continuation.
- The low on the retracement appears to be forming a higher low relative to the previous structure.
---
2. Fair Value Gap (FVG) + Golden Pocket Zone:
- The blue box represents a clear Fair Value Gap created during the recent rally — a price imbalance often targeted for entries by institutions.
- Overlaying that zone is the Fibonacci golden pocket (0.618–0.65), a highly reactive retracement area in bullish moves.
- The confluence of FVG and the golden pocket makes this a powerful demand zone, supported by historical order flow behavior.
---
3. Fibonacci Levels & Price Action:
- 0.618–0.65 zone: Ideal entry region during bullish retracements. Price is currently reacting within this band.
- 0.786 level: A deeper retracement level that still supports bullish continuation if respected — though it marks the edge of the current FVG.
- The equilibrium between these levels represents a discount area for accumulation.
---
4. Liquidity Outlook – Buy-Side Liquidity (BSL):
- A clear BSL (Buy-Side Liquidity) sits above the previous local high.
- Price is likely to target this level as the next point of liquidity collection once the retracement completes.
- The green arrowed path shows the anticipated flow: a short-term dip into the FVG before a bullish move to sweep the BSL.
---
5. Trade Narrative:
- This setup reflects an entry based on optimal trade theory — retracement into a zone of inefficiency and discount (FVG + golden pocket).
- Bullish continuation is expected if this zone holds, especially with confluence from market structure and resting liquidity overhead.
- Ideal confirmation may involve lower timeframe bullish breaks of structure inside the FVG.
---
Summary:
SOL is offering a textbook retracement setup on the 1H, with price pulling back into a confluence of a Fair Value Gap and golden pocket (0.618–0.65). If the zone is respected, the next likely destination is the buy-side liquidity resting above previous highs. The reaction within this area will be key to validating the bullish scenario.

Trading opportunity for SOLUSDTBased on technical factors there is a Sell position in :
📊 SOLUSDT
🔴 Sell Now
🪫Stop loss 151.00
🔋Target 97.00
📏 R/R 2
💸RISK : 1%
We hope it is profitable for you ❤️
Please support our activity with your likes👍 and comments📝

Many bullish signs for Solana longSolana is starting to look like building bullish momentum.
Bullish signs:
Daily:
The price broke out of a prolonged descending parallel channel, retested the top trendline of the channel and started to move up.
The price broke and closed above EMA21 (first hurdle of many!) and has been above it for several days.
The price is above the major support zone around 117.
RSI and MACD are both still in the bear zone, however, they are clearly pointing up and about to enter the bull zone.
4H:
MACD and RSI are both in the bull zone.
The price is above EMA 22.EMA 21 is above EMA55.
EMA 200 is traveling horizontally across the recent price range, but the latest candle was strongly bullish and closed above all EMAs.
While EMA200 is horizontally moving, the price will probably oscillate in the range bound. But once EMAs line up for the bullish set up (EMA21 > 55> 22) in 4H, I will consider open a long position based on the 4H chart.

Solana H4 | Rising toward a swing-high resistanceSolana (SOL/USD) is rising towards a swing-high resistance and could potentially reverse off this level to drop lower.
Sell entry is at 144.76 which is a swing-high resistance.
Stop loss is at 154.00 which is a level that sits above a multi-swing-high resistance.
Take profit is at 122.98 which is an overlap support.
High Risk Investment Warning
Trading Forex/CFDs on margin carries a high level of risk and may not be suitable for all investors. Leverage can work against you.
Stratos Markets Limited (tradu.com):
CFDs are complex instruments and come with a high risk of losing money rapidly due to leverage. 63% of retail investor accounts lose money when trading CFDs with this provider. You should consider whether you understand how CFDs work and whether you can afford to take the high risk of losing your money.
Stratos Europe Ltd (tradu.com):
CFDs are complex instruments and come with a high risk of losing money rapidly due to leverage. 63% of retail investor accounts lose money when trading CFDs with this provider. You should consider whether you understand how CFDs work and whether you can afford to take the high risk of losing your money.
Stratos Global LLC (tradu.com):
Losses can exceed deposits.
Please be advised that the information presented on TradingView is provided to Tradu (‘Company’, ‘we’) by a third-party provider (‘TFA Global Pte Ltd’). Please be reminded that you are solely responsible for the trading decisions on your account. There is a very high degree of risk involved in trading. Any information and/or content is intended entirely for research, educational and informational purposes only and does not constitute investment or consultation advice or investment strategy. The information is not tailored to the investment needs of any specific person and therefore does not involve a consideration of any of the investment objectives, financial situation or needs of any viewer that may receive it. Kindly also note that past performance is not a reliable indicator of future results. Actual results may differ materially from those anticipated in forward-looking or past performance statements. We assume no liability as to the accuracy or completeness of any of the information and/or content provided herein and the Company cannot be held responsible for any omission, mistake nor for any loss or damage including without limitation to any loss of profit which may arise from reliance on any information supplied by TFA Global Pte Ltd.
The speaker(s) is neither an employee, agent nor representative of Tradu and is therefore acting independently. The opinions given are their own, constitute general market commentary, and do not constitute the opinion or advice of Tradu or any form of personal or investment advice. Tradu neither endorses nor guarantees offerings of third-party speakers, nor is Tradu responsible for the content, veracity or opinions of third-party speakers, presenters or participants.

SOLANA back above support. SOL is back above horizontal support. After a stop hunt, the manipulation is likely over. If the price can make a higher high here we start to build a choch of the structure. Momentum and trend oscillators are also in confluence.
Full TA: Link in the BIO

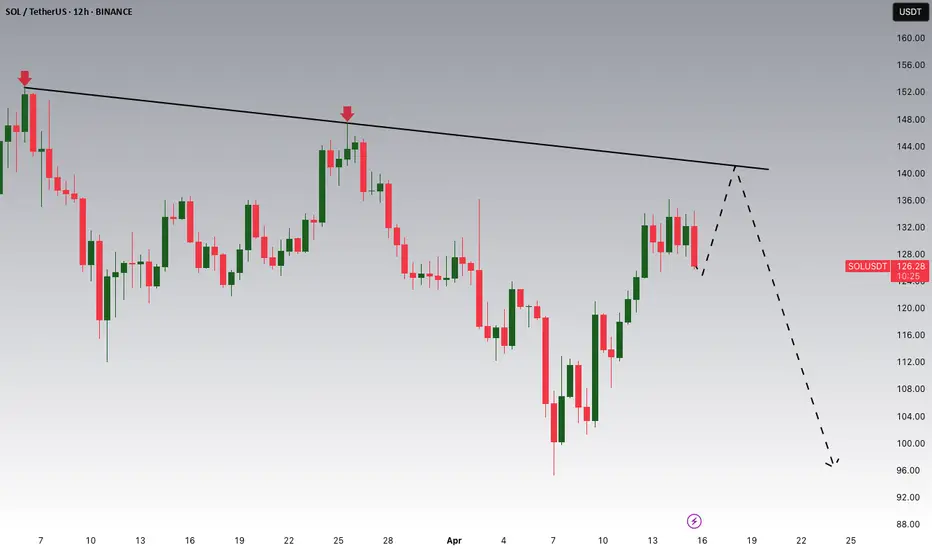
SOL - Longs on the Horizon!Hello TradingView Family / Fellow Traders. This is Richard, also known as theSignalyst.
📈 Medium-Term : SOL has been overall bearish and it is currently trading within the flat wedge pattern marked in red.
📍 As it retests the lower bound of the wedge — which perfectly intersects with the $100 round number — I’ll be looking for short-term longs.
🚀 In parallel, for the bulls to take over in the long term and kick off the next bullish phase, a breakout above the $147 previous daily high is needed.
Which scenario do you think will happen first — and why?
📚 Always follow your trading plan regarding entry, risk management, and trade management.
Good luck!
All Strategies Are Good; If Managed Properly!
~Rich

Solana Potential DownsidesHey Traders, in today's trading session we are monitoring Solana for a selling opportunity around 140 zone, SOLUSDT is trading in a downtrend and currently is in a correction phase in which it is approaching the trend at 140 support and resistance area.
Trade safe, Joe.
Canada Approves First Spot Solana ETFs, Launch Set For 16th AprThe Ontario Securities Commission (OSC) has approved the world’s first spot Solana (SOL) exchange-traded funds (ETFs), marking a major step forward for crypto investment products in North America. Beginning April 16, 2025, several asset managers—Purpose Investments, Evolve ETFs, CI Global Asset Management, and 3iQ—will offer direct exposure to SOL on Canadian exchanges.
Unlike derivatives-based products, these ETFs will hold physical SOL tokens, giving both institutional and retail investors a regulated way to invest in the Solana blockchain ecosystem. Each provider will track a separate index, allowing for a range of strategies. In addition, these funds will feature staking options, providing a potential yield advantage over other crypto ETFs.
With this approval, Solana becomes the third cryptocurrency to receive spot ETF approval in Canada, following Bitcoin and Ethereum. The news has sparked increased whale activity and fresh speculation that the United States could follow with its own Solana ETF approvals in the future.
Technical Analysis
Solana’s price has been trading below $150, consolidating within a wider range. The key technical level to watch is $147, which marks an internal structure lower high. A strong break and close above $147 could signal a bullish shift in market structure, potentially triggering upward momentum. On the other hand, if the price fails to close above this level, it may drop below $120, reinforcing bearish pressure.
The ETF launch could become a catalyst for either outcome, depending on how the market reacts to the new inflows. At present, Solana continues to trade just below the critical threshold, awaiting a decisive move as April 16 approaches.

SOL Bulls Strike Back — But Is It Sustainable?Solana continues to respect technicals with precision — after a +42.9% move from the $95 low, we're now at a pivotal moment in price structure. Let’s break down what’s happening and where the high-probability setups lie.
📍 Key Bounce Zone – Golden Pocket Confluence
Local Low: $95.26
Golden Pocket Zone (0.618–0.666): $97.09–$94.82
This area acted as a major demand zone, with price sharply rebounding.
First Volume Spike: Followed by retracement into Golden Pocket Zone at $102.
Second Volume Spike: Occurred right after touching Anchored VWAP ($108.21) from the $95.26 low, which added beautiful confluence with the Golden Pocket Zone – a secondary high-conviction long entry.
📈 Rally to Resistance – Short-Term Climax
After the anchored VWAP retest, SOL rallied into the key resistance zone aligned with the 0.786 Fib retracement from the previous down move — a historically reactive level and a prime profit-taking zone.
Monthly 21 EMA ($135.83) and the monthly 21 SMA ($133) — both key dynamic resistance zones.
Low-volume retest of that key high suggests buyer exhaustion, not continuation — a classic setup for a short-term reversal.
🧭 Current Market Structure
Current Price Action: Trading above both the weekly open ($128.38) and the monthly open ($124.54).
This forms a critical S/R zone between $124–$128, now acting as a potential battleground for bulls and bears.
As long as price stays above this zone, momentum remains with the bulls.
🔍 What to Watch Next – Reclaim or Reject?
Key Support to Watch:
$125 (psychological level) and monthly open at $124.54 – This zone is likely to be liquidity-hunted. Expect a sweep of this low, look for the reaction.
Daily Support Confluence: currently at 21 EMA: $123.77 & 21 SMA: $123.27
1.) 📈 Scenario A – Bullish Reclaim:
If SOL sweeps the low and shows strong buying reaction (bullish engulfing candle, volume spike), it sets up a potential long opportunity towards the weekly open, to watch for the next reaction.
2.) 📉 Scenario B – Failed Hold:
If there's no bullish reaction at $124–$125, expect further downside.
First target = $122
Second target = $120.65
🎯 Tactical Game Plan
Bulls:
Watch for reaction at $124–$125 – potential scalp long with tight SL.
Confirmation on volume expansion and break of $128.38 for continuation.
Re-enter long after clean retest of weekly open from above.
Bears:
Short setup possible if weekly/monthly open is broken and retested as resistance.
First TP = $122, second TP = $120.65.

SOLUSDT Holding Support, Targeting $150BINANCE:SOLUSDT bounced perfectly from the 0.618 Fib level and is now testing resistance. A small dip back to support is possible, but if $110 holds, we could see a strong move toward $150. Compared to other altcoins, SOLUSDT is showing real strength. Once the tariff noise clears, this could be one of the top performers. Always manage risk and set your stop loss!
BINANCE:SOLUSDT Currently trading at $118
Buy level: Above $112.5
Stop loss: Below $100
Target : $150
Max Leverage 3x
Always keep Stop loss
Follow Our Tradingview Account for More Technical Analysis Updates, | Like, Share and Comment Your thoughts

SOL USD LONG IdeaBased on a fibonacci speed fam from the all time low to all time high along with a fibonacci retracement both point out that the price has retraced down to the golden pocket areas. Based on the supoort holding, along with other indicators I'm using points out a very likely move to the upside of ~20%.

$SOL Bullish Engulfing Candle on Weekly CloseBig Bullish Engulfing candle for Solana on the weekly close.
Needs to breakthrough EMA9 and claim as support.
If not, we could see an inverse head and shoulders reversal pattern formed ~$112 before the next leg up.

Solana Rises Over 18% In Last 7 Days as ETF Talks Fuel OptimismSolana has gained strong upward momentum, trading around $130 in the last 24 hours. The token reached a new weekly high, outperforming many altcoins during the broader crypto market recovery. Growing speculation around the possible approval of a Solana Exchange-Traded Fund (ETF) has fueled this bullish movement.
Investor attention turned sharply after Bloomberg ETF analyst James Seyffart clarified that the U.S. Securities and Exchange Commission (SEC) has until October 10 to issue a final decision on the proposed Solana ETF. However, he also pointed out that early approval is still possible, though unlikely. Under the leadership of Paul Atkins and with input from Hester Peirce's Crypto Task Force, the SEC may fast-track decisions related to digital assets.
A Solana ETF could bring institutional capital into the ecosystem, similar to what happened with Bitcoin and Ethereum after their respective ETFs gained approval. Analysts believe that updated regulations, especially regarding asset custody and digital definitions, will be key in shaping the outcome. If progress continues, early approval remains a possibility, although most market watchers still expect a final decision closer to the October deadline.
Technical Analysis
On the chart, SOL has found support at a major demand zone around the $110–$115 range. The price is now trading above this area after reading below $100 at some point, marking an internal bearish break of structure. If the bullish momentum can sustain to trade and close above the recent lower high at around $147, that move would suggest a shift in trend.
If the price fails to maintain momentum and break above $147, bearish momentum will continue, with a potential retest of the support zone below $100.

SOLANA (SOL/USDT) – TP: 170 - 252 & 295SOLANA (SOL/USDT) is currently trading at $130.17 after rebounding from a well-defined sell-side liquidity zone between $98 and $131. The recent weekly candle shows a strong bullish recovery (+22.93%), suggesting that liquidity has been swept and buyers are stepping in. This level has historically served as a key accumulation zone, and the bounce aligns with oversold conditions on the StochRSI, which is now curling upward — indicating growing bullish momentum. If price sustains above the $125–131 level, the next immediate upside target lies between $170 and $188, where prior supply and consolidation occurred. A confirmed breakout above this range opens the path toward a higher resistance zone between $254 and $295 — a region that aligns with unfilled inefficiencies and previous price distribution.
The ideal swing trade approach would be to enter on a pullback within the $110–125 range, set a stop loss below $98, and scale out at the $170 and $254 levels. This setup offers a favorable risk-to-reward ratio of approximately 1:3.5.
Trade Strategy Suggestion (Swing or Positional):
Entry: Ladder between $115–$125 on retrace
SL: $105–110 (below wick low)
TP1: $170–188
TP2: $254–295
Scaling Out: 50% at TG1, rest at TG2 or trail stops above $200
With macro tailwinds like renewed interest in Solana’s DeFi and meme coin ecosystems, institutional flow returning, and technical confirmation across multiple timeframes, this could be a high-conviction mid-term play for swing traders and positional investors alike.
🔮 Narrative & Fundamentals:
ETH L2 congestion → SOL gets transactional inflows
SOL’s DeFi, NFT, and memecoin activity resurging (e.g., SEED_WANDERIN_JIMZIP900:WIF , SEED_DONKEYDAN_MARKET_CAP:BONK ecosystem)
Institutional flow picking up (Grayscale SOL trust rallying)
SOL remains one of the fastest L1s with growing developer traction

SOL/USDT – Potential Final Leg Down Before Major RallyBINANCE:SOLUSDT 🚀📉🔁
We are likely approaching one of the final moves down before a significant push higher. But before that, I expect one last move up to the $142 area, forming what I believe is a Red ABC corrective structure.
🔴 Red Wave A-B-C
Red Wave A has likely already completed, confirmed by a clean White ABC move.
We are now inside Red Wave B.
✅ Ideal Long Entry Zone
The ideal entry would be near the 88.7% Fibonacci retracement, which aligns with Green Wave B around $119.4.
From that level, I expect a drop down toward $100, completing Red Wave B.
🔄 What Comes After?
From the $100 zone, two possible scenarios for Red Wave C (or Wave 1 of a new impulse):
A 1-2-3-4-5 impulsive wave structure to the upside
Or a corrective A-B-C structure
We’ll need to carefully watch the first move out of the $100 zone:
A 5-wave move would suggest a new bullish impulse has begun
A 3-wave move might just be a larger corrective rally
🎯 Upside Target: $142
Once we hit $142, I anticipate another corrective move downward.
This could take the form of:
A clean ABC
A complex correction (A-B + 1-2-3-4-5)
Or even a direct impulsive 5-wave drop
Again, the key is watching the first leg down from $142 – whether it's impulsive or corrective will define the entire next phase.
⚠️ Summary:
Current focus: Entry near $119.4 (88.7% Fib), targeting $142
Caution: Expect volatility – structure will only become clear wave by wave
Watch: Reactions at $100 and $142 for structure confirmation
Let me know what you think below!
Like & follow if you enjoy deep EW breakdowns!
