SOLANA LONG Bullish Testing SupportNever the less as Solana trend looks bearish(Only from the point of view of price action traders, ema traders, breakout traders) and I DONT SHARE this opinion,because I use another TA to define the trend.
Monthly VP is at 0.02%, for VP traders it is bullish( while MA tradrs say it is bearish).
The price of solan is at historical lowest point of VAL(18 month volume profile).Therefor at this point sellers and buyers dont find an accepted price .If the sellers want to push down theprice,the number of buyers reduces.This leads to a market balance,as now many imbalances have been restored.While EMA,SMA and many other indicators are lagging indicators,they react when the show is over!!!!!!,VP delivers price information real time
Also now commercials starting buying solana(COT report) while speculators selling it(Speculatorsare90% of time wrong)!
Ofcourse many would suggest that we have bearish sentiment dat,inflation, recession etc.
Fundamentlas show their impact alsotoo late. And all these information are priced in.
Ok now to my setup:
We have tested the support twice successfully. Solana can start to move in TP 1 direction.
If price reaches tp1
and continues to move ahead,this will be a good sign that Solana bulls gaining more control, while sellers start to take profit.
If TP 1 rejects,we expect that solana will fall back to support going for TEST 3.
IF SUPPORT TEST § WAS SUCCESSFUL.tHAT MEANS sOLAN CANNOT BREAK THIS SUPPORT THE MARKET STARTS TO MOVEUP QUICKLY to TP 2,3,4 and 5
If solana not successful, then it targets 115% Fibo retracement, and then 127% and so on. For us it means to wait until one of the retracement levels rejects
I buy there where others put their stops,because their stop management is planned by price action, that everyone can see.Therefor 90% of time they fail.
Solana

SOL/USDT May SOL lose the weekly support? Key Level to buy!Hey traders! 👋 Let’s dive into the weekly chart for SOLUSDT.
📊 Current Price Action:
SOL is trading at $112.20, down 10.96% on the weekly chart. The price has been consolidating in a "Buying Zone" between the weekly support levels of $110.17 and $131.68. This zone has historically acted as a strong base, with the price bouncing from this area multiple times since late 2023.
🟢 Buying Zone and Support:
The current price is sitting in a critical "Buying Zone" between $110.17 and $131.68. This area has acted as a springboard for previous rallies, and if SOL holds above $110.17, it could be a good opportunity for accumulation. A break below $110.17, however, might lead to further downside toward the next support at $80.18 or even $54.00.
🎯 Target:
If SOL manages to break through the $195.71 resistance, the next major target is its previous ATH at $260. I’ve projected a potential move to $295.71, which would be a 95.71% increase from the current price of $112.20. This target aligns with the historical price structure and Fibonacci extensions.
⚠️ Risk Management:
Keep an eye on the $110.17 support. A weekly close below this level could signal bearish momentum, potentially driving the price toward lower supports. On the upside, watch for a strong breakout above $195.71 with high volume to confirm the bullish scenario.
What do you think about SOL’s setup? Are you bullish or bearish on Solana? Let’s discuss in the comments!
#SOLUSD #Solana #Crypto #TechnicalAnalysis #Breakout

SOLANA(UPDATE)Hello friends
Due to the heavy price drop, you can see that buyers are slowly entering and the price is creating a good ascending channel, which now provides a good opportunity to buy in stages and with capital management and move towards the specified goals.
Don't forget to save profit on each target.
*Trade safely with us*

SOLANA at key support zone - Is $160 within reach?BINANCE:SOLUSDT has reached a major support level, an area where buyers have previously shown strong interest. This zone has acted as a key zone, increasing the likelihood of a bounce if buyers step in.
A bullish confirmation, such as a strong rejection pattern, bullish engulfing candles, or long lower wicks, would strengthen the case for a move higher. If buyers take control, the price could rally toward the $160 target. However, a decisive breakdown below this support would invalidate the bullish scenario and could lead to further downside.
This isn’t financial advice, just my take on how I approach support and resistance zones. Best to wait for clear confirmation, like a strong rejection or a volume spike, before making a move.
Every trader has a unique perspective. Let’s discuss this setup within the TradingView community!

Primer: Solana - A Blazing BlockchainCME Group’s newly launched Solana futures enable institutional grade access to the cryptocurrency, offering investors access to compelling relative value opportunities.
This paper provides a background to Solana in relation to other major blockchain networks and cryptocurrencies. Mint Finance will outline the execution of crypto market spread trades using CME futures in an upcoming paper.
Solana is a high-performance public blockchain launched in 2020 by Solana Labs, founded by Anatoly Yakovenko (a former Qualcomm engineer). Yakovenko first proposed Solana’s novel Proof of History (PoH) concept in 2017 as a solution to blockchain scalability. He assembled a founding team including former Qualcomm colleague Greg Fitzgerald and others and named the project after a California beach town.
Backed by early venture funding, Solana’s mainnet launched in March 2020. The vision was to enable ultra-fast, low-cost transactions for decentralized applications (e.g. DeFi, gaming), addressing limitations of Bitcoin & Ethereum in speed and fees.
Solana has grown rapidly to become one of the most used networks and amassed a market cap of USD 64 billion, making it one of the largest digital assets. What is behind the massive surge? Is it due to flip ETH as the home of DeFi?
How Does Solana’s Blockchain Rank?
While Solana’s low fees and fast transaction speeds have driven high trading volume, transaction count, and wallet growth, it still trails ETH in Total Value Locked (TVL). To achieve its high transaction throughput, Solana has made certain compromises on decentralization.
In terms of ecosystem development, Solana is seeing rapid growth. The Electric Capital 2024 developer report found Solana attracted the most new developers in 2024 – more than any other ecosystem (even Ethereum’s, despite Ethereum’s broader base).
Solana now has ~2,500 monthly active developers, second only to Ethereum’s ~8,900 (which includes many working on Layer-2s). This loyal & expanding developer base has been a key factor behind Solana’s explosive growth.
DEX Surge and Meme Coin Mania
Solana’s early growth was driven by NFTs, supported by low fees and a loyal community that made it a hub for NFT trading. These factors continued to attract users even after the NFT boom subsided. Its fast, low-cost blockchain and strong developer base have enabled the launch of many user-friendly and popular applications. More recently, Solana’s growth has been fuelled by surging decentralized exchange (DEX) volumes and a wave of meme coin minting.
By November 2024, meme coin trading accounted for an all-time high 65% of monthly DEX volume on Solana’s largest DEX, Raydium. Raydium even overtook Uniswap in monthly volume that month.
Solana’s advantages in cost and speed have been pivotal in this trend. Transaction fees on Solana are negligible and on-par with L2 chains. This cost advantage makes minting and trading low-value tokens (like meme coins) economically feasible on Solana but prohibitively expensive on Ethereum layer-1. Similarly, Solana’s block times (~0.4 seconds) and high throughput enable rapid trading. Traders can execute many rapid swaps on Solana DEXs without the delays and slippage that Ethereum’s ~12-second blocks and occasional congestion introduce. Solana’s speed and low fees thus attracted a flood of retail speculators for meme coins and high-frequency trading strategies.
Ethereum’s ecosystem still offers deeper liquidity and broader dApp selection, but Solana capitalized on specific niches (e.g. meme coins, real-time trading) where Ethereum’s costs are a barrier.
However, this explosive growth was not without turbulence. In early 2025, a “meme coin meltdown” saw activity cooling off after several scam tokens collapsed. By February 2025, Solana’s share of total on-chain DEX volume, which had topped 51% in January, retreated to 24% as some froth cleared.
Data Source: Artemis
Scandals like a fake “Libra” token (which vaporized $4.4B in market cap) and a Trump-themed token rug pull dented retail sentiment. Even so, Solana’s DEX volumes remain on par with Ethereum’s entire ecosystem (L1 + L2), a remarkable feat. VanEck’s Feb 2025 report noted that despite an 80%+ drop in new meme token launches since January, Solana DEX activity “is still holding its own – roughly matching the entire ETH ecosystem”.
In short, the meme coin mania has demonstrated Solana’s capacity to manage massive retail-driven bursts of activities that might overwhelm other chains.
Market Metrics For BTC, ETH, and SOL
Since the bottom of the bear market following the FTX collapse. Solana has delivered a stunning recovery, far outperforming both BTC and ETH, but the massive gains were partly explained by the much sharper decline following FTX.
During 2024, SOL performance moved in lockstep with BTC with both assets delivering stunning returns. However, the performance diverged sharply after Jan/2025, coinciding with the collapse in DEX trading volume. The sharp correction since has erased most of the 2024 gains while BTC has remained resilient.
Solana has, nevertheless, managed to outperform ETH which has suffered an even deeper correction over the past few months.
Data Source: TradingView
Historical volatility for all three assets shows a similar trend but differ in magnitude. SOL has the highest volatility while ETH follows second and BTC is least volatile. During spikes, the differences become exaggerated, but during lows, the values can reach similar lows.
For traders, higher volatility can be both an opportunity and a risk.
While SOL’s performance is positively correlated with both ETH and BTC, this correlation breaks frequently (more commonly with ETH) and these periods of divergence present compelling spread opportunities.
The trend for implied volatility (IV) is like HV with SOL’s IV the highest and Bitcoin’s IV the lowest. Recently, IV has started to edge up again following a decline through March.
Trading Solana and Crypto Spreads
With the launch of CME’s Solana and Micro Solana futures, investors can express views on Solana’s growth and take tactical positions that benefit from relative outperformance. Mint Finance will outline the execution of crypto market spread trades using CME futures in an upcoming paper.
CME Solana futures provide exposure to 500 SOL per futures contract and reference the CME CF Solana-Dollar Reference Rate.
CME Micro Solana futures offer a smaller notional value to create more balanced spreads and for fine-tuning exposure. The micro contract provides exposure to 25 SOL.
Additional details about the contract including margins, calendars, and specifications are available on the CME Solana product page .
MARKET DATA
CME Real-time Market Data helps identify trading set-ups and express market views better. If you have futures in your trading portfolio, you can check out on CME Group data plans available that suit your trading needs tradingview.com/cme .
DISCLAIMER
This case study is for educational purposes only and does not constitute investment recommendations or advice. Nor are they used to promote any specific products, or services.
Trading or investment ideas cited here are for illustration only, as an integral part of a case study to demonstrate the fundamental concepts in risk management or trading under the market scenarios being discussed. Please read the FULL DISCLAIMER the link to which is provided in our profile description.

SOL/USD Technical Analysis (March 31, 2025)🔹 Potential Scenarios:
✅ Bullish Path (Green): If the price holds above the Golden Pocket (119.89 - 121.15) and breaks 147.38, it may continue rising toward 165-176 and possibly 201-210.
❌ Bearish Path (Red): A drop below 112.40 could push the price toward 109-119, and further breakdown may lead to 78-86 or even 51-57 in extreme cases.
🔄 Neutral/Alternative Path (Yellow): If support holds but no strong breakout occurs, the price may consolidate and later move in either direction.
💡 Key Levels to Watch:
Resistance: 147.38, 165-176, 201-210, 272+
Support: 119-121 (Golden Pocket), 112.40, 78-86, 51-57
📌 Keep an eye on price reactions at these levels to confirm the next move.

SOL | Accumulation Zones | BEST BUY ZONESSolana has topped out after its new ATH in January, and it has clearly marked the beginning of the bearish cycle since then.
The bearish-M pattern in quite significant in the weekly timeframe. ( More info on that pattern here, on the ETH chart ):
From a technical indicator perspective, we see a clear "sell" sign - a strong signal from a trend-based indicator:
Which every way we are heading down (stair step or pin drop), there are a few noteworthy zones to watch:
_______________________
BINANCE:SOLUSDT

Breaking: $VINE Spike 40% Gearing up for 120% Surge SEED_ALEXDRAYM_BIGMAC:VINE broke out of a falling wedge today, surging nearly 40% and now gearing up for a massive surge with 120% in sight.
VINE, since token listing, saw its value depreciate by over 94% amidst increased volatility and the fade of meme coins on the Solana ecosystem.
Currently up 39%, SEED_ALEXDRAYM_BIGMAC:VINE once surged to as high as almost $500 million in market cap before retracing to $47,745,773.09 million market cap. With about $177,738,447.8 million traded in the past 24 hours representing a 96% surge in trading volume, SEED_ALEXDRAYM_BIGMAC:VINE looks poised for a 120% legged-up with build up momentum as indicated by the RSI at 76.82.
With listings on major exchanges likes Kraken, HTX, Bitget, OKX, GateIO, MEXC, BingX, etc, SEED_ALEXDRAYM_BIGMAC:VINE has already solidified its stay here in the Solana ecosystem and a 120% breakout will ignite the fire once put out by the bears.
About Vine Coin
SEED_ALEXDRAYM_BIGMAC:VINE is a meme coin: January 18, 2025, Elon Musk says he is "looking into" bringing back Vine, and @rus, CEO of Vine, just launched a meme coin. Vine was a once-popular short video sharing platform that allowed users to shoot and upload videos up to 6 seconds long. Launched in 2012, it quickly gained a massive user base, especially among young people. Vine videos usually played in a loop, and users showcased their creativity and humor by producing various types of content. Many videos went viral on social media. In 2017, Twitter (Vine's parent company) announced the platform's shutdown. Although Vine has ceased operations, its impact remains significant, as many creators gained fame on the platform and moved to other sites like YouTube and Instagram.
Vine Coin Price Live Data
The live Vine Coin price today is $0.045998 USD with a 24-hour trading volume of $171,878,116 USD. Vine Coin is up 34.31% in the last 24 hours, with a live market cap of $45,997,451 USD. It has a circulating supply of 999,994,104 VINE coins and the max. supply is not available.

Solana LongBulls need some motivation.
Major trend bearish,but short term bullish pullback.
Possibly it holds until APRIL 1st 2025-If Profit targets can not hold above daily support,then time to liquidate the positions, and get out earlier.

Solana Trading planSolana Trading plan
Key zone for long 122
1st short zone - 152
2nd short zone 175 - 180

SOLUSD Solana Bullish Change: LongAs I published yesterday the bearish trade setup,shortly before reaching the profit target,I have closed it manually and updated below the trade idea in the comment section,to inform you. Because of bullishness of tech,and weaker USDolalr, now crypto,specially Bitcoin, Solana and Eth following Tech: Bullish.
Important:
177.93 (red line9 IS MAJOR RESISTANCE: AND PROTECTED TWICE BY THE EBARS;WHO CONTROL THAT REGION:
Once broken Solana can climb higher to 228-244. If not, we will face sudden fast drop down, and possible midterm bearish sideways:
aS IT WILL BE THE THIRD ATTEMPT OF sOLANA TO BREAK THIS MAJOR RESISTANCE; IF NOT SUCCESSFULLY; WE CAN ESTIMATE BEARISH SIDEWAYS8sALAMI DOWNRUN).
Also it will be possible,that in April 2025 because of Trumps tariffs, the market participants
will liquidate their positions immediately,capital outflow.
Currently as Godl and silver also bearish,check my other ideas, the bullish trendchange is cinfirming.
Neverthe less I mad 4 different setups and profit targets,to help ya making better decisions.
Additionally expect the unexpeted:If the market conditions change before your profittarget reached,take that profit and prepare for the other direction.
Volatility and many unexpected events awaiting us.
I,for my part,ignore news, even what Trump says,and just focus to the chart, because it tells exactly when then market starts to change its direction.So I recommand ignoring the hype and news, but being focused on what the market and price does:The market is always right!
Have a nice day.

SOLUSD: Bottom formation in process. Target 350.Solana just turned neutral on its 1D technical outlook (RSI = 48.726, MACD = -4.803, ADX = 29.746) as it is approaching the 1D MA50 following a strong rebound on both the S1 Zone but more importantly the 1W MA100. Straight after the low, the market formed a 1D Death Cross. The previous such pattern (September 6th 2024) was formed again on a market low on the S1 Zone. Whether the rebound takes effect immediately or 2 months (max) after, we see this as a great buy opportunity to aim at the HH Zone and the 2.618 Fibonacci extension (TP = 350.00).
## If you like our free content follow our profile to get more daily ideas. ##
## Comments and likes are greatly appreciated. ##

ETHUSD ETHEREUM Long following TechNasdaq turns, crypto follows.
Eth,Solana and bitcoin ,also XRP temporarily changing their directions to follow tech hype, and Trump´s tariffs-announcments.
There is no rational reason in behind of it: As traders we never care,what people say or do! We only follow the price,changes,and our trading rules.Only! What others say in the news or Social media, doesnt care us as traders,because we have understood that only the market is right.If the market says,go long,we follow.If market says,Sell! Then we go short.
Also dealing with quick profit taking is essential. We see that our profit target showing us attractive and lucrative profit numbers, and we get emotional: But the market says:Take that little profit and Get out here! Or Come with me in my direction,otherwise I will take away your profits!
As traders we have no emotional, and zero tolerance for emotional issues,regarding trading!
Therefor we are flexible. We have only one goal: Making Money!
As much and as many as we can! sIMPLE1
4 approches,with short term,midterm,profit taking targets.
Also keep it mind that the green zones are no stop loss zones,but they represent areas where we can cover more longs.

SOLUSDT BuyBullish signal on Solana H4 chart. Price is already outside of triangle pattern. Now market wants to creat new consolidation 138 - 145 levels. Risk reward 1/3

solana in the next few dayswe will see bearish on solana in the next few days
we see that 120 usd per solana is good price to enter

The key is whether it can be supported and rise near 137.28
Hello, traders.
If you "Follow", you can always get new information quickly.
Please also click "Boost".
Have a nice day today.
-------------------------------------
The April TradingView competition is sponsored by PEPPERSTONE.
Accordingly, we will look at the coins (tokens) and items that can be traded in the competition.
Let's talk about the SOLUSD chart.
--------------------------------------
(ETHUSD 1D chart)
The circled sections on the chart are important support and resistance sections.
Since the M-Signal indicators on the 1D, 1W, and 1M charts are passing through the 137.28-180.38 range, it is important to see whether it can receive support and rise this time.
If it fails to rise, it is likely to fall to the Fibonacci ratio range of 2 (80.31) ~ 1.902 (88.47).
-
We need to see if the OBV can rise above the Fibonacci ratio of 1.27 (141.08) as it rises above the middle line.
Since the OBV indicator itself has fallen below the 0 point, there is a high possibility that the selling pressure will increase.
Therefore, we need to check the support and resistance points when the OBV rises above the 0 point.
If it shows support near 180.38, I think it is highly likely that it will turn into an upward trend and rise.
-
Therefore, when the competition starts, check if it is located in the 137.28-180.38 range, and if not, it is expected that a sell (SHORT) position will be advantageous.
Even if the price is maintained above 137.28,
- There is a possibility that it will be difficult to maintain a buy (LONG) position due to the fact that the OBV is located below the 0 point,
- The M-Signal indicator on the 1W, 1M charts is in a reverse arrangement, etc.
-
Thank you for reading to the end.
I hope you have a successful transaction.
--------------------------------------------------
- This is an explanation of the big picture.
I used TradingView's INDEX chart to check the entire range of BTC.
I rewrote it to update the previous chart while touching the Fibonacci ratio range of 1.902 (101875.70) ~ 2 (106275.10).
(Previous BTCUSD 12M chart)
Looking at the big picture, it seems to have been following a pattern since 2015.
In other words, it is a pattern that maintains a 3-year bull market and faces a 1-year bear market.
Accordingly, the bull market is expected to continue until 2025.
-
(Current BTCUSD 12M chart)
Based on the currently written Fibonacci ratio, it is displayed up to 3.618 (178910.15).
It is expected that it will not fall again below the Fibonacci ratio of 0.618 (44234.54).
(BTCUSDT 12M chart)
I think it is around 42283.58 when looking at the BTCUSDT chart.
-
I will explain it again with the BTCUSD chart.
The Fibonacci ratio ranges marked in the light green boxes, 1.902 (101875.70) ~ 2 (106275.10) and 3 (151166.97) ~ 3.14 (157451.83), are expected to be important support and resistance ranges.
In other words, it seems likely to act as a volume profile range.
Therefore, in order to break through this section upward, I think the point to watch is whether it can rise with support near the Fibonacci ratios of 1.618 (89126.41) and 2.618 (134018.28).
Therefore, the maximum rising section in 2025 is expected to be the 3 (151166.97) ~ 3.14 (157451.83) section.
To do that, we need to look at whether it can rise with support near 2.618 (134018.28).
If it falls after the bull market in 2025, we don't know how far it will fall, but considering the previous decline, we expect it to fall by about -60% to -70%.
So, if the decline starts near the Fibonacci ratio 3.14 (157451.83), it seems likely that it will fall to around Fibonacci 0.618 (44234.54).
I will explain more details when the downtrend starts.
------------------------------------------------------

SOL buy/long setup (4H)In the hourly timeframes, bullish signals are visible on the Solana chart.
The trigger line has been broken. Bullish (ICH) is present on the chart. Higher lows (L) are forming.
We are looking for buy/long positions in the demand zone.
A 4-hour candle close below the invalidation level will invalidate this analysis
Do not enter the position without capital management and stop setting
Comment if you have any questions
thank you

Solana (SOL) 22.03.2025In the near term, Solana (SOL) is showing a desire to return to its price channel, but further asset allocation is likely to be delayed until the summer of 2025. Despite the possible optimistic outlook for growth, it is worth preparing for corrective moves in September. SOL is among the three assets where market makers are already active, which may indicate artificial liquidity maintenance or position accumulation.
Significant growth is likely to be expected in Ethereum (ETH), while recent momentum is more likely to manifest itself in Bitcoin (BTC) and Solana (SOL). The long-awaited altcoin season may start soon, which requires investors to be more selective. It is recommended to reallocate capital from fundamental assets to high-risk instruments with growth potential, keeping a balance between risk and return.
Special attention should be paid to the Solana ecosystem, where promising projects such as PRCL are already present, which emphasizes the technological and investment attractiveness of blockchain.
Alex Kostenich,
Horban Brothers.

SOL up to 300$I hope you are ready for a $300 flight before the new year. I would expect a hike to the 1.618 level and a powerful breakout soon.

Solana — a correction to around $180-$200.A correction to around $180-$200, marking the start of the bearish phase.

SOL - its not just a SOL!Thats SOL, The ORange shall likely happen when market falls to the block, Somehow if vol comes on the OB, the red arrows what shows, takes place.However, more pressure leads to the fall till 128, but from rage 135 to 129 is the best buys to 167, even 178 as well!!

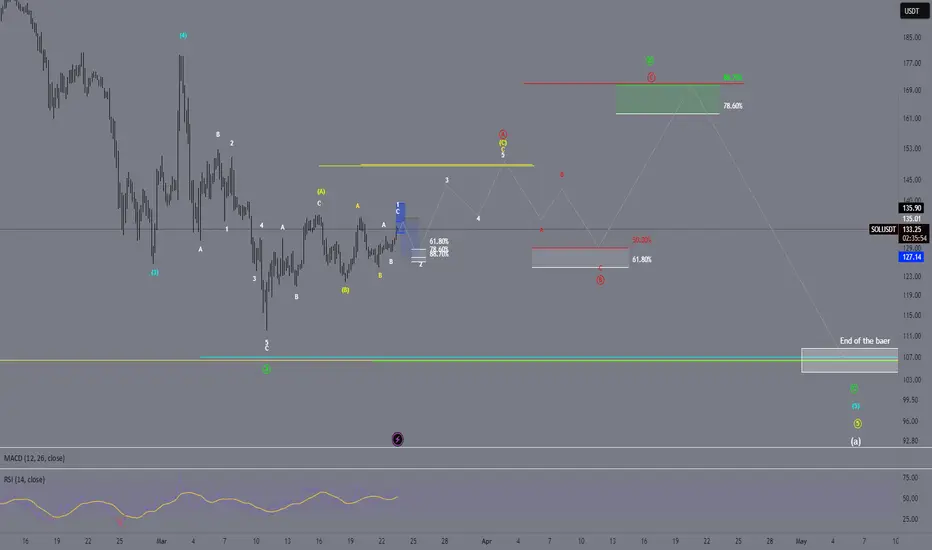
Solana (SOL) Elliott Wave Analysis – Potential Roadmap for UpcomMEXC:SOLUSDT
Overview:
This analysis examines Solana’s current Elliott Wave structure. The chart suggests a potential correction (blue zone), followed by a strong upward impulse (Wave 3), and later a larger ABC corrective phase (red letters) before potentially resuming a bullish trend.
1. Short-Term Scenario (Blue Zone)
- Complex Correction: The price has recently undergone a multi-wave correction and is approaching a potential buying zone.
- Fibonacci Levels: Zones around 61.8% and 78.6% may act as support levels where the correction could end.
- Entry Opportunity: If the price tests these levels and shows signs of forming a base, this could be a favorable entry point.
2. Next Upward Impulse (Wave 3)
- Strong Move: Once the correction concludes, an impulsive upward movement (Wave 3) could kick off, typically the most dynamic leg in an Elliott Wave cycle.
- Target Area: The highlighted yellow zone in the chart indicates a key resistance level that the market could aim to hit.
3. Mid-Term ABC Correction (Red Waves)
- After the Impulse: Once the impulsive upward move (Wave 5) completes, a larger ABC corrective phase is expected (denoted by red letters).
- Retracement Levels: Fibonacci retracement levels around 50% or 61.8% may serve as critical support zones during this correction.
4. Long-Term Perspective
- Renewed Bullish Trend: Following the completion of the ABC correction, there is the potential for Solana to resume its bullish trajectory.
- Target Zone: The green area in the upper section of the chart represents a possible long-term resistance or target level where a significant market decision could take place.
Conclusion:
- Short-Term: A correction toward the blue zone is possible, which may offer a good entry opportunity if support holds.
- Mid-Term: A robust upward impulse toward the yellow resistance is anticipated, likely followed by a larger ABC correction.
- Long-Term: Once the correction completes, Solana could resume an upward trend, setting the stage for a new bullish phase.
- Disclaimer: This analysis is for educational purposes only and should not be considered financial or investment advice. Always practice proper risk management when trading.
First MEME coin created by AI Agent - GOATGoatseus Maximus Aka GOAT, currently traded around $0.85 with all time high of $1.35 at 17th November 2024. GOAT also faced significant corrections today.
Current lower time frame chart 4H, I can see there is possible breakout and the price action will be back to $1 soon. I think this is the last chance to buy GOAT.
Note: As moneys are currently flowing in CRYPTOCAP:BTC , expect some will flow to others utility and bluechips coins, such as CRYPTOCAP:ETH , CRYPTOCAP:SOL and the previously dethroned $XRP.
